. 2023 Aug 17;186(17):3674-3685.e14.
doi: 10.1016/j.cell.2023.06.022. Epub 2023 Jul 25.

Modeling epigenetic lesions that cause gliomas

Affiliations

Modeling epigenetic lesions that cause gliomas

Gilbert J Rahme et al. Cell. .

Abstract

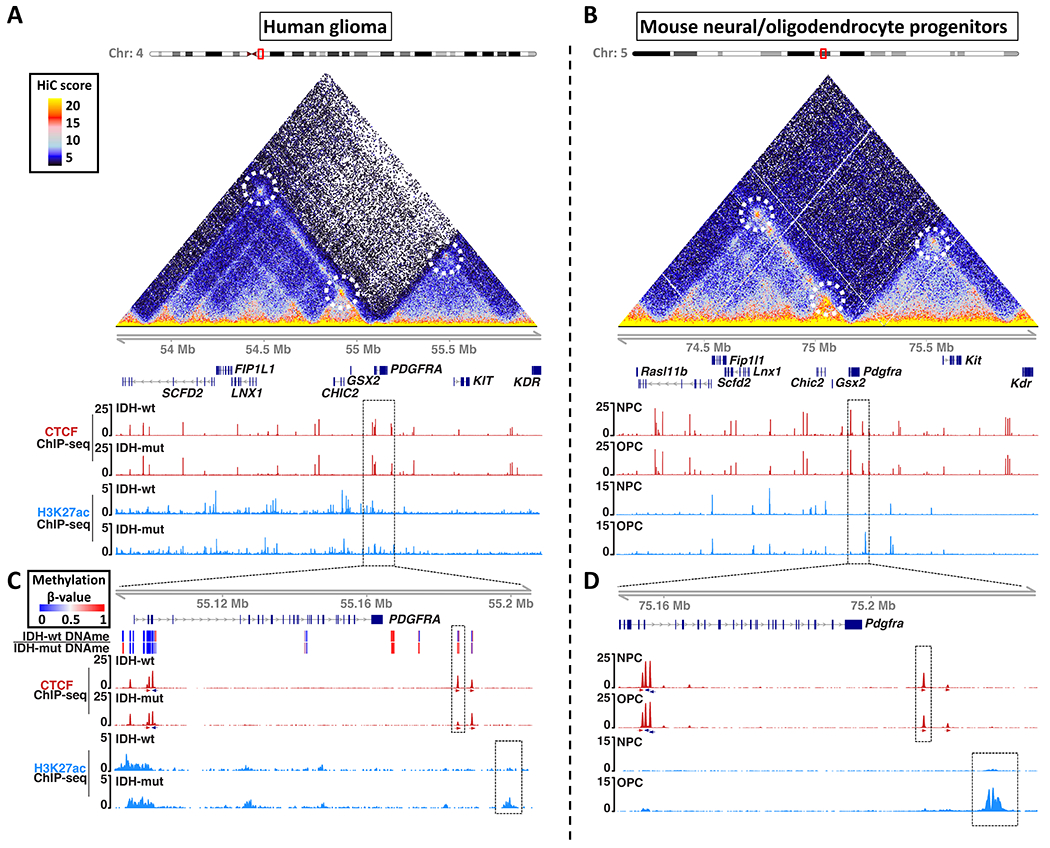
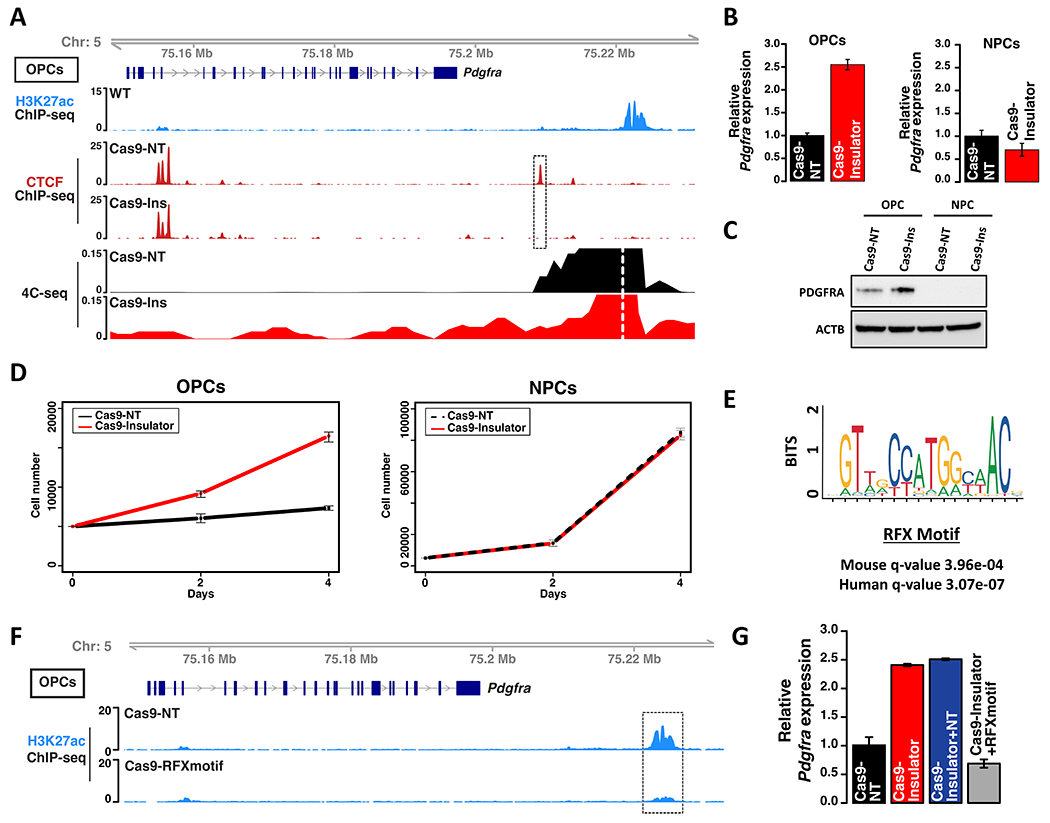
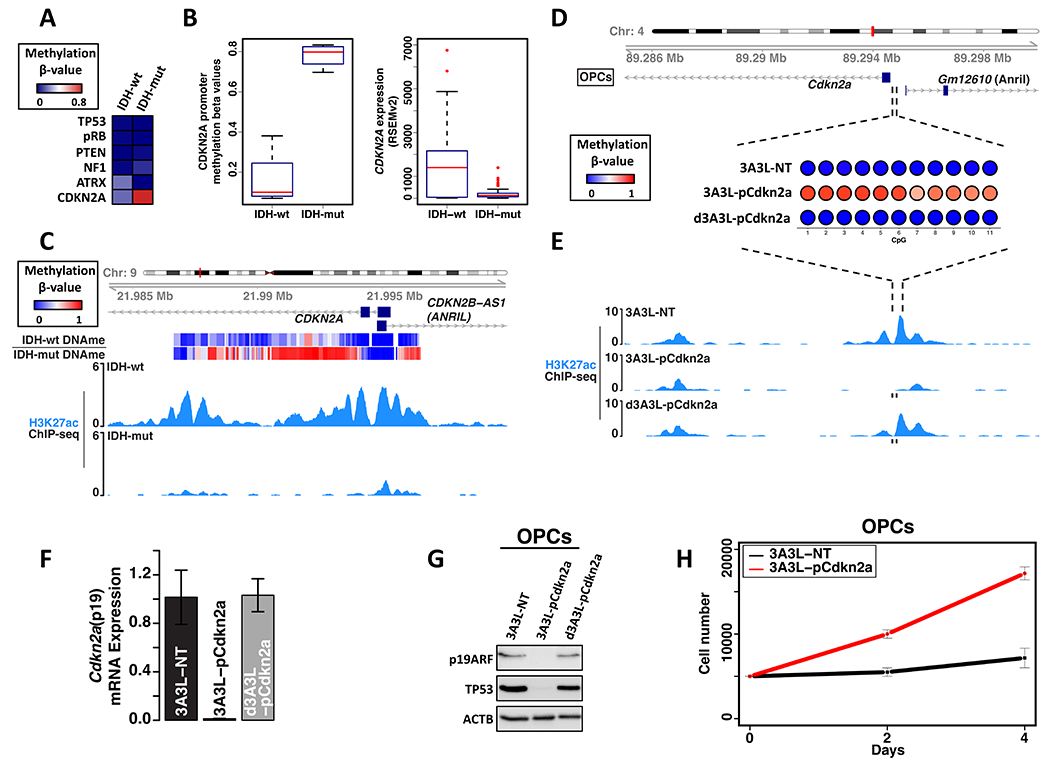
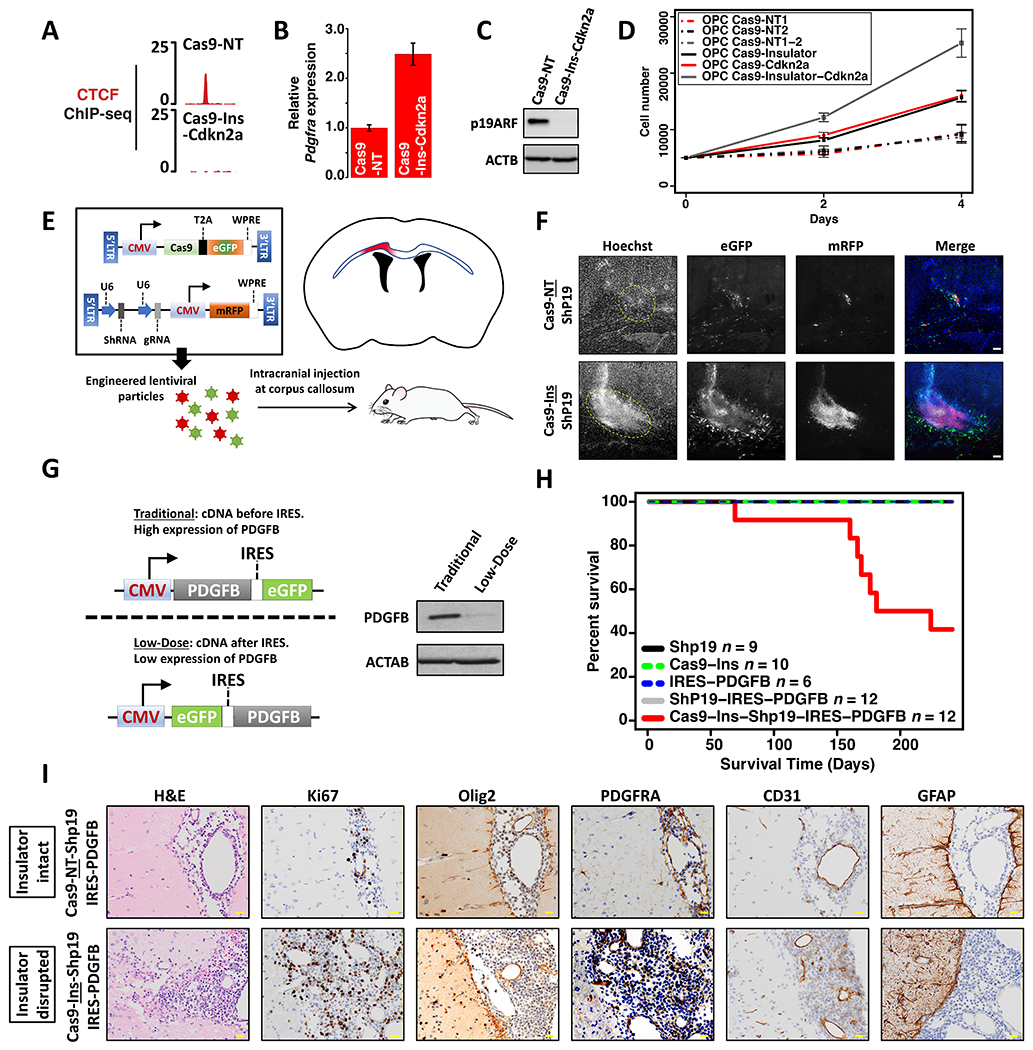
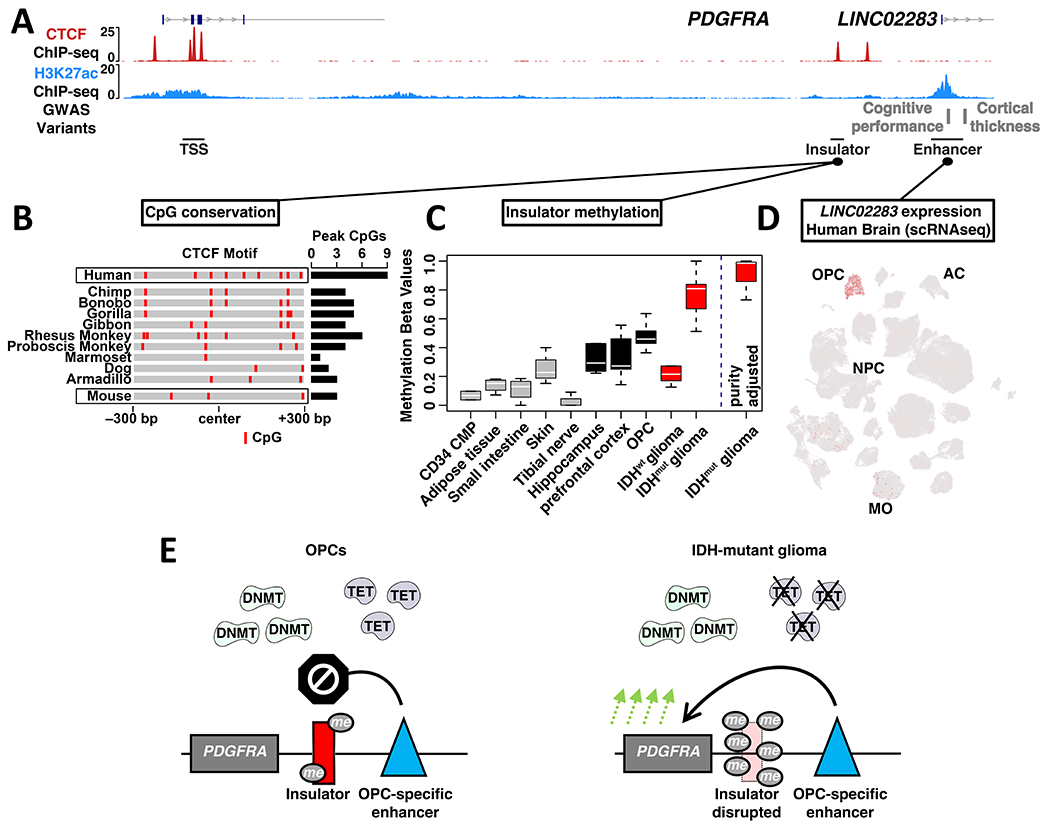
Epigenetic lesions that disrupt regulatory elements represent potential cancer drivers. However, we lack experimental models for validating their tumorigenic impact. Here, we model aberrations arising in isocitrate dehydrogenase-mutant gliomas, which exhibit DNA hypermethylation. We focus on a CTCF insulator near the PDGFRA oncogene that is recurrently disrupted by methylation in these tumors. We demonstrate that disruption of the syntenic insulator in mouse oligodendrocyte progenitor cells (OPCs) allows an OPC-specific enhancer to contact and induce Pdgfra, thereby increasing proliferation. We show that a second lesion, methylation-dependent silencing of the Cdkn2a tumor suppressor, cooperates with insulator loss in OPCs. Coordinate inactivation of the Pdgfra insulator and Cdkn2a drives gliomagenesis in vivo. Despite locus synteny, the insulator is CpG-rich only in humans, a feature that may confer human glioma risk but complicates mouse modeling. Our study demonstrates the capacity of recurrent epigenetic lesions to drive OPC proliferation in vitro and gliomagenesis in vivo.

Keywords: CDKN2A; DNA methylation; IDH mutation; PDGFRA; cell of origin; chromatin; genome topology; glioma; nuclear architecture; oligodendrocyte progenitor cells.


Conflict of interest statement

Declaration of interests B.E.B. discloses financial interests in Fulcrum Therapeutics, HiFiBio, Arsenal Biosciences, Chroma Medicine, Cell Signaling Technologies, and Design Pharmaceuticals.

Figures

Figure 1.
Figure 1.. Enhancer landscape and topology of the PDGFRA locus in human gliomas and mouse neural/oligodendrocyte progenitors.
Maps of chromosome topology, CTCF insulator and enhancer-associated H3K27ac reveal synteny and conservation of the PDGFRA locus in (A) human and (B) mouse. HiC interaction maps (triangles) show pairwise contact frequencies in human IMR90 (left) and mouse NPCs (right). Chromatin loops are annotated with dashed circles. ChIP-seq tracks show CTCF (red) and H3K27ac (blue) in IDH1wt and IDH1mut human gliomas (A), and mouse NPCs and OPCs (B). Dashed boxes in (A) and (B) are expanded in (C) and (D) respectively. (C) Expanded genomic view shows DNA methylation (top heatmap), CTCF (red, orientation arrows below), and H3K27ac (blue) around the PDGFRA gene in human gliomas. The CTCF insulator disrupted in IDHmut gliomas (red peak in dashed box) corresponds to a boundary that shields PDGFRA from an enhancer (blue peak in dashed box). (D) Expanded genomic view shows the analogous CTCF site and enhancer in mouse progenitors. All ChIP-seq tracks are RPM normalized. These data (together with Figure S1) identify a conserved CTCF site that insulates PDGFRA from an OPC-specific enhancer, but is recurrently lost in IDH1mut gliomas.
Figure 2.
Figure 2.. Insulator disruption in mouse OPCs upregulates PDGFRA and increases proliferation.
(A) Genomic tracks depict Pdgfra gene structure (top), H3K27ac ChIP-seq (blue), CTCF ChIP-seq (red), and contact frequency with the OPC-specific enhancer viewpoint (dashed white line) per 4C-seq. CTCF binding and contact frequency are shown for OPCs expressing Cas9 and non-targeting (Cas9-NT) sgRNA or Cas9 with a sgRNA targeting the Pdgfra insulator (Cas9-Ins). Dashed box highlights the disrupted insulator. (B) Pdgfra RNA expression levels, relative to 18S control, shown for control and insulator-disrupted OPCs and NPCs from three biologically independent replicates (P values (two-sided t-test) < 0.0001 for the OPC comparison). (C) Western blot shows PDGFRA protein expression for control and insulator-disrupted OPCs and NPCs. (D) Growth curves shown for control and insulator-disrupted OPCs and NPCs from three biologically independent replicates (P values (two-sided t-test) <0.0001 for the OPC comparison. (E) The OPC-specific enhancer downstream of Pdgfra contains a high-scoring RFX motif conserved in mouse and human. (F) Genomic view of the Pdgfra locus shows H3K27ac (blue) in OPCs expressing Cas9-NT or Cas9 with a sgRNA targeting the RFX motif in the OPC-specific enhancer (dashed box). (G) Relative Pdgfra expression for OPCs with combined disruption of insulator and RFX motif by two sgRNAs, compared to insulator-only and NT controls from three biologically independent replicates (P values (one-way ANOVA) <0.0001 for insulator deletions versus control). Error bars in panels B, D, G represent standard deviation. These data indicate that CTCF insulator loss allows an RFX-driven, OPC-specific enhancer to aberrantly activate Pdgfra.
Figure 3.
Figure 3.. Modeling CDKN2A promoter silencing.
(A) Heatmap depicts mean methylation over tumor suppressor gene promoters in glioma samples stratified by IDH status. (B) Box plots depict distribution of CDKN2A promoter methylation (left, this study and TCGA) and CDKN2A mRNA expression (right, TCGA, RSEMv2 counts) for gliomas (excluding samples with genetic loss of CDKN2A). (C) Genomic tracks over the human CDKN2A promoter show DNA methylation (top heatmap) and H3K27ac (blue) in representative IDHwt and IDHmut glioma samples. (D) Bubble plots show mean methylation of 11 CpGs in the mouse Cdkn2a promoter in OPCs transfected with the DNMT3A3L epigenome editing construct (3A3L) and promoter targeting sgRNAs, or with control constructs (non-targeting guide RNAs or catalytically-dead DNMT3A3L). (E) Genomic tracks show H3K27ac over the mouse Cdkn2a promoter in OPCs transfected with epigenome editing constructs, as in (D). sgRNA locations shown below tracks (black bars). (F) Plot shows normalized Cdkn2a (p19 exon) expression for OPCs transfected as in (D-E) from three biologically independent replicates (P values (one-way ANOVA) <0.0001 for Cdkn2a methylation versus controls). (G) CDKN2A-p19ARF and TP53 protein expression in OPCs transfected with the DNMT3A3L construct and promoter targeting sgRNAs versus controls. (H) Growth curves for OPCs transfected as in (G). Data is from three biologically independent replicates (two-sided t-test P values <0.0001). Error bars in panels F, H represent standard deviation. These data indicate that expression of DNMT3A3L and sgRNA leads to Cdkn2a promoter methylation, p19ARF silencing, and increased OPC proliferation.
Figure 4.
Figure 4.. Combined Pdgfra insulator disruption and Cdkn2a silencing drives hyperproliferation in vitro and low-grade gliomagenesis in vivo.
CTCF binding profile (A), Pdgfra mRNA expression (three biologically independent replicates, P values (two-sided t-test) <0.0001) (B), and western blot for Cdkn2a/p19ARF (C) confirm Pdgfra insulator disruption, Pdgfra upregulation, and Cdkn2a silencing in OPCs with dual disruption of the Pdgfra insulator and Cdkn2a (Cas9-Ins-Cdkn2a). (D) Growth curves shown for OPCs transfected with constructs targeting the Pdgfra insulator and/or Cdkn2a, or corresponding controls. Data is from three biologically independent replicates (P values (one-way ANOVA) <0.0001 for deletions versus control). (E) Strategy used to disrupt the Pdgfra insulator and/or Cdkn2a in mouse brain. Lentiviral vectors expressing Cas9, sgRNA, and shRNA were injected into the corpus callosum (blue outline), targeting a small area (red) just above the lateral ventricles (black). (F) Fluorescence images (10X) of the corpus callosum of an adult mouse one week post lentiviral injection. GFP (marking Cas9 expression), mRFP (marking sgRNA and shRNA) and Hoechst (nuclei) channels are shown in grayscale. Rightmost image merges GFP (green), mRFP (red) and Hoechst (blue). (G) Left: Schema shows expression construct used to express low-dose PDGFB (IRES dampened), compared to a traditional CMV driven construct. Right: Western blot shows PDGFB expression in 293T cells transfected with traditional or low-dose constructs. (H) Kaplan-Meier survival curve for mice injected with the indicated lentiviral preparations. The number of mice injected is indicated for each arm in the panel legend. (I) Histological images of stained brain sections from mice injected with lentivirus expressing a shRNA targeting Cdkn2a (p19ARF), IRES-PDGFB and Cas9 with either non-targeting sgRNA (NT) or the Pdgfra insulator (Ins) sgRNA. Yellow scale bar: 20 μm. Error bars in panels B, D represent standard deviation. These data show that combined disruption of Cdkn2a and the Pdgfra insulator drives hyperproliferation in vivo and low grade gliomagenesis in the presence of low level PDGFB ligand.
Figure 5.
Figure 5.. Human-specific features of the PDGFRA locus and glioma risk.
(A) ChIP-seq signals for CTCF (NPCs) and H3K27ac (OPCs) are shown for a ~110 kb region encompassing PDGFRA, insulator and OPC-specific enhancer. Genetic variants associated with cognitive performance and cortical thickness that coincide with the enhancer are indicated (GWAS), along with a corresponding non-coding RNA. (B) Heat depicts CpG dinucleotides over the PDGFRA insulator across representative mammalian species. Insulator intervals were defined based on synteny and conservation to the 600 bp CTCF binding peak called from human ChIP-seq data. The total number of CpGs in the 600 bp intervals is indicated for each species at right. (C) Box plot depicts PDGFRA insulator methylation in selected non-brain human cell and tissue types, human brain compartments, OPC-enriched fractions from human brain, and for IDHwt and IDHmut gliomas. Box plot at right depicts insulator methylation in IDHmut gliomas after correction for sample purity. (D) t-SNE plot generated from scRNA-seq of human brain cells in the middle temporal gyrus is annotated for expression of the non-coding RNA that emanates from the enhancer (LINC02283; MO: mature oligodendrocytes; AC: astrocytes; data from Allen brain map). (E) Proposed model contrasts insulator states in normal human OPCs and IDHmut glioma. In OPCs, methyltransferases (DNMT) and demethylases (TET) maintain low to intermediate methylation levels that leave the PDGFRA insulator largely intact. In IDHmut gliomas, inhibition of the demethylases results in hypermethylation and disruption of the insulator, driving aberrant PDGFRA expression and tumorigenesis.

Comment in

References

    1. Baylin SB, and Jones PA (2011). A decade of exploring the cancer epigenome - biological and translational implications. Nat Rev Cancer 11, 726–734. 10.1038/nrc3130. - DOI - PMC - PubMed
    1. Flavahan WA, Gaskell E, and Bernstein BE (2017). Epigenetic plasticity and the hallmarks of cancer. Science 357. 10.1126/science.aa12380. - DOI - PMC - PubMed
    1. Esteller M (2008). Epigenetics in cancer. N Engl J Med 358, 1148–1159. 10.1056/NEJMra072067. - DOI - PubMed
    1. Noushmehr H, Weisenberger DJ, Diefes K, Phillips HS, Pujara K, Berman BP, Pan F, Pelloski CE, Sulman EP, Bhat KP, et al. (2010). Identification of a CpG island methylator phenotype that defines a distinct subgroup of glioma. Cancer Cell 17, 510–522. 10.1016/j.ccr.2010.03.017. - DOI - PMC - PubMed
    1. Cancer Genome Atlas Research Network, Brat DJ, Verhaak RGW, Aldape KD, Yung WKA, Salama SR, Cooper LAD, Rheinbay E, Miller CR, Vitucci M, et al. (2015). Comprehensive, Integrative Genomic Analysis of Diffuse Lower-Grade Gliomas. N Engl J Med 372, 2481–2498. 10.1056/NEJMoa1402121. - DOI - PMC - PubMed

Publication types

Substances