Review
. 2023 Nov 29;44(11):111001.
doi: 10.1088/1361-6579/acead2.

The 2023 wearable photoplethysmography roadmap

Affiliations
Review

The 2023 wearable photoplethysmography roadmap

Peter H Charlton et al. Physiol Meas. .

Abstract

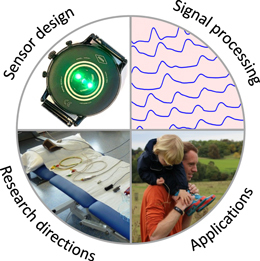
Photoplethysmography is a key sensing technology which is used in wearable devices such as smartwatches and fitness trackers. Currently, photoplethysmography sensors are used to monitor physiological parameters including heart rate and heart rhythm, and to track activities like sleep and exercise. Yet, wearable photoplethysmography has potential to provide much more information on health and wellbeing, which could inform clinical decision making. This Roadmap outlines directions for research and development to realise the full potential of wearable photoplethysmography. Experts discuss key topics within the areas of sensor design, signal processing, clinical applications, and research directions. Their perspectives provide valuable guidance to researchers developing wearable photoplethysmography technology.

Keywords: blood pressure; cardiovascular; fitness; physiological monitoring; sensor; signal processing; smartwatch.


Conflict of interest statement

The authors declare there’s no conflict of interests. The views and opinions expressed are those of the authors and do not reflect those of the Ministry of Food and Drug Safety the in Republic of Korea.

The authors Jing Liu and Ni Zhao have a non-provisional patent (US10542894B2) for the multi-wavelength photoplethysmography-based techniques for cardiovascular monitoring.

Figures

Figure 1.
Figure 1.
The four areas of wearable photoplethysmography covered in this Roadmap. Sources: the ‘sensor design’ panel is adapted from: Marozas and Charlton, ‘Wearable photoplethysmography devices’, Zenodo, 2021, https://doi.org/10.5281/zenodo.4601548 (CC BY 4.0). The ‘Research directions’ panel is adapted from: Charlton, ‘Presentation of: An assessment of algorithms to estimate respiratory rate from the electrocardiogram and photoplethysmogram’, Zenodo, 2016, https://doi.org/10.5281/zenodo.6402455 (CC BY 4.0).
Figure 2.
Figure 2.
Device structure and constituent materials of inorganic and emerging organic PPG sensors. (a) Image of an inorganic PPG sensor and conventional structure of inorganic LEDs and PDs. (b) Schematic of a representative organic PPG sensor and device structure of OLEDs and OPDs along with commonly used materials for various layers (Ir(ppy)3: green light emitting material, B3PyPB: electron-transport/hole blocking material, TCTA: hole-transport and hole-injection material, PEDOT:PSS: hole transport material, PTB7: active layer of OPD, TAPC: hole-transport material, Ir(MDQ)2(acac): orange-red light emitting material, Super Yellow: light emitting material, PIPCP: active layer in near-IR. detector, HATCN: hole-injection material). Sources: (a) is adapted from Kim et al (2017) with permission (Copyright 2016, John Wiley and Sons).
Figure 3.
Figure 3.
Potential aspects and issues addressed through the incorporation of emerging materials in PPG sensors- (a) Ensuring stable operation through the elimination of environment-caused degradation. (b) Addressing motion artifact-related noise in PPG signal. (c) Optimal placement of the sensor. (d) Design of flexible control circuits. (e) Mode of powering such as wireless power transmission or organic battery technology. (d) Design of flexible control circuits. (e) Mode of powering such as wireless power transmission or organic battery technology. (f) Optimization of dimensional parameters such as distance between source and detector. (g) Innovation in geometry to maximize efficiency. (h) Choice of suitable light source considering the extinction properties of blood and organs. Sources: (a) Reproduced from Lee et al (2021a) Copyright 2021, AAAS. (c) Reproduced from Khan et al (2019) (CC BY 4.0); and Kim et al (2017) Copyright 2016, John Wiley and Sons. Khan et al (2019) refers to: Khan et al ‘Organic multi-channel optoelectronic sensors for wearable health monitoring’, IEEE Access, 2019, https://doi.org/10.1109/ACCESS.2019.2939798 (CC BY 4.0). (d) Reproduced from Kim et al (2017) Copyright 2016, John Wiley and Sons. (f) Adapted from Lee et al (2021a) Copyright 2021, AAAS; and Khan et al (2019) (CC BY 4.0).
Figure 4.
Figure 4.
The in-ear PPG sensor with positioning highlighted and sample respiratory modulations shown. (a) A zoom in of the in-ear PPG sensor. (b) The placement of the sensor within the ear canal with arteries supplying the brain highlighted in red. (c) Exemplar in-ear PPG waveforms with 1:3 inspiration to expiration, with the raw in-ear PPG in blue, the conditioned respiratory waveform in red and the reference spirometry flow in grey. Adapted from: Davies et al (2020) and Davies et al (2022).
Figure 5.
Figure 5.
Overview of the adaptive noise cancellation of in-ear PPG with a micro-electrical-mechanical systems (MEMs) microphone used as a noise reference to detect minor motion between the sensor and the skin. Source: Adapted from Davies et al (2020) (CC BY 4.0).
Figure 6.
Figure 6.
Multi-wavelength photoplethysmography (MWPPG) system development workflow.
Figure 7.
Figure 7.
Pulse rate variability analysis from photoplethysmograms. Initially, (a) interbeat intervals (IBIs) are detected from the pulsatile signal, and (b) the duration of the intervals is extracted and plotted against time. These IBIs can be summarised using (c) time-domain features, (d) frequency-domain indices, and (e) nonlinear analyses.
Figure 8.
Figure 8.
Effects of breathing on PPG signals. Source: Adapted from Charlton et al (2016) (CC BY 4.0).
Figure 9.
Figure 9.
An illustration presenting significant differences in the PWD results of synchronized PPG signals from the finger (a) and wrist (b). Here: W1-W3 and T12, T13 are features extracted from decomposed waves W1–W3 (see Kontaxis et al (2021) for more details about the PWD method).
Figure 10.
Figure 10.
Conventional (a) and modern (b) pipelines of PWA.
Figure 11.
Figure 11.
History of the pulse oximeter. The photographs are reproduced with permission from Nihon Koden (Tokyo, Japan), Konika Minolta (Tokyo, Japan), Nonin Medical (Plymouth, USA), Oxitone Medical (Kfar Saba, Israel) and San-ei Medsys. Kyoto, Japan) 2021.
Figure 12.
Figure 12.
Representation of the three main approaches proposed to handle imperfect PPG signals.
Figure 13.
Figure 13.
Integrating signal quality assessment with downstream tasks.
Figure 14.
Figure 14.
(a) Publication and citation trends of motion artifact related studies contained in the ‘Web of Science’ employing all field search terms, ‘photoplethysmography’ AND ‘motion artifact’, for the period 1998–2021. Citations are to source items indexed within the Web of Science. All article types have been included (accessed on 25/5/2022). The light blue bar indicates the moment of explosive growth. (b) Sankey plot for research area and number of publications of original articles for motion artifacts. (c) Histogram of cumulative publications in terms of research area, from 1998 to 2022. (d) Histogram of cumulative publications in terms of methodology, from 1998 to 2022. MA: motion artifact, ICA: independent component analysis.
Figure 15.
Figure 15.
Example of interpretation error occurrence’s process using motion-artifact-induced feature detection error and interpretation error, and signal quality index based approach.
Figure 16.
Figure 16.
Example of the onset of atrial fibrillation demonstrating the variation in the PPG pulse wave amplitudes due to inefficient filling of the ventricles. Single ectopic beats produce similar variations in the PPG signal waveform.
Figure 17.
Figure 17.
An illustrative example of how the occurrence and duration of AF episodes estimated with PPG data can be visualized to clinicians. Subsequential AF burden can be estimated from the data. Blue sections: regular rhythm, red sections: irregular rhythm, grey sections: undetermined rhythm due to inadequate amount of good quality PPG data. Circles represent ECG measurements with results of automatic analysis (also arrhythmias other than AF). Image modified from the week view of the PulseOn Arrhythmia Monitor System.
Figure 18.
Figure 18.
Example of average respiration-heart rate cross spectrum in the time-frequency domain during different sleep states: (a) wake; (b) REM sleep; (c) NREM light sleep; (d) NREM deep sleep. Hotter colors indicate higher cross spectral coherence (inherently normalized between 0 and 1). Adapted from Li et al (2018).
Figure 19.
Figure 19.
Flowchart for continuous oximetry time series analysis. Source: Adapted from: Behar et al ‘Digital oximetry biomarkers for assessing respiratory function: standards of measurement, physiological interpretation, and clinical use’, npj Digital Medicine, 2021, https://doi.org/10.1038/s41746-020-00373-5 (CC BY 4.0).
Figure 20.
Figure 20.
The framework of wearable cuffless blood pressure (BP) or TAG monitoring.
Figure 21.
Figure 21.
A system for unobtrusive 24 h continuous blood pressure (BP) or TAG monitoring, in addition to multiple other physiological parameters (Ding et al 2020).
Figure 22.
Figure 22.
PPG for hospital monitoring. Vital signs include—but are not limited to—heart rate, body temperature, blood pressure, respiratory rate, and oxygen saturation. Applications of PPG-based physiological monitoring include health monitoring in the neonatal and paediatric intensive-care units (Chung et al 2020), non-contact monitoring of patients undergoing haemodialysis (Tarassenko et al 2014), non-contact monitoring of changes in tissue blood perfusion during abdominal surgery (Kamshilin et al 2022), detecting diabetes from smartphone-based vascular signals (Avram et al 2020), real-time monitoring vital signs of COVID-19 patients (Santos et al 2021), deterioration detection of autonomic nervous system dysfunction in infectious patients (Tadesse et al 2020), and others.
Figure 23.
Figure 23.
(A) PPG signal showing the variability of the PPG amplitude (AM) and blood volume (BV, or baseline, which relates to the PPG DC measure) and heart period (HP) (see Nitzan et al (1999)) for further details), and (B) potential clinical application areas that can utilise the low frequency variability in PPG pulse features—there are many opportunities but more research is needed.
Figure 24.
Figure 24.
Wearable PPG VLF sensing concept, looking for changes in the signal variability that could be linked to autonomic dysfunction. From PPG sensing in a wearable for a particular application to signal analysis in the cloud of the signals, and with appropriate intervention—in this case an ambulance is called to attend to a patient who has fallen in their home. Ideally, the sensing and signal analysis should have capability to give an early warning of a fall event.
Figure 25.
Figure 25.
(a) PPG and ECG collection locations. (b) PPG and ECG features for assessing arterial compliance and vascular age. PPG_D is the first derivative of PPG, and PPG_2D is the second derivative of PPG. (1) shows some PWA features. Crest time (CT) is the time delay between PPG valley and peak for calculating the Stiffness index. T1 is the time delay between the PPG peak and the diastolic peak. PW is the pulse width. H1 and H2 are the amplitude for the pulse and diastolic peak. The points a, b, c, d, and e are PPG second derivative features. (2) shows some features (PAT and PTT) between different positions (wrist and finger) of PPG and ECG. PAT_F1 is the time delay between ECG R point and finger PPG Peak. PAT_F2 is the time delay between ECG R point and finger PPG_D Peak. PAT_F3 is the time delay between ECG R point and finger PPG valley. PAT_W1 is the time delay between ECG R point and wrist PPG Peak. PAT_W2 is the time delay between ECG R point and wrist PPG_D Peak. PAT_W3 is the time delay between ECG R point and wrist PPG valley. PTT_WF is the time delay between finger PPG valley and wrist PPG valley.
Figure 26.
Figure 26.
In a healthy subject without PAD, it is expected that there will be bilateral similarity in shape and timing for the great toe pulses, with the typical pulsatile characteristic—as shown for the right foot. In a limb with significant PAD there is usually relative damping and timing delay of the pulse—as shown for the left foot. It is noted that measurements do not necessarily have to be conducted on both legs simultaneously, they could be made on 1 leg at a time—for example for the leg reported to be the most symptomatic. Although PPG is not a perfect test for PAD it has the advantages of speed, low-cost, ease of use, and the potential to improve the accessibility of PAD testing for many people.
Figure 27.
Figure 27.
Use of MATLAB’s (Mathworks Inc) Simulink software to model simple filter approximations in the study of PPG waveform damping at the toe in lower limb PAD. The main Simulink building blocks and their interconnections are shown just as an overview to illustrate the potential of the approach. Here, a pilot of unilateral PAD cases each had a single pole low pass filter time constant (*) varied to give the best fit (by RMS error) of the simulated PPG PAD pulse with the actual PAD leg PPG signal, and the filter time constants compared with a reference standard for PAD such as the ABPI. Such pilot experiments can form a starting point for better understanding the damping and timing of PPG with disease. More detailed studies could include the analysis of ambulatory/wearable PPG signals for PAD diagnostics.
Figure 28.
Figure 28.
Photoplethysmography (PPG) waveform analysis (PWA) for potentially expanding blood pressure (BP) monitoring. Source: Adapted from Mukkamala et al (2022b) (CC BY 4.0).
Figure 29.
Figure 29.
(A) PPG waveform during slowly increasing sensor contact pressure on the finger. (B) Changes in cuff BP and PPG amplitude during MA (mental arithmetic) and CP (cold pressor) tests. (C) Incorrect and correct ways of showing cuffless BP measurement accuracy of PWA with cuff calibration. Because of the cuff calibration, a plot of cuffless BP versus cuff BP pooled over all study participants will largely and trivially reflect the inter-participant differences in the cuff BP levels. A plot of the change in cuffless BP relative to the calibration versus the change in cuff BP relative to the calibration should instead be displayed for a meaningful indication of the BP measurement accuracy. While PWA in this example does not provide any value beyond the cuff BP measurement for calibration, it could in practice. (D) Finger PPG waveform when a tightly applied sensor is at two different vertical heights. Sources: (B) adapted from Natarajan et al (2022); (C) adapted from Mukkamala et al (2021).
Figure 30.
Figure 30.
Common predictive modeling pipeline for wearable data.
Figure 31.
Figure 31.
The number of publications in photoplethysmography and selected highly cited works in this field. A wide range of topics in photoplethysmography have been documented, for example, (a) the assessment of an artificial neural-network for the detection of peripheral vascular-disease from lower-limb pulse wave-forms (Allen and Murray 1995); (b) the correction of physiological motion effects in fMRI (Glover et al 2000); (c) the concept of a biometric security scheme in telemedicine and mobile health (Poon et al 2006); (d) the remote plethysmographic imaging using ambient light (Verkruysse et al 2008); and (e) the large-scale assessment of a smartwatch using consumer PPG-based wearables to identify atrial fibrillation (Perez et al 2019).
Figure 32.
Figure 32.
Typical processing technique and non-optical sensors used in alternatives of photoplethysmography (PPG). (a) The calculation of the second derivation of PPG to derive the acceleration plethysmography or acceleration PPG (Takazawa et al 1998). (b) A piezoresistive sensor for obtaining the impedance PPG (modified from Luo et al (2016)). (c) A series of Hall sensors for capturing the magnetic induction plethysmography (modified from Kim et al (2018)).

References

    1. Ajmal, Boonya-Ananta T, Rodriguez A J, Du Le V N, Ramella-Roman J C. Monte Carlo analysis of optical heart rate sensors in commercial wearables: the effect of skin tone and obesity on the photoplethysmography (PPG) signal. Biomed. Opt. Express. 2021;12:7445–57. doi: 10.1364/BOE.439893. - DOI - PMC - PubMed
    1. Ajtay B E, Béres S, Hejjel L. The oscillating pulse arrival time as a physiological explanation regarding the difference between ECG- and Photoplethysmogram-derived heart rate variability parameters. Biomed. Signal Process. Control. 2023;79:104033. doi: 10.1016/J.BSPC.2022.104033. - DOI
    1. Aliani C, Rossi E, Luchini M, Calamai I, Deodati R, Spina R, Francia P, Lanata A, Bocchi L. Automatic COVID-19 severity assessment from HRV. Sci. Rep. 2023;13:1713. doi: 10.1038/s41598-023-28681-2. - DOI - PMC - PubMed
    1. Allen J. Photoplethysmography and its application in clinical physiological measurement. Physiol. Meas. 2007;28:R1–39. doi: 10.1088/0967-3334/28/3/R01. - DOI - PubMed
    1. Allen J. Photoplethysmography for the assessment of peripheral vascular disease. In: Kyriacou P A, Allen J, editors. Photoplethysmography: Technology, Signal Analysis and Applications. Elsevier; 2021. - DOI

MeSH terms

LinkOut - more resources