

Estimating the attributable fraction of mortality from acute respiratory distress syndrome to inform enrichment in future randomised clinical trials
- PMID: 37495364
- PMCID: PMC10581447
- DOI: 10.1136/thorax-2023-220262
Estimating the attributable fraction of mortality from acute respiratory distress syndrome to inform enrichment in future randomised clinical trials
Abstract
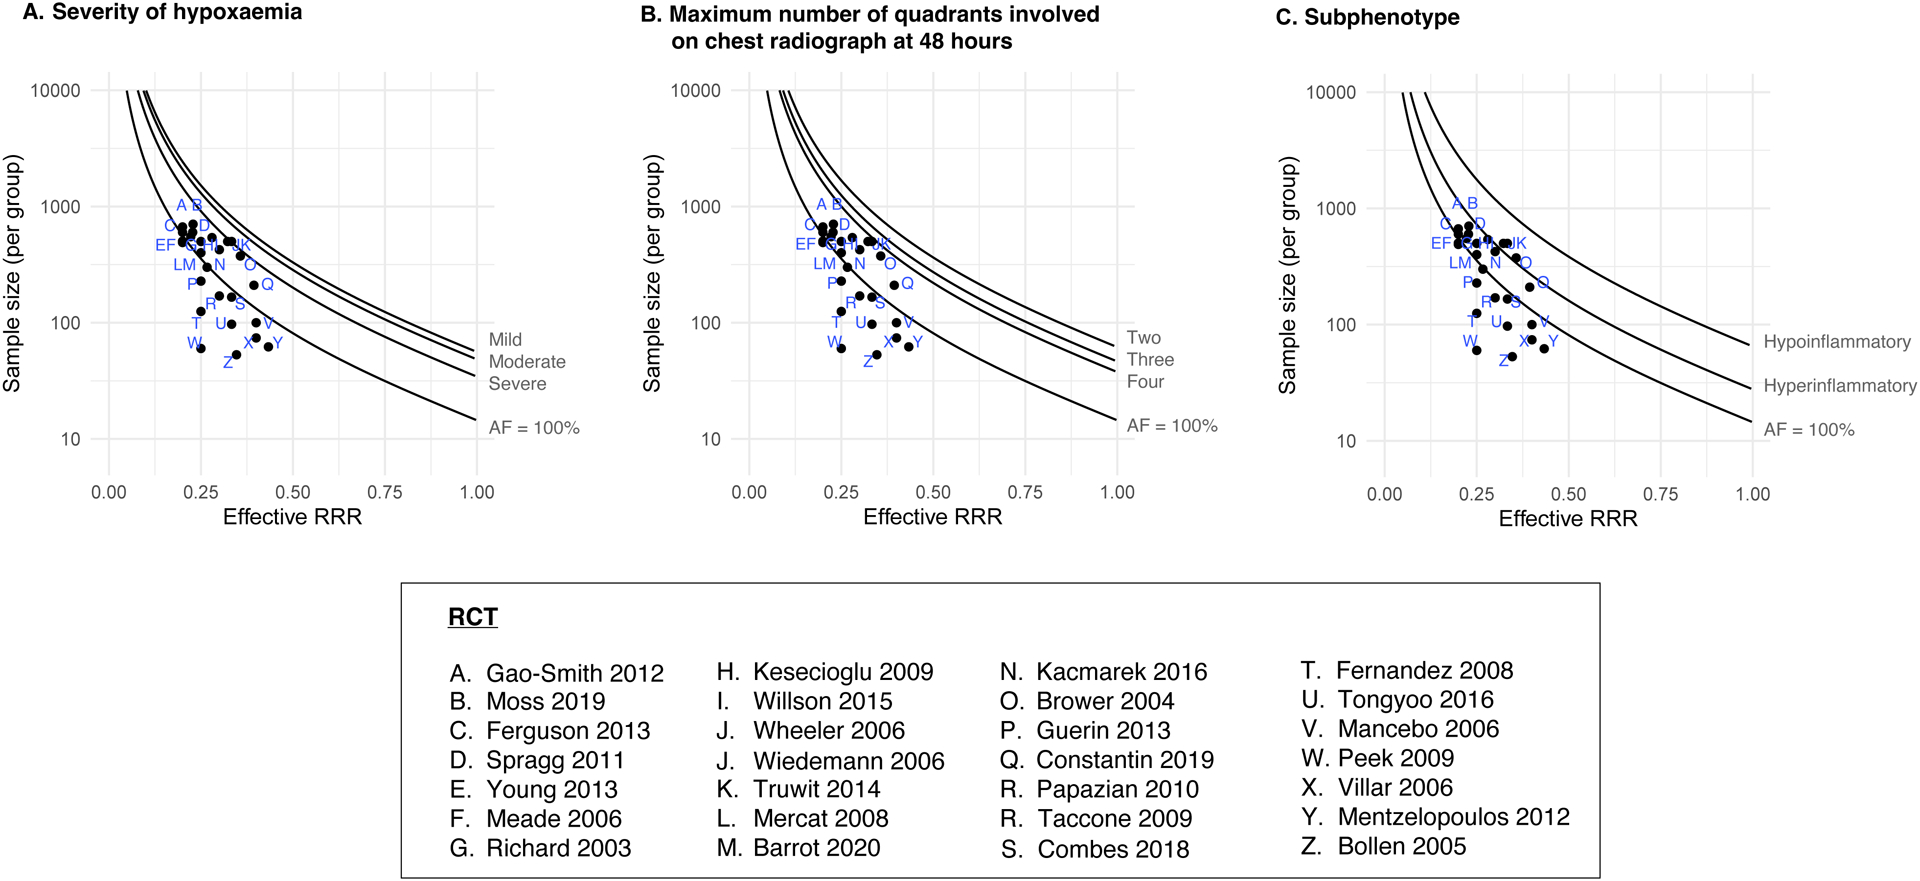
Background: Efficiency of randomised clinical trials of acute respiratory distress syndrome (ARDS) depends on the fraction of deaths attributable to ARDS (AFARDS) to which interventions are targeted. Estimates of AFARDS in subpopulations of ARDS could improve design of ARDS trials.
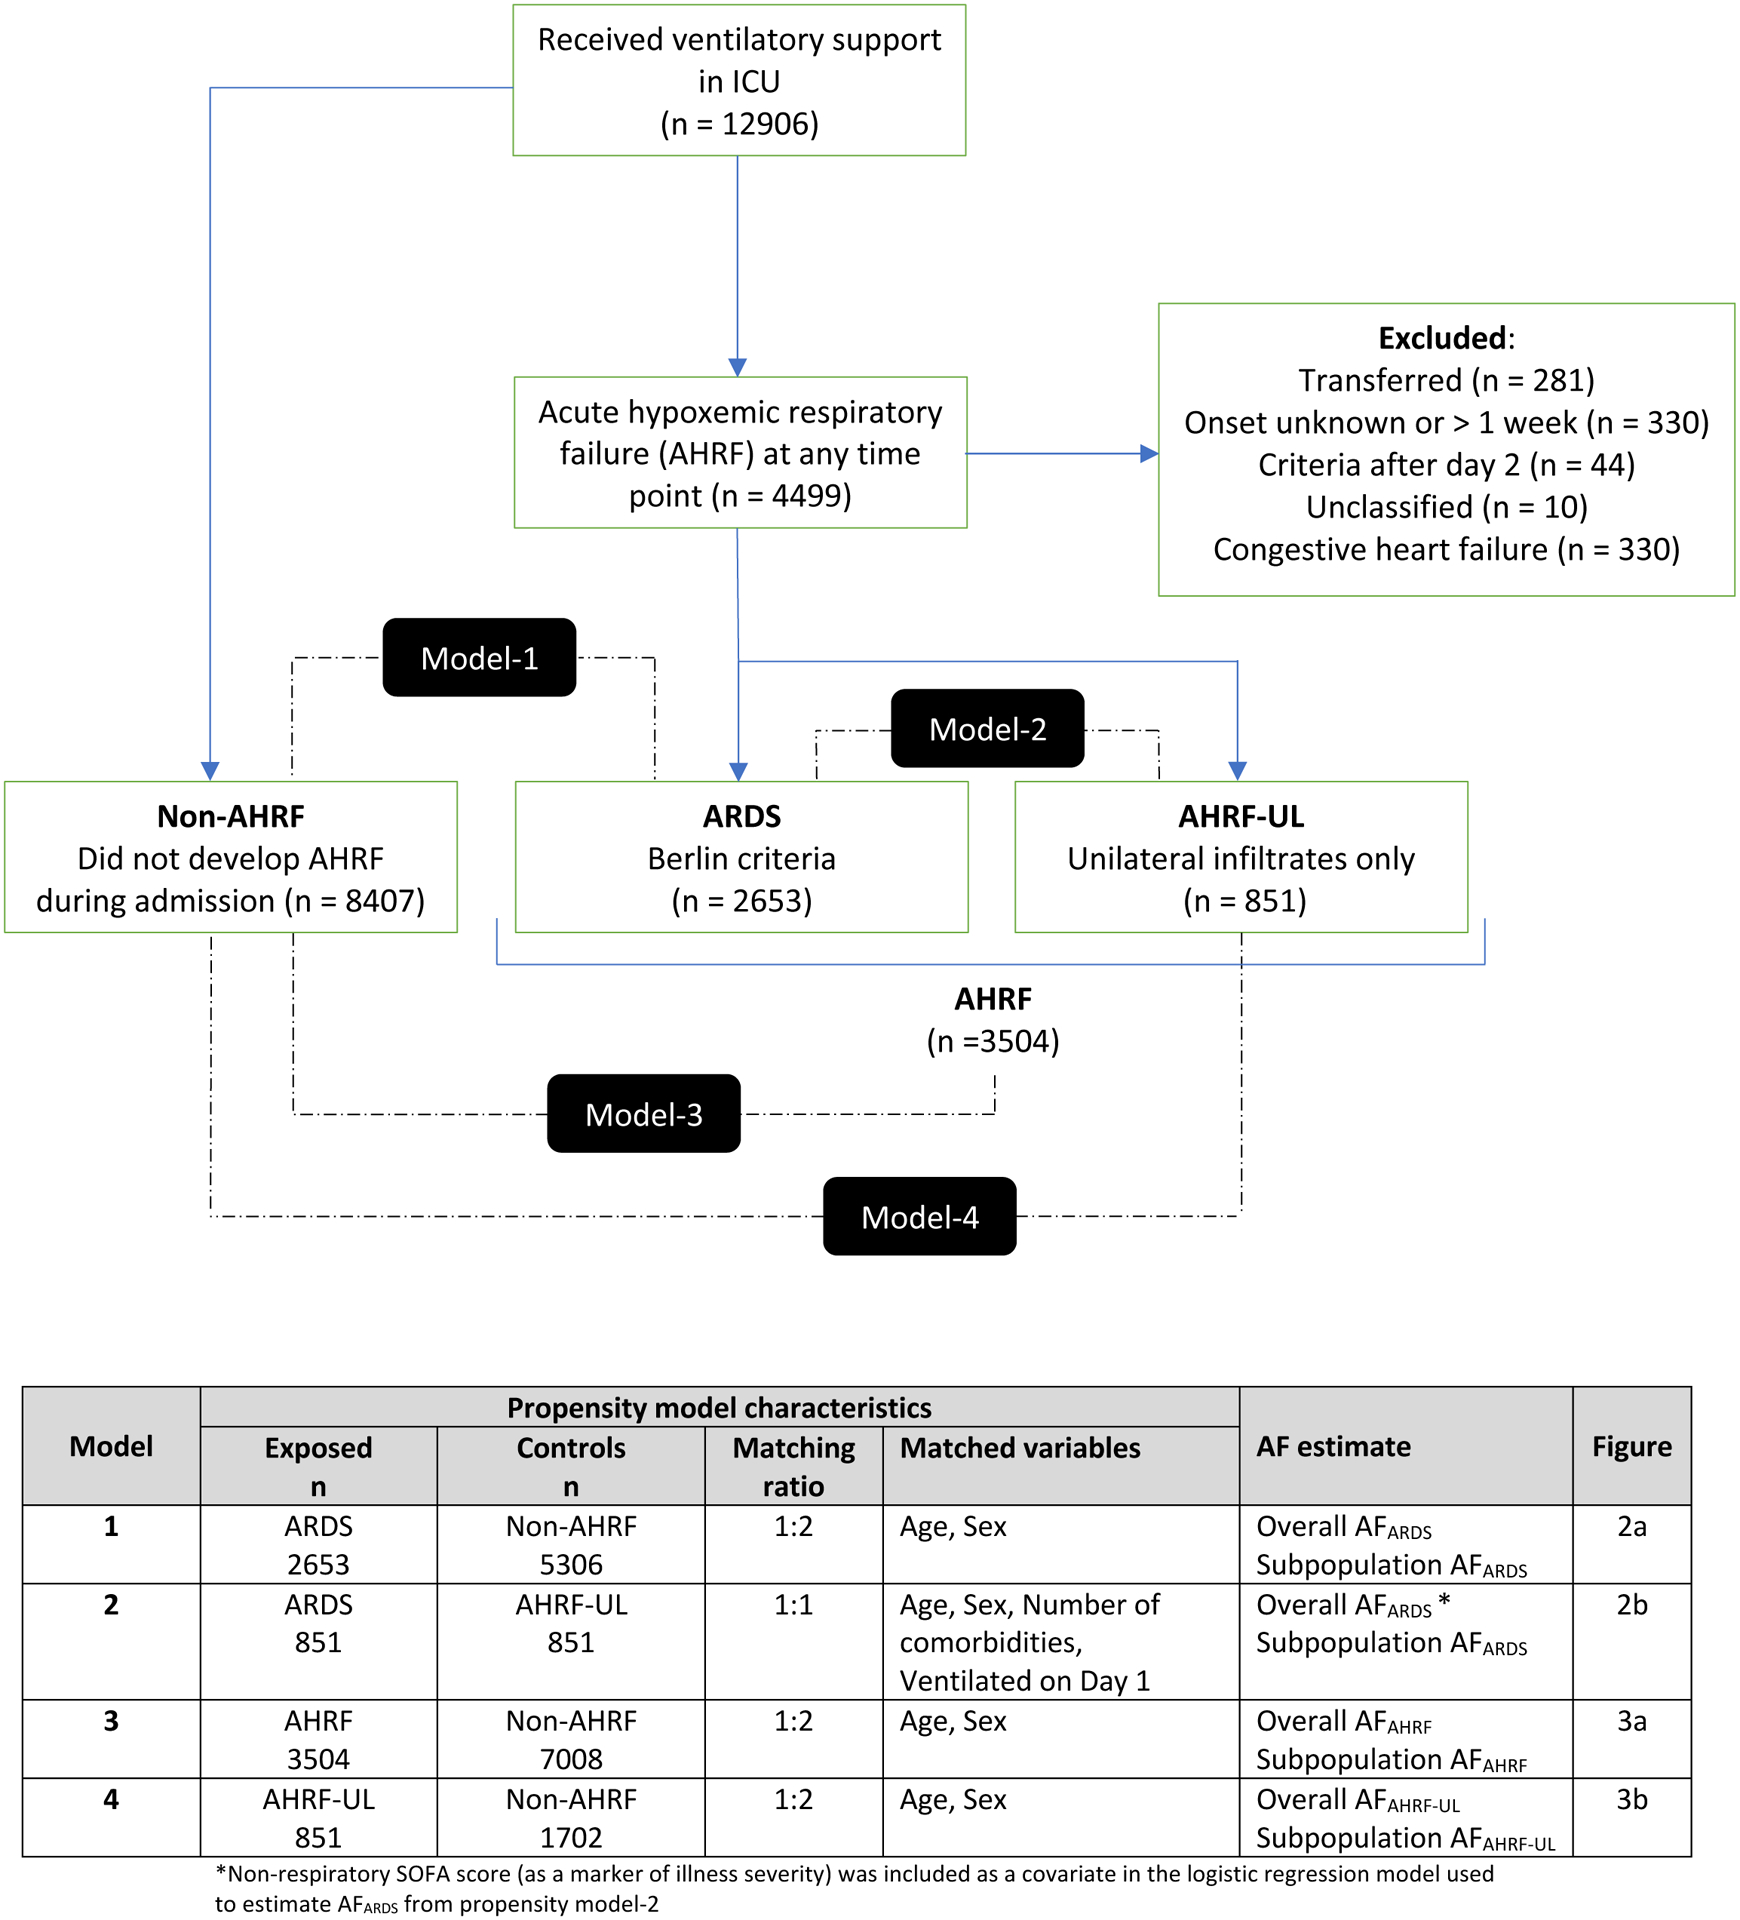
Methods: We performed a matched case-control study using the Large observational study to UNderstand the Global impact of Severe Acute respiratory FailurE cohort. Primary outcome was intensive care unit mortality. We used nearest neighbour propensity score matching without replacement to match ARDS to non-ARDS populations. We derived two separate AFARDS estimates by matching patients with ARDS to patients with non-acute hypoxaemic respiratory failure (non-AHRF) and to patients with AHRF with unilateral infiltrates only (AHRF-UL). We also estimated AFARDS in subgroups based on severity of hypoxaemia, number of lung quadrants involved and hyperinflammatory versus hypoinflammatory phenotypes. Additionally, we derived AFAHRF estimates by matching patients with AHRF to non-AHRF controls, and AFAHRF-UL estimates by matching patients with AHRF-UL to non-AHRF controls.
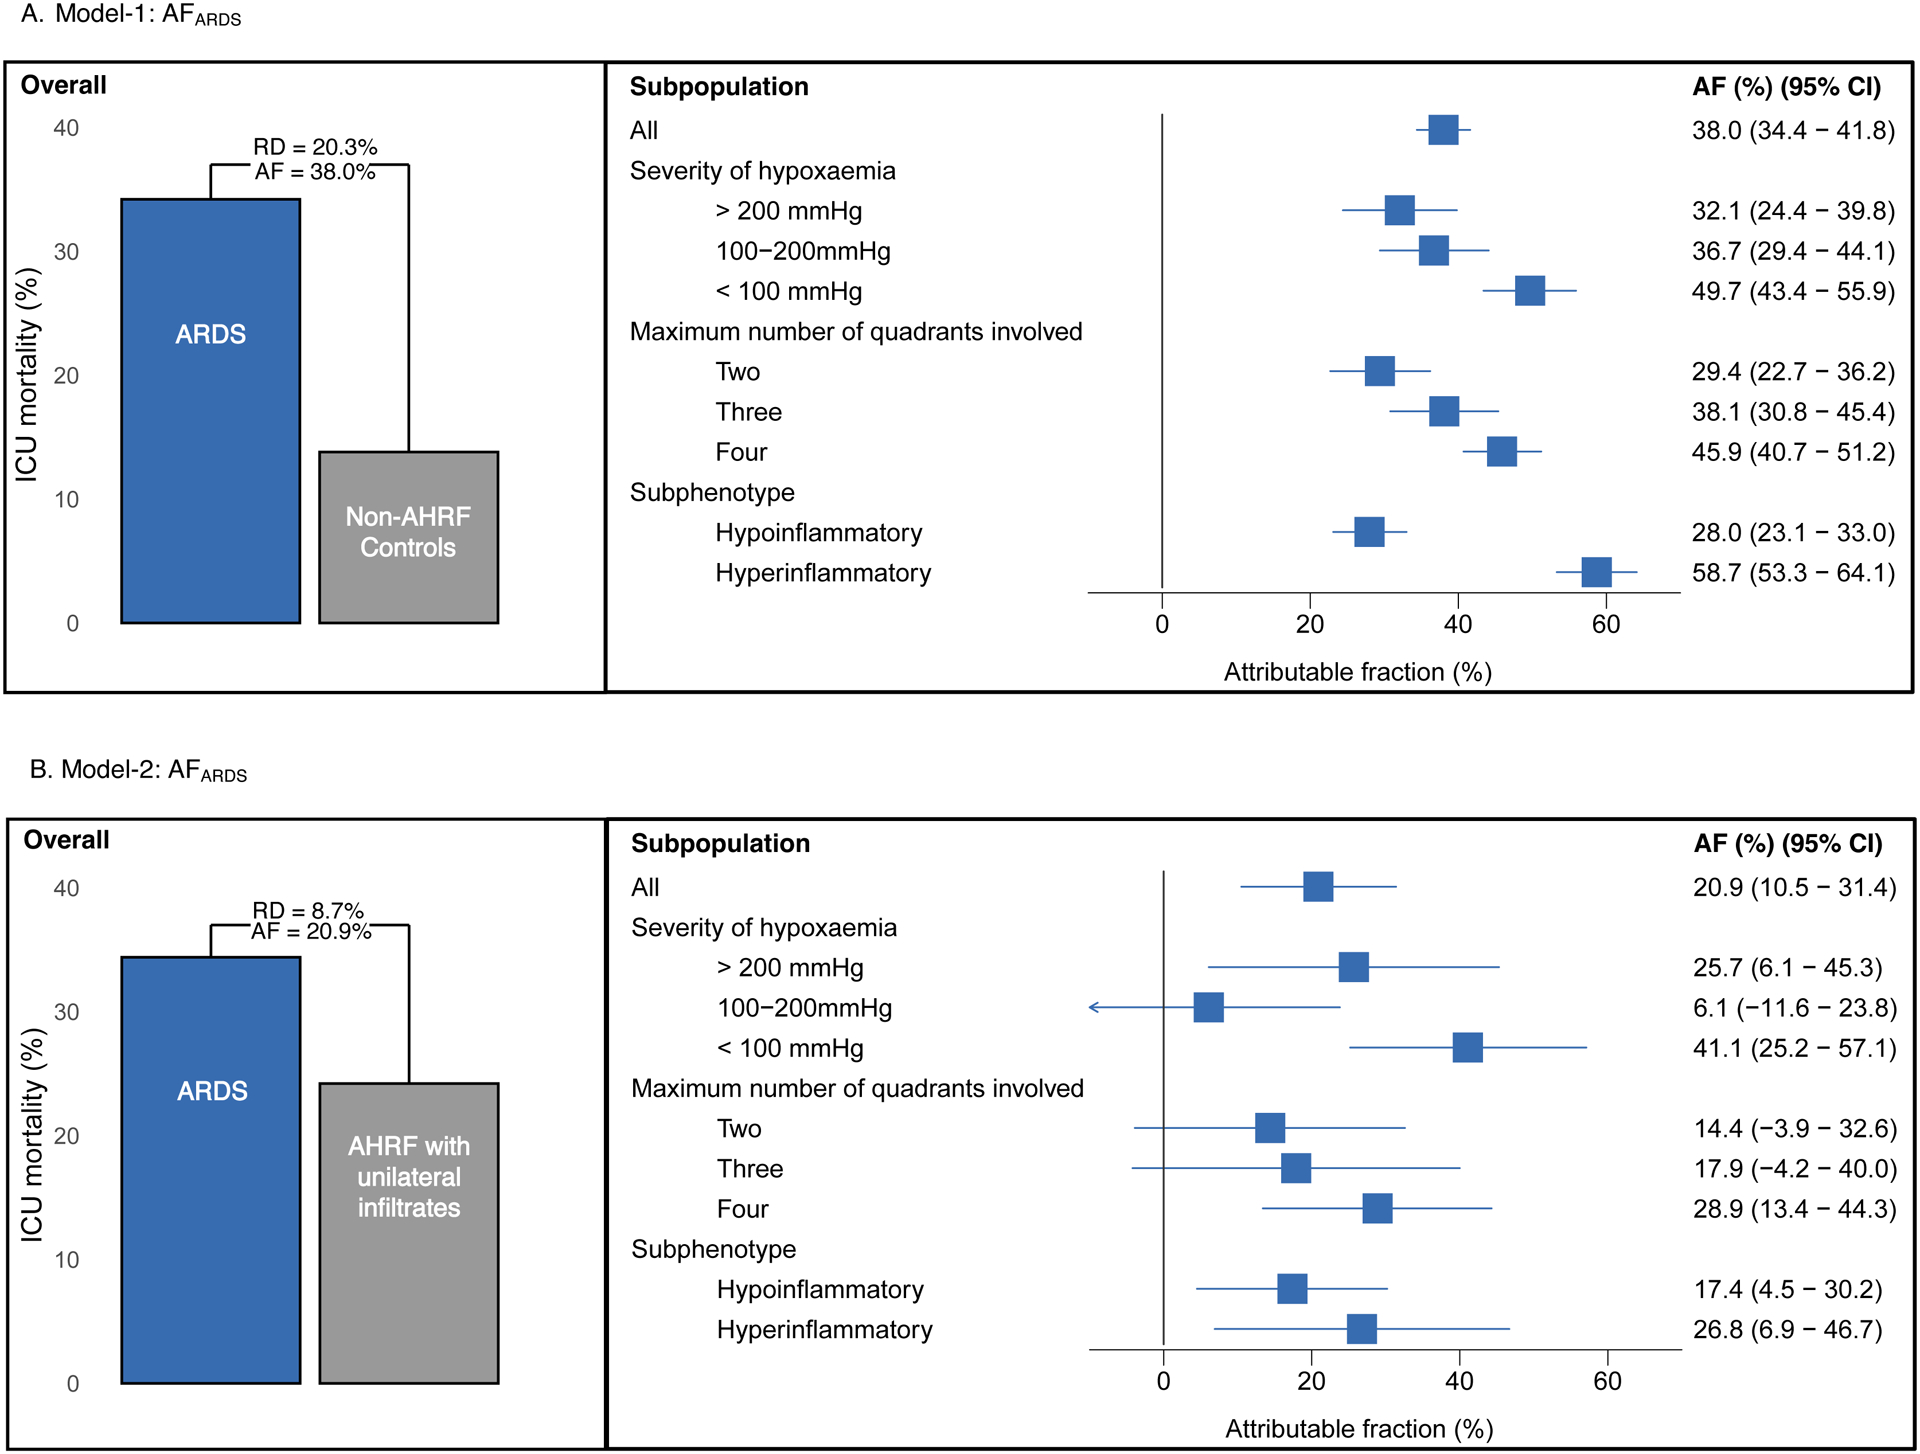
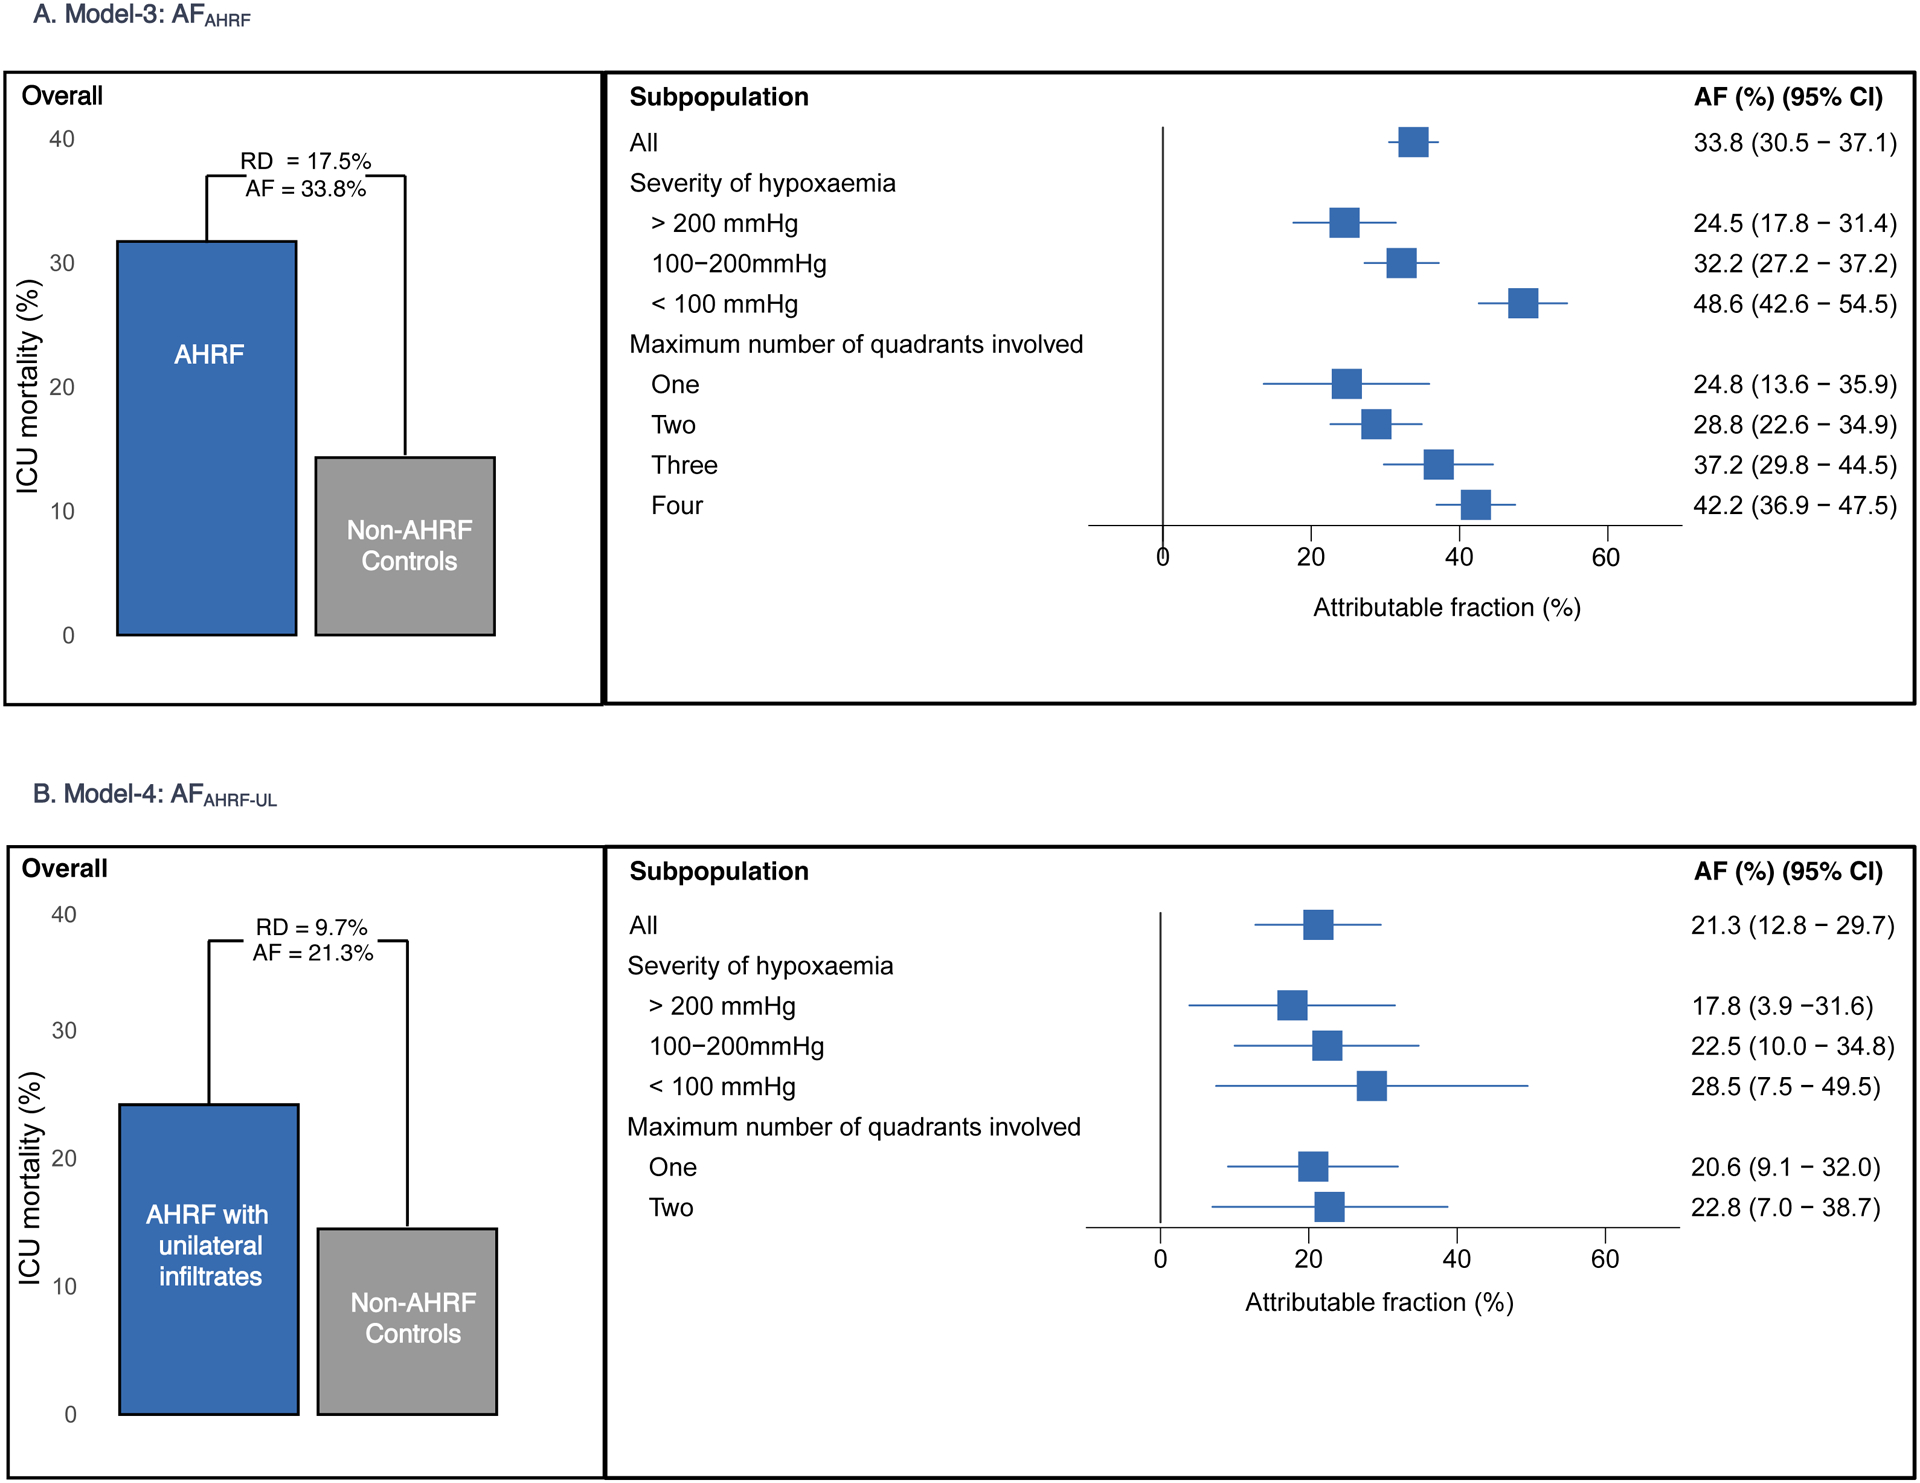
Results: Estimated AFARDS was 20.9% (95% CI 10.5% to 31.4%) when compared with AHRF-UL controls and 38.0% (95% CI 34.4% to 41.6%) compared with non-AHRF controls. Within subgroups, estimates for AFARDS compared with AHRF-UL controls were highest in patients with severe hypoxaemia (41.1% (95% CI 25.2% to 57.1%)), in those with four quadrant involvement on chest radiography (28.9% (95% CI 13.4% to 44.3%)) and in the hyperinflammatory subphenotype (26.8% (95% CI 6.9% to 46.7%)). Estimated AFAHRF was 33.8% (95% CI 30.5% to 37.1%) compared with non-AHRF controls. Estimated AFAHRF-UL was 21.3% (95% CI 312.8% to 29.7%) compared with non-AHRF controls.
Conclusions: Overall AFARDS mean values were between 20.9% and 38.0%, with higher AFARDS seen with severe hypoxaemia, four quadrant involvement on chest radiography and hyperinflammatory ARDS.
Keywords: ARDS; clinical epidemiology.
© Author(s) (or their employer(s)) 2023. No commercial re-use. See rights and permissions. Published by BMJ.
Conflict of interest statement
Competing interests: CS is funded by UKRI (MR/S035753/1 and MR/X005070/1) and the National Institute for Health and Care Research (NIHR133788). Work in her research group is supported by GlaxoSmithKline, the Wellcome Trust and the Cambridge NIHR Biomedical Research Centre, and she has received consultancy fees from AbbVie, Sanofi and GlaxoSmithKline. CSC is funded by National Institutes of Health R35-HL140026 and reports grant funding from Roche-Genentech and Quantum Leap Healthcare collaborative, in addition to the National Institutes of Health, and consulting fees from Vasomune, Gen1e Life Sciences, Cellenkos and Janssen. EF reports personal fees from ALung Technologies, Aerogen, Baxter, GE Healthcare, Inspira and Vasomune outside the submitted work. JGL is funded by a Future Research Leaders Award (16-FRL-3845) from Science Foundation Ireland and reports receiving consulting fees from Baxter and from GlaxoSmithKline. RS reports no conflicts. MS-H is funded by a clinician scientist fellowship from the National Institute for Health Research (CS-2016-16-011) and reports receiving grants from the NIHR, MRC, EME, HTA, Huo Foundation and highlights industry support for TRAITS research programme (a Chief Scientists Office, Scotland funded time critical precision medicine in adult critically ill patients (TRAITS Programme)).
Figures
Comment in
-
Can we design better ARDS trials?Thorax. 2023 Oct;78(10):955-956. doi: 10.1136/thorax-2023-220446. Epub 2023 Jul 26. Thorax. 2023. PMID: 37495366 No abstract available.
References
-
- Force ADT, Ranieri VM, Rubenfeld GD, Thompson BT, Ferguson ND, Caldwell E, Fan E, Camporota L, Slutsky AS: Acute respiratory distress syndrome: the Berlin Definition. JAMA 2012, 307(23):2526–2533. - PubMed
-
- Sackett DL: Superiority trials, non-inferiority trials, and prisoners of the 2-sided null hypothesis. Evid Based Med 2004, 9(2):38–39.
-
- Shankar-Hari M, Santhakumaran S, Prevost AT, Ward JK, Marshall T, Bradley C, Calfee CS, Delucchi KL, Sinha P, Matthay MA et al.: Defining phenotypes and treatment effect heterogeneity to inform acute respiratory distress syndrome and sepsis trials: secondary analyses of three RCTs. 2021, 8:10. - PubMed
Publication types
MeSH terms
Grants and funding
LinkOut - more resources
Full Text Sources
Medical