

Excess mortality associated with the COVID-19 pandemic during the 2020 and 2021 waves in Antananarivo, Madagascar
- PMID: 37495370
- PMCID: PMC10373673
- DOI: 10.1136/bmjgh-2023-011801
Excess mortality associated with the COVID-19 pandemic during the 2020 and 2021 waves in Antananarivo, Madagascar
Abstract
Introduction: COVID-19-associated mortality remains difficult to estimate in sub-Saharan Africa because of the lack of comprehensive systems of death registration. Based on death registers referring to the capital city of Madagascar, we sought to estimate the excess mortality during the COVID-19 pandemic and calculate the loss of life expectancy.
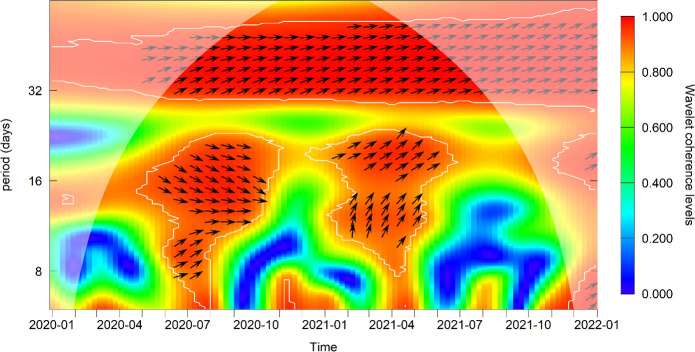
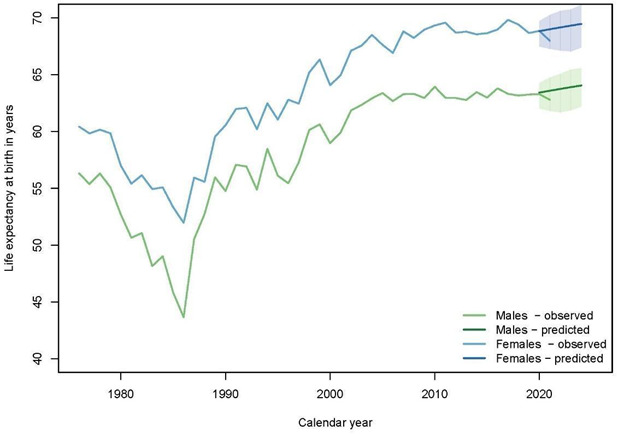
Methods: Death records between 2016 and 2021 were used to estimate weekly excess mortality during the pandemic period. To infer its synchrony with circulation of SARS-CoV-2, a cross-wavelet analysis was performed. Life expectancy loss due to the COVID-19 pandemic was calculated by projecting mortality rates using the Lee and Carter model and extrapolating the prepandemic trends (1990-2019). Differences in life expectancy at birth were disaggregated by cause of death.
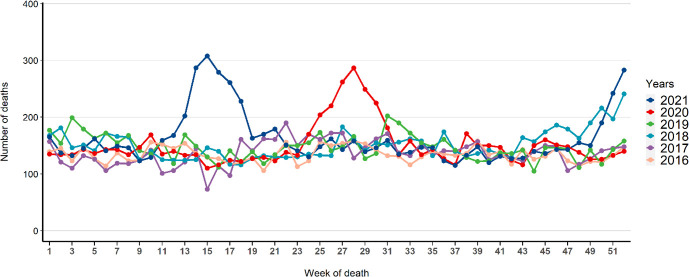
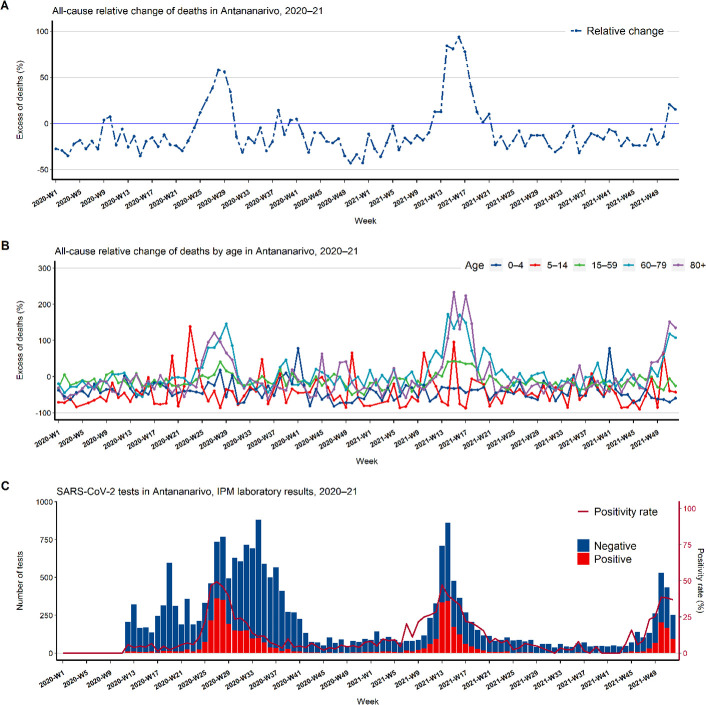
Results: Peaks of excess mortality in 2020-21 were associated with waves of COVID-19. Estimates of all-cause excess mortality were 38.5 and 64.9 per 100 000 inhabitants in 2020 and 2021, respectively, with excess mortality reaching ≥50% over 6 weeks. In 2021, we quantified a drop of 0.8 and 1.0 years in the life expectancy for men and women, respectively attributable to increased risks of death beyond the age of 60 years.
Conclusion: We observed high excess mortality during the pandemic period, in particular around the peaks of SARS-CoV-2 circulation in Antananarivo. Our study highlights the need to implement death registration systems in low-income countries to document true toll of a pandemic.
Keywords: COVID-19; epidemiology; public health; respiratory infections.
© Author(s) (or their employer(s)) 2023. Re-use permitted under CC BY. Published by BMJ.
Conflict of interest statement
Competing interests: None declared.
Figures
Similar articles
-
Excess mortality during the COVID-19 pandemic in low-and lower-middle-income countries: a systematic review and meta-analysis.BMC Public Health. 2024 Jun 20;24(1):1643. doi: 10.1186/s12889-024-19154-w. BMC Public Health. 2024. PMID: 38902661 Free PMC article.
-
Disentangling the relationship between cancer mortality and COVID-19 in the US.Elife. 2024 Aug 27;13:RP93758. doi: 10.7554/eLife.93758. Elife. 2024. PMID: 39190600 Free PMC article.
-
The epidemiological transition in Antananarivo, Madagascar: an assessment based on death registers (1900-2012).Glob Health Action. 2014 May 15;7:23237. doi: 10.3402/gha.v7.23237. eCollection 2014. Glob Health Action. 2014. PMID: 24848650 Free PMC article.
-
Monitoring for outbreak-associated excess mortality in an African city: Detection limits in Antananarivo, Madagascar.Int J Infect Dis. 2021 Feb;103:338-342. doi: 10.1016/j.ijid.2020.11.182. Epub 2020 Nov 26. Int J Infect Dis. 2021. PMID: 33249289
-
Things must not fall apart: the ripple effects of the COVID-19 pandemic on children in sub-Saharan Africa.Pediatr Res. 2021 Apr;89(5):1078-1086. doi: 10.1038/s41390-020-01174-y. Epub 2020 Sep 24. Pediatr Res. 2021. PMID: 32971527 Free PMC article. Review.
Cited by
-
High SARS-CoV-2 seroincidence but low excess COVID mortality in Sierra Leone in 2020-2022.PLOS Glob Public Health. 2024 Sep 10;4(9):e0003411. doi: 10.1371/journal.pgph.0003411. eCollection 2024. PLOS Glob Public Health. 2024. PMID: 39255307 Free PMC article.
-
The Re-Emergence of Rift Valley Fever in Mananjary District, Madagascar in 2021: A Call for Action.Pathogens. 2024 Mar 16;13(3):257. doi: 10.3390/pathogens13030257. Pathogens. 2024. PMID: 38535600 Free PMC article.
-
Identifying climatic drivers of respiratory syncytial virus (RSV) seasonality in Antananarivo, Madagascar, 2011-2021: a sentinel surveillance study.BMJ Public Health. 2024 Sep 23;2(2):e001093. doi: 10.1136/bmjph-2024-001093. eCollection 2024 Dec. BMJ Public Health. 2024. PMID: 40018634 Free PMC article.
-
Excess mortality during the COVID-19 pandemic in low-and lower-middle-income countries: a systematic review and meta-analysis.BMC Public Health. 2024 Jun 20;24(1):1643. doi: 10.1186/s12889-024-19154-w. BMC Public Health. 2024. PMID: 38902661 Free PMC article.
References
-
- Sharrow D, Hug L, You D, et al. . Global, regional, and national trends in Under-5 mortality between 1990 and 2019 with scenario-based projections until 2030: a systematic analysis by the UN inter-agency group for child mortality estimation. Lancet Glob Health 2022;10:e195–206. 10.1016/S2214-109X(21)00515-5 - DOI - PMC - PubMed
-
- Lang E, Saint-Firmin P, Olivett M, et al. . Analyse Du Système de Financement de la Santé À Madagascar pour Guider de futures Réfotrmes, Notamment La CSU. Washington, DC. 2018.
Publication types
MeSH terms
Grants and funding
LinkOut - more resources
Full Text Sources
Medical
Miscellaneous