

WHO Global Situational Alert System: a mixed methods multistage approach to identify country-level COVID-19 alerts
- PMID: 37495371
- PMCID: PMC10373705
- DOI: 10.1136/bmjgh-2023-012241
WHO Global Situational Alert System: a mixed methods multistage approach to identify country-level COVID-19 alerts
Abstract
Background: Globally, since 1 January 2020 and as of 24 January 2023, there have been over 664 million cases of COVID-19 and over 6.7 million deaths reported to WHO. WHO developed an evidence-based alert system, assessing public health risk on a weekly basis in 237 countries, territories and areas from May 2021 to June 2022. This aimed to facilitate the early identification of situations where healthcare capacity may become overstretched.
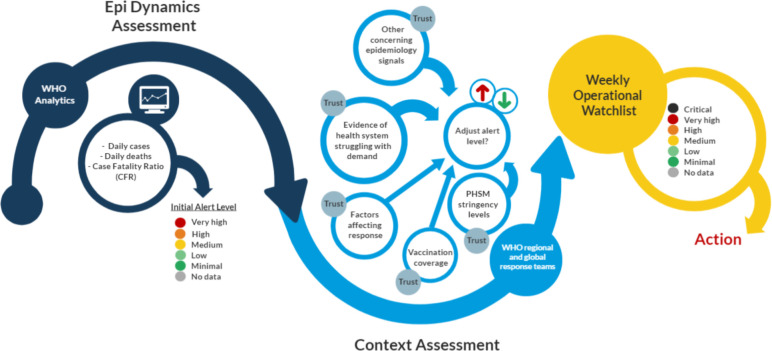
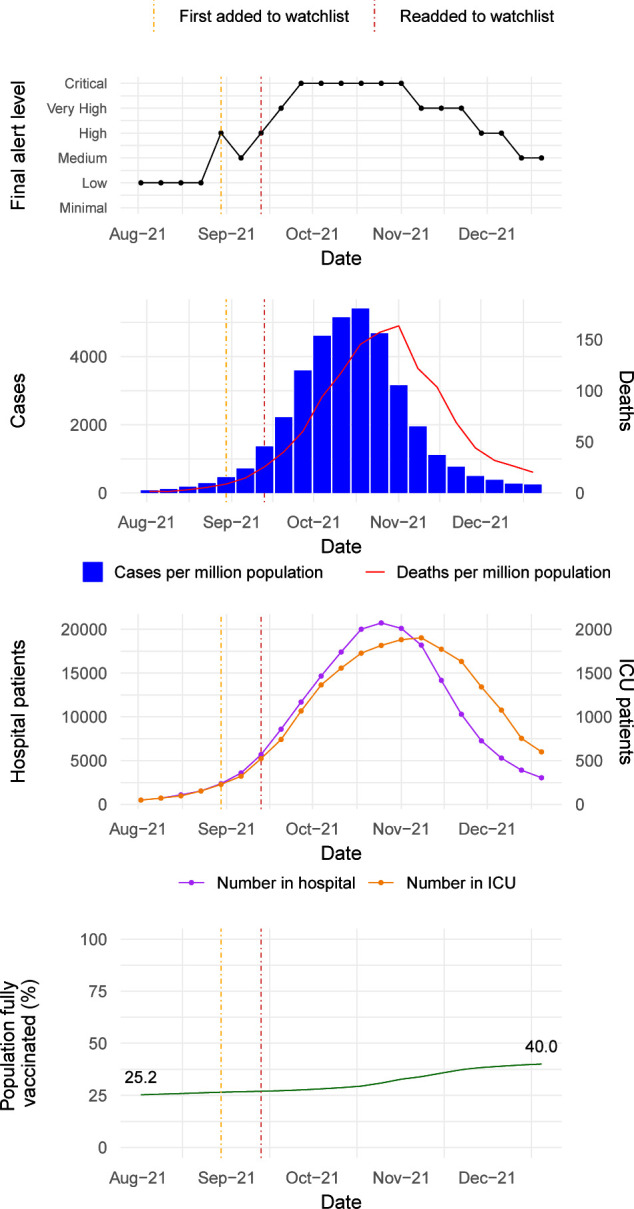
Methods: The process involved a three-stage mixed methods approach. In the first stage, future deaths were predicted from the time series of reported cases and deaths to produce an initial alert level. In the second stage, this alert level was adjusted by incorporating a range of contextual indicators and accounting for the quality of information available using a Bayes classifier. In the third stage, countries with an alert level of 'High' or above were added to an operational watchlist and assistance was deployed as needed.
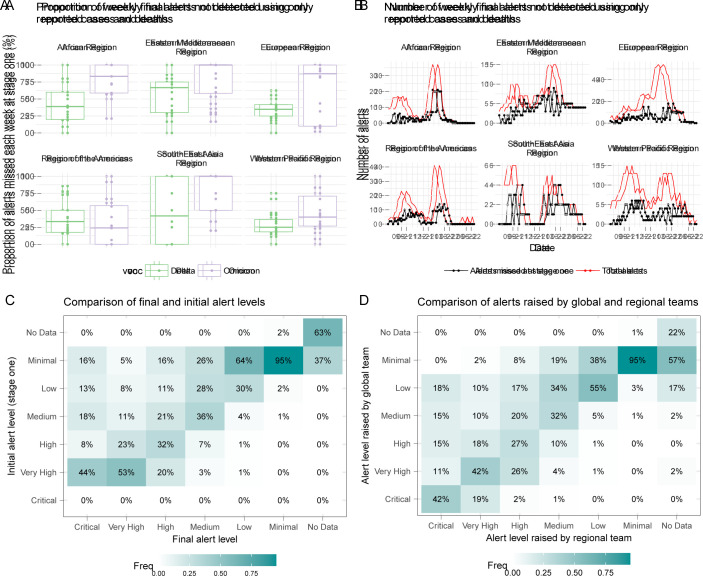
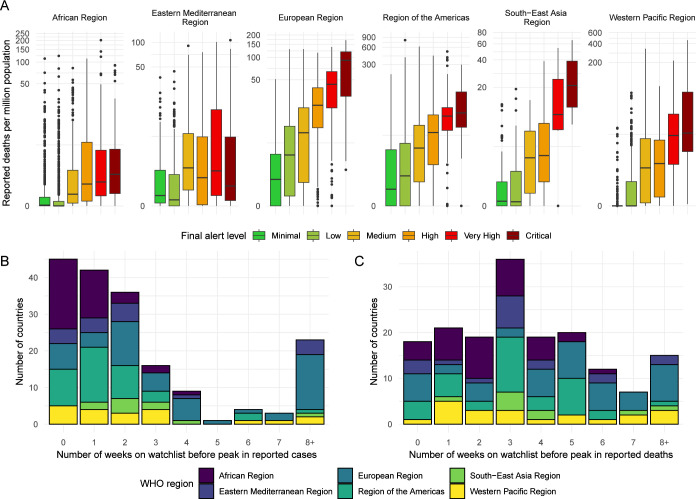
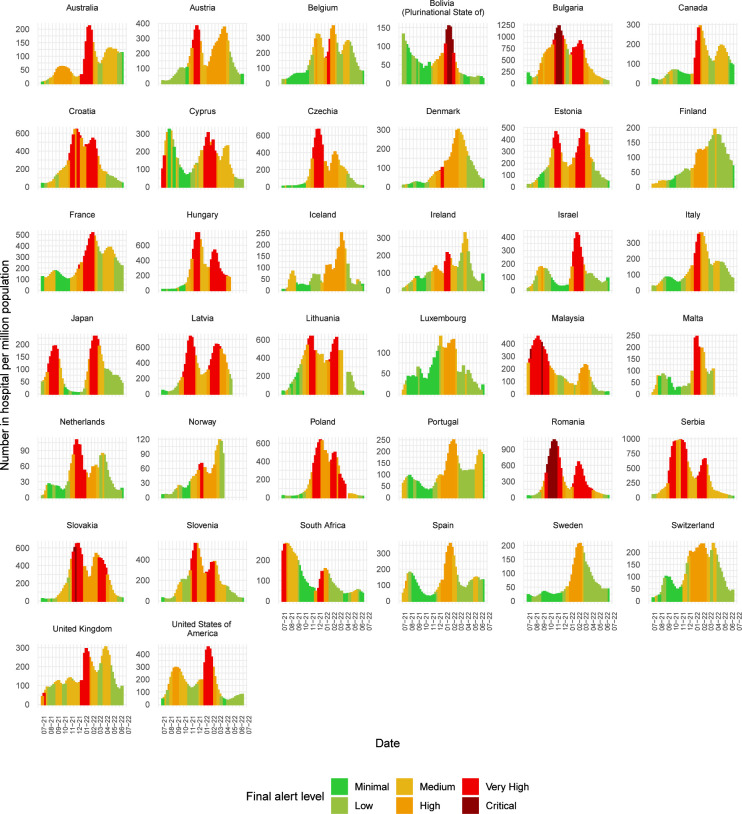
Results: Since June 2021, the system has supported the release of more than US$27 million from WHO emergency funding, over 450 000 rapid antigen diagnostic testing kits and over 6000 oxygen concentrators. Retrospective evaluation indicated that the first two stages were needed to maximise sensitivity, where 44% (IQR 29%-67%) of weekly watchlist alerts would not have been identified using only reported cases and deaths. The alerts were timely and valid in most cases; however, this could only be assessed on a non-representative sample of countries with hospitalisation data available.
Conclusions: The system provided a standardised approach to monitor the pandemic at the country level by incorporating all available data on epidemiological analytics and contextual assessments. While this system was developed for COVID-19, a similar system could be used for future outbreaks and emergencies, with necessary adjustments to parameters and indicators.
Keywords: COVID-19; Epidemiology; Public Health.
© World Health Organization 2023. Licensee BMJ.
Conflict of interest statement
Competing interests: None declared.
Figures
References
-
- World Health Organisation . WHO COVID-19 data sources. WHO Coronavirus COVID-19 dashboard. Available: https://covid19.who.int/data [Accessed 07 Jul 2022].
-
- World Health Organisation . Health workforce Department. The impact of COVID-19 on health and care workers: a closer look at deaths. 2021. Available: https://apps.who.int/iris/bitstream/handle/10665/345300/WHO-HWF-WorkingP... [Accessed 08 Jul 2022].
-
- United Nations Department of Global Communications . Supply chain and COVID-19: UN rushes to move vital equipment to frontlines. 2020. Available: https://www.un.org/en/coronavirus/supply-chain-and-covid-19-un-rushes-mo... [Accessed 08 Jul 2022].
-
- The World Bank . World Bank country and lending groups. Available: https://datahelpdesk.worldbank.org/knowledgebase/articles/906519-world-b... [Accessed 08 Jul 2022].
Publication types
MeSH terms
Grants and funding
LinkOut - more resources
Full Text Sources
Medical