. 2023 Jul 26;14(1):4506.
doi: 10.1038/s41467-023-40156-6.

Macrophage and neutrophil heterogeneity at single-cell spatial resolution in human inflammatory bowel disease

Affiliations

Macrophage and neutrophil heterogeneity at single-cell spatial resolution in human inflammatory bowel disease

Alba Garrido-Trigo et al. Nat Commun. .

Erratum in

Abstract

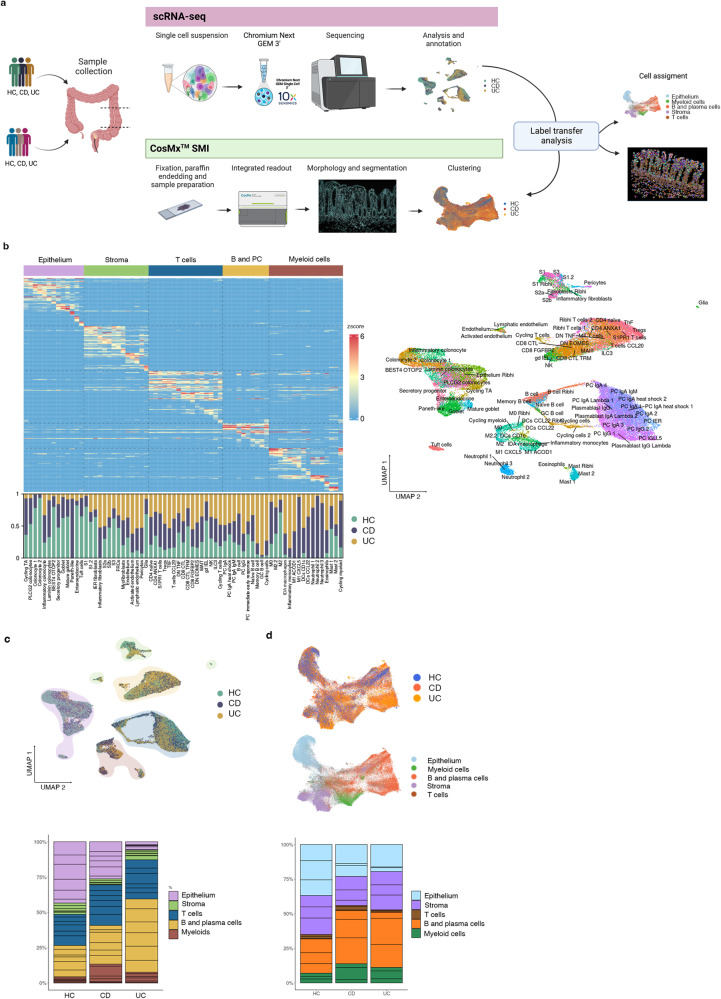
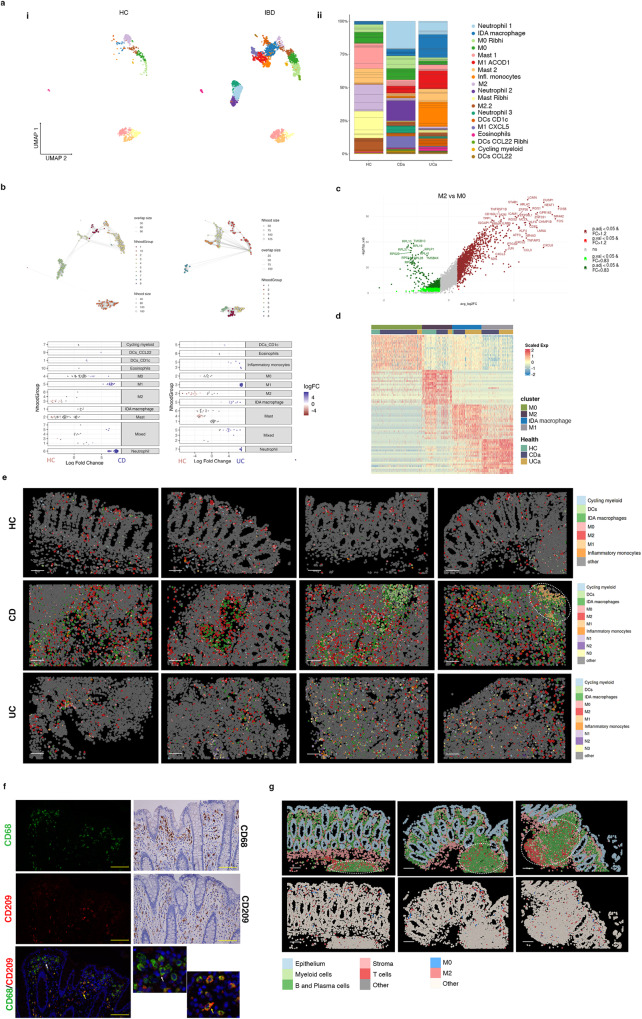
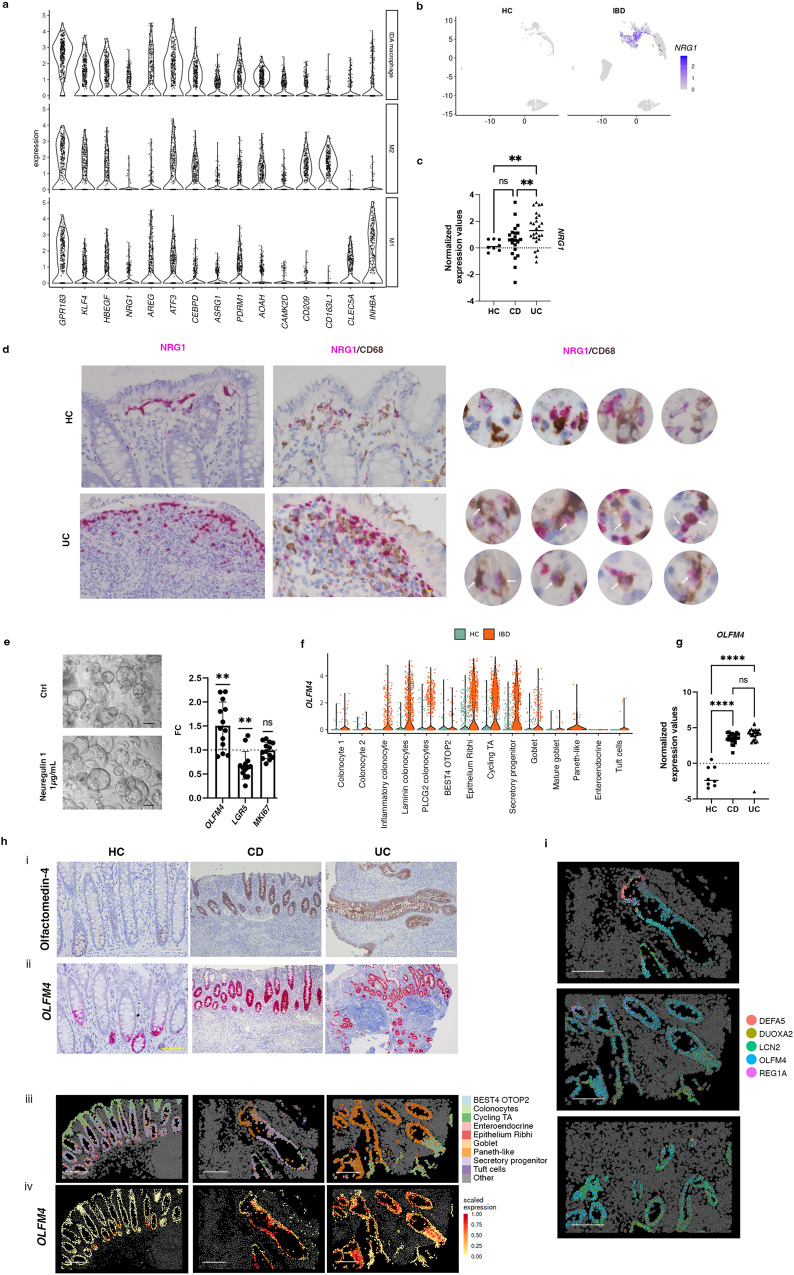
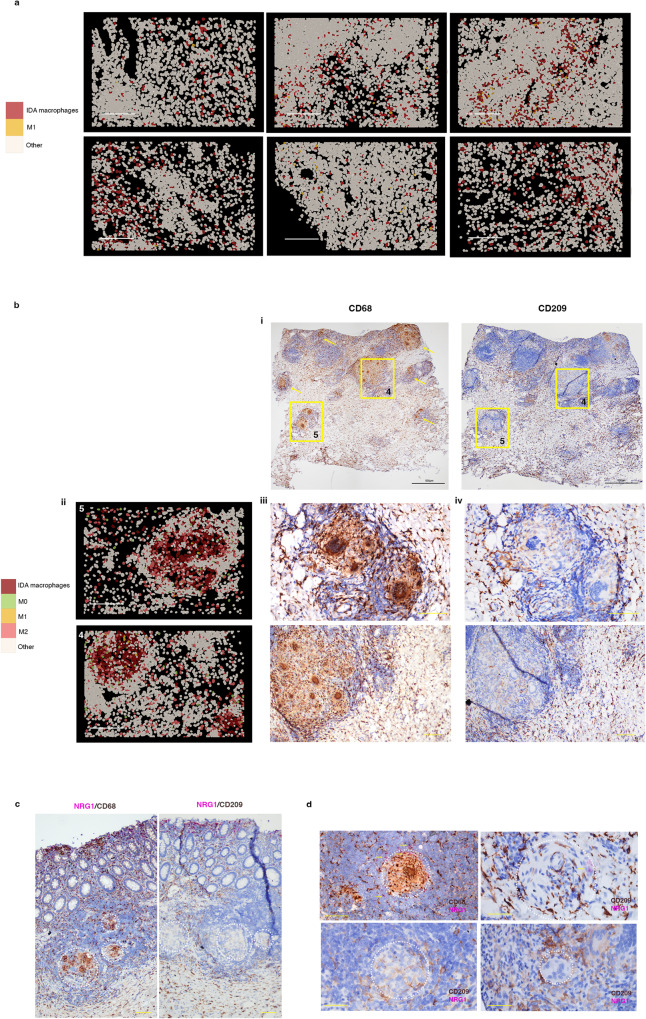
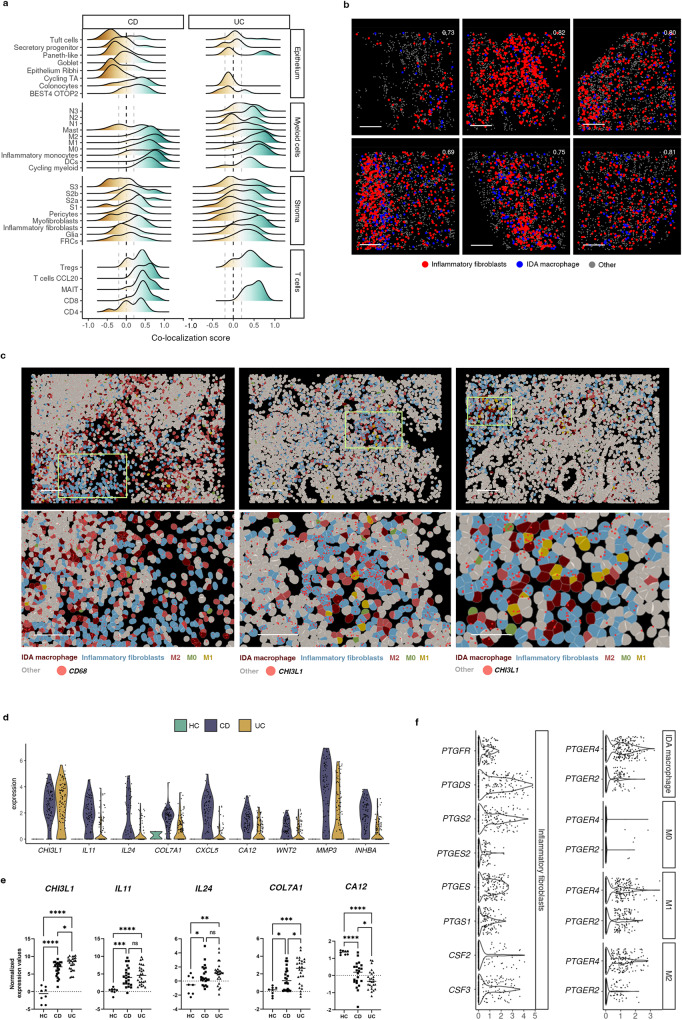
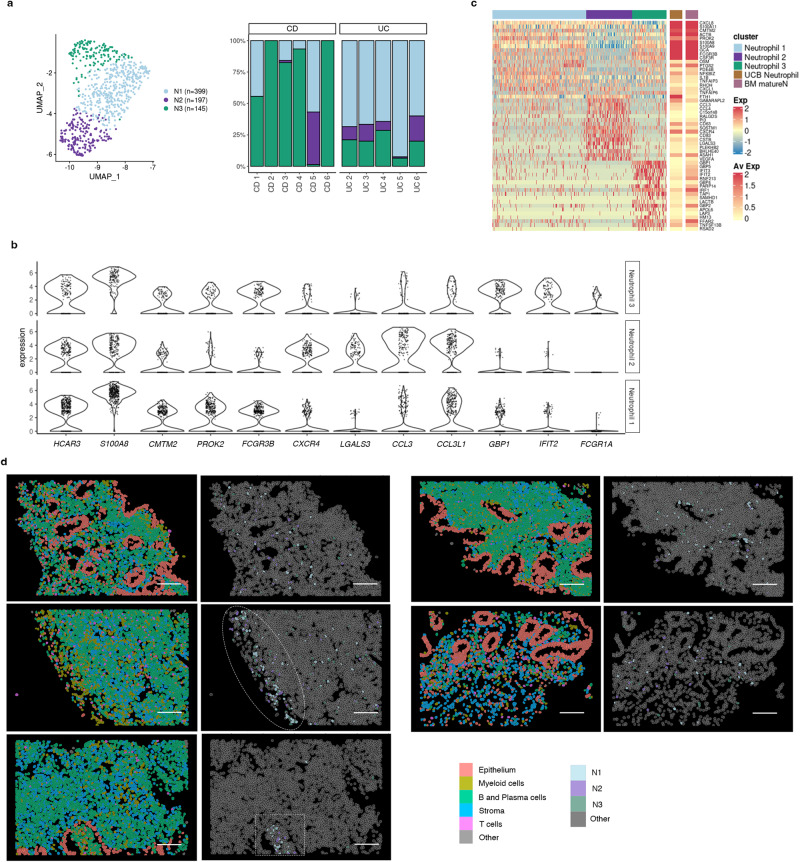
Ulcerative colitis and Crohn's disease are chronic inflammatory intestinal diseases with perplexing heterogeneity in disease manifestation and response to treatment. While the molecular basis for this heterogeneity remains uncharacterized, single-cell technologies allow us to explore the transcriptional states within tissues at an unprecedented resolution which could further understanding of these complex diseases. Here, we apply single-cell RNA-sequencing to human inflamed intestine and show that the largest differences among patients are present within the myeloid compartment including macrophages and neutrophils. Using spatial transcriptomics in human tissue at single-cell resolution (CosMx Spatial Molecular Imaging) we spatially localize each of the macrophage and neutrophil subsets identified by single-cell RNA-sequencing and unravel further macrophage diversity based on their tissue localization. Finally, single-cell RNA-sequencing combined with single-cell spatial analysis reveals a strong communication network involving macrophages and inflammatory fibroblasts. Our data sheds light on the cellular complexity of these diseases and points towards the myeloid and stromal compartments as important cellular subsets for understanding patient-to-patient heterogeneity.


Conflict of interest statement

H.H. is co-founder of Omniscope, a scientific advisory board member of MiRXES and consultant to Moderna. A.S. is the recipient of research grants from Roche-Genentech, Abbvie, GSK, Scipher Medicine, Pfizer, Alimentiv, Inc, Boehringer Ingelheim and Agomab; receives consulting fees from Genentech, GSK, Pfizer, HotSpot Therapeutics, Alimentiv, Origo Biopharma, Deep Track Capital, Great Point Partners and Boxer Capital; and is on the advisory boards of BioMAdvanced Diagnostics, Goodgut and Orikine. MaE. has received support for conference attendance and research support from Abbvie, Biogen, Faes Farma, Ferring, Jannsen, MSD, Pfizer, Takeda, and Tillotts. J.P. received financial support for research from AbbVie and Pfizer; consultancy fees/honorarium from AbbVie, Arena, Athos, Atomwise, Boehringer Ingelheim, Celgene, Celltrion, Ferring, Galapagos, Genentech/Roche, GlaxoSmithKline, Janssen, Mirum, Morphic, Nestlé, Origo, Pandion, Pfizer, Progenity, Protagonist, Revolo, Robarts, Takeda, Theravance and Wasserman; reports payment for lectures including service on speaker bureau from Abbott, Ferring, Janssen, Pfizer and Takeda; and reports payment for development of educational presentations from Abbott, Janssen, Pfizer Roche and Takeda. A.M-C has received financial support for conference attendance, educational activities, and research support from Abbvie, Biogen, Ferring, Jannsen, MSD, Takeda, Dr. Falk Pharma and Tillotts. E.K., Y.K., and M.L. are current/former employees and shareholders of NanoString Technologies. S.V. is a current employee of Boehringer-Ingelheim Pharmaceuticals. The remaining authors declare no competing interests.

Figures

Fig. 1
Fig. 1. Integration of single cell RNA sequencing (scRNA-seq) and Spatial Molecular Imaging (SMI) provides a map of healthy and inflammatory bowel disease (IBD) colonic biopsies.
a Overview of the study design for scRNA-seq, CosMxTM SMI and label transfer from scRNA-seq annotations to the SMI dataset. Two cohorts of colonic samples including active Crohn’s disease (CD), active ulcerative colitis (UC) and healthy controls (HC) were processed by scRNA-seq (n = 18 samples) and CosMxTM SMI (n = 9 samples). Figure made in BioRender.com. b Heatmap of top marker genes discriminating the different cell subsets (epithelium, stroma, T cells, B and Plasma cells, and myeloid cells) and, below, barplots representing the proportions of each cell type resolved by scRNA-seq for HC, CD and UC. On the right, UMAP showing annotation of all cell types identified by scRNA-seq. c UMAP and barplots of scRNA-seq data. Cells in UMAP are colored by group origin (HC, CD and UC) and clusters are shaded by cell subset (epithelium, stroma, T cells, B and Plasma cells, and myeloid cells). Barplots show the proportions of each cell subset in HC, CD and UC. Sub-segmentation of the barplots indicates the contribution of each individual. d UMAP and barplots of CosMxTM SMI data. Top UMAP shows cells colored by group (HC, CD and UC) while bottom UMAP is colored by cell subset (epithelium, stroma, T cells, B and Plasma cells and myeloid cells). Barplots show the proportions of each cell subset in HC, CD and UC. Sub-segmentation of the barplots indicates the contribution of each individual. Source data are provided as a Source Data file.
Fig. 2
Fig. 2. Analysis of myeloid cell subsets in healthy and inflamed colonic mucosa.
a UMAP representation of scRNA-seq data for the myeloid clusters in healthy controls (HC, n = 6) and IBD colonic samples (CD n = 6, UC n = 6) (i); myeloid cell subset proportions across healthy and IBD samples (ii). b Cell type enrichment analysis using the differential abundance test Milo comparing CD (left panels) or UC (right panels) to HC. Nhood groups are shown for each comparison (top panels). The fold changes and annotations of each nhood in CD and UC samples are shown in lower panels. c Volcano plot of differentially expressed genes (DEGs) comparing M2 to M0 macrophages (see Supplementary Table 2 for the complete gene list). A two-sided Wilcoxon rank sum test was applied. Genes with a false discovery rate adjusted p value < 0.05, and a fold change (FC) > 1.2 or FC < 0.83 are considered regulated. d Heatmap showing average expression of DEGs for M0, M2, M1 and IDA macrophages in HC, CD and UC. e CosMxTM SMI images showing spatial distribution of the different myeloid cell populations in representative Fields of View of colonic tissue of two HC, one CD and two UC patients. White dotted circle indicates ulcerated area with abundant M1 macrophages. Scale bar = 100 μm. f Double immunofluorescence showing M2 (CD209+CD68+) and M0 (CD209-CD68+) cells in one healthy tissue (left and lower right insets). White and yellow arrows indicate M0 and M2 macrophages, respectively. Right two top panels: immunohistochemistry showing CD68 and CD209 expression in one healthy tissue. Images are representative of 12 independent samples. Scale bar = 20 µm. g CosMxTM SMI images of a representative healthy colonic sample with lymphoid follicles (highlighted by dotted circles). The cellular localization of epithelial, stroma, T cells, B and plasma cells, and myeloid cells,(top panels) and M0 and M2 macrophages (lower panels) is shown. Scale bar = 100 μm. Source data are provided as a Source Data file. HC, healthy controls. IBD, inflammatory bowel disease. CD, Crohn’s disease. UC, ulcerative colitis.
Fig. 3
Fig. 3. Neuregulin 1 expression and function in colonic mucosa.
a Violin plot showing the expression of selected marker genes on IDA, M2 and M1 macrophages from pooled HC (n = 6), CD (n = 6) and UC (n = 6) scRNA-seq data. b UMAP showing NRG1 expression in the myeloid compartment of HC and IBD data. c NRG1 expression from bulk biopsy RNA-seq data in HC (n = 8), and active CD (n = 22) and UC (n = 26) patients. Ordinary one-way ANOVA test (Benjamini-Yekutieli) was performed correcting for multiple comparisons. Each sample is represented as a dot and the median value as a line. **p < 0,0068, ns = 0,1693. d Double In situ hybridization of NRG1 and immunohistochemistry for CD68 in one HC and one UC sample (representative image out of 6 independent biological replicates). White arrows show NRG1+CD68+ cells. Scale bar= 10 µm. e Human-derived epithelial organoids treated with vehicle (Ctrl) or Neuregulin 1 (1 μg/mL) for 48 h. Scale bars = 100 µm. mRNA expression of OLFM4, LGR5 and MKI67 was determined by RT-qPCR (n = 13 biologically independent samples). One-sample t-test was performed. Data is shown as fold change (FC) relative to the vehicle-treated condition. Bars represent mean ± standard deviation. OLFM4 p = 0,0029 (**), LGR5 p = 0,0019(**), MKI67 ns: p = 0,8518. f Violin plot showing OLFM4 expression by scRNA-seq in all epithelial cell subsets from HC (green) and IBD (orange) samples. g OLFM4 expression by bulk RNA-seq of colonic samples from HC (n = 8), active CD (n = 22) and active UC (n = 26) patients. Ordinary one-way ANOVA test (Benjamini-Yekutieli) was performed correcting for multiple comparisons. Each sample is represented as a dot and the median value as a line. p < 0,0001(****), ns: not significant. h, (i) Olfactomedin 4 immunostaining and (ii) OLFM4 in situ hybridization in HC, CD and UC colon (images representative of 9 biological replicates). Scale bars = 100 µm. (iii) CosMxTM SMI visualization of epithelial cell subsets in a HC and two UC representative Fields of View (FoVs) and (iv) mean expression of OLFM4 in each of those cells analyzed by CosMxTM SMI. Scale bar = 200 μm. i Expression of DEFA5, LCN2, DUOX2A, REG1A, and OLFM4 within epithelium of representative FoVs of a UC patient analyzed by CosMxTM SMI. Dots represent mRNA molecules. Scale bar = 200 μm. Source data are provided as a Source Data file. HC, healthy controls. IBD, inflammatory bowel disease. CD, Crohn’s disease. UC, ulcerative colitis.
Fig. 4
Fig. 4. Inflammation-Dependent Alternative (IDA) macrophages are widely distributed in ulcerative colitis and present in Crohn’s disease granulomas.
a CosMxTM SMI distribution of IDA and M1 macrophages in IBD colonic samples. Images from 1 representative UC (2 Fields of View (FoV)) and 1 CD (4 FoVs) patients (out of a total of 6 patients analyzed) are shown. Scale bar = 200 μm. b CD colonic sample with multiple granulomas (CD b patient). (i) Two FoVs from this patient are indicated by squares and other granulomas found in the same sample by yellow arrows. (ii) Macrophages within granulomas are shown by CosMxTM SMI in FoVs 4 and 5 and protein expression (Scale bar = 200 μm) of (iii) CD68 and (iv) CD209 is shown by immunohistochemistry on the same tissue sections (Scale bar = 100 µm). c Double NRG1 in situ hybridization and CD68 or CD209 immunostaining in tissue sections from the CD patient (CD b) containing abundant granulomas. In situ hybridization of NRG1 shows an increasing gradient of expression towards the apical mucosa. Granulomas are indicated by dotted circles (Scale bar = 100 µm). d Magnified pictures of representative granulomas of the same CD tissue stained for NRG1 using in situ hybridization and CD68 or CD209 immunostaining. Granulomas are indicated by dotted circles and NRG1 positive cells are shown by arrows (Scale bar = 100 µm). Source data are provided as a Source Data file. HC, healthy controls. IBD, inflammatory bowel disease. CD, Crohn’s disease. UC, ulcerative colitis.
Fig. 5
Fig. 5. Inflammation-Dependent Associated (IDA) macrophages co-localize with inflammatory fibroblasts.
a Ridge plot of co-localization analysis of IDA macrophages and epithelial, other myeloid, stromal and T lymphocytes by CosMxTM SMI. Correlation for cell positions was calculated per cell type (0 indicates no correlation, >1 indicates co-localization with 1 being cells sharing the same position; <1 indicates negative correlation between the indicated cell types). Data is pooled from all CD (n = 3 donors, total of 56 Fields of View (FoVs)) and UC (n = 3 donors, 67 FoVs) patients. b Co-localization analysis between IDA macrophages and inflammatory fibroblasts in inflamed UC tissue. Six representative FoVs from 2 independent UC patients are shown. Co-localization scores are indicated in white for each FoV. Scale bar = 100 μm. c Images containing IDA macrophages and inflammatory fibroblasts. Three representative FoVs (from 2 patients, 1 UC and 1 CD) are shown. Expression of CD68 (macrophages) or CHI3L1 (inflammatory fibroblasts) is shown as red dots. Each dot represents a single mRNA molecule. Scale bar = 100 μm. d Violin plots showing expression (y-axis) of marker genes (x-axis) of inflammatory fibroblasts in HC (n = 6), active CD (n = 6) and active UC (n = 6) determined by scRNA-seq. e Expression of markers of inflammatory fibroblasts in HC (n = 8), and active CD (n = 22) and UC (n = 26) patients in bulk biopsy RNA-seq data. Ordinary one-way ANOVA test (Benjamini-Yekutieli) was performed correcting for multiple comparisons. Each sample is represented as a dot and the median value as a line p < 0,05(*), p < 0,01 (**), p < 0,001(***), p < 0,0001(****), ns: not significant. f Violin plot visualizing scRNAseq-based expression (y-axis) of prostaglandin-related genes in inflammatory fibroblasts, IDA macrophage, M2 (M2 & M2.2) and M1 (M1 ACOD1 & M1 CXCL5) in pooled data of HC (n = 6), CD (n = 6) and UC (n = 6). Expression of CSF3 and CSF2 in inflammatory fibroblasts has been also included. Source data are provided as a Source Data file. HC, healthy controls. IBD, inflammatory bowel disease. CD, Crohn’s disease. UC, ulcerative colitis.
Fig. 6
Fig. 6. Analysis of the heterogeneity of neutrophil populations in inflammatory bowel disease (IBD) colonic mucosa.
a UMAP showing the three neutrophil subsets/states (N1, N2, N3) observed in IBD samples by scRNA-seq analysis. Barplot representing the proportions of each neutrophil subset across health and IBD. b Violin plots visualizing the expression (x-axis) of marker genes common and specific for all three neutrophil populations (y-axis). c Heat map showing the average normalized and scaled expression of differentially expressed genes in all three neutrophil subsets. Average expression of these genes on neutrophils from cord blood and bone marrow mature neutrophils is shown on the far right (Xie X. et al. 2021, Zhao Y. et al. 2019). d Representative CosMx SMI images of IBD inflamed tissue showing the spatial location of N1, N2 and N3 neutrophil subsets. Images correspond to 4 independent patients, 1 CD (showing 2 different Fields of View (FoV)) and 3 UC (1 FoV each). Circle shows the surface of an ulcer, and a square shape is used to indicate a crypt abscess. Source data are provided as a Source Data file. IBD, inflammatory bowel disease. CD, Crohn’s disease. UC, ulcerative colitis.

References

    1. Flynn S, Eisenstein S. Inflammatory Bowel Disease Presentation and Diagnosis. Surg. Clin. North Am. 2019;99:1051–1062. doi: 10.1016/j.suc.2019.08.001. - DOI - PubMed
    1. Verstockt B, Bressler B, Martinez-Lozano H, McGovern D, Silverberg MS. Time to Revisit Disease Classification in Inflammatory Bowel Disease: Is the Current Classification of Inflammatory Bowel Disease Good Enough for Optimal Clinical Management? Gastroenterology. 2022;162:1370–1382. doi: 10.1053/j.gastro.2021.12.246. - DOI - PubMed
    1. Smillie CS, et al. Intra- and Inter-cellular Rewiring of the Human Colon during Ulcerative Colitis. Cell. 2019;178:714–730.e722. doi: 10.1016/j.cell.2019.06.029. - DOI - PMC - PubMed
    1. Parikh K, et al. Colonic epithelial cell diversity in health and inflammatory bowel disease. Nature. 2019;567:49–55. doi: 10.1038/s41586-019-0992-y. - DOI - PubMed
    1. Kinchen J, et al. Structural Remodeling of the Human Colonic Mesenchyme in Inflammatory Bowel Disease. Cell. 2018;175:372–386.e317. doi: 10.1016/j.cell.2018.08.067. - DOI - PMC - PubMed

Publication types