

Neuroinvasion and anosmia are independent phenomena upon infection with SARS-CoV-2 and its variants
- PMID: 37495586
- PMCID: PMC10372078
- DOI: 10.1038/s41467-023-40228-7
Neuroinvasion and anosmia are independent phenomena upon infection with SARS-CoV-2 and its variants
Erratum in
-
Author Correction: Neuroinvasion and anosmia are independent phenomena upon infection with SARS-CoV-2 and its variants.Nat Commun. 2023 Dec 4;14(1):8024. doi: 10.1038/s41467-023-42800-7. Nat Commun. 2023. PMID: 38049391 Free PMC article. No abstract available.
Abstract
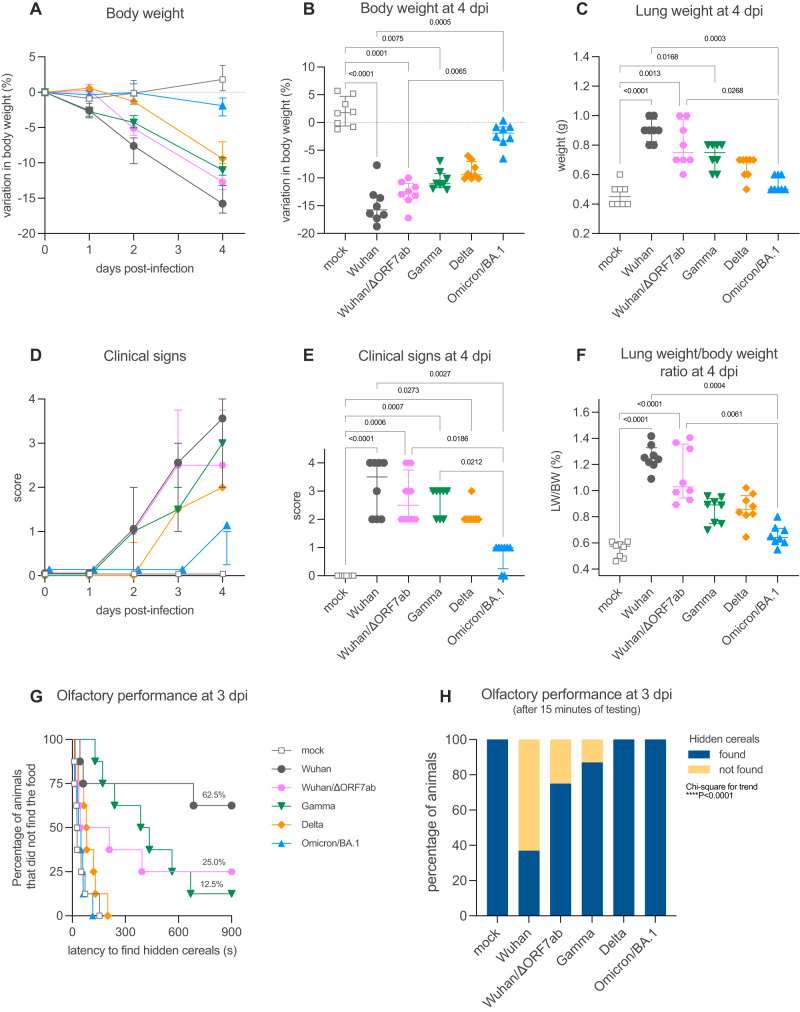
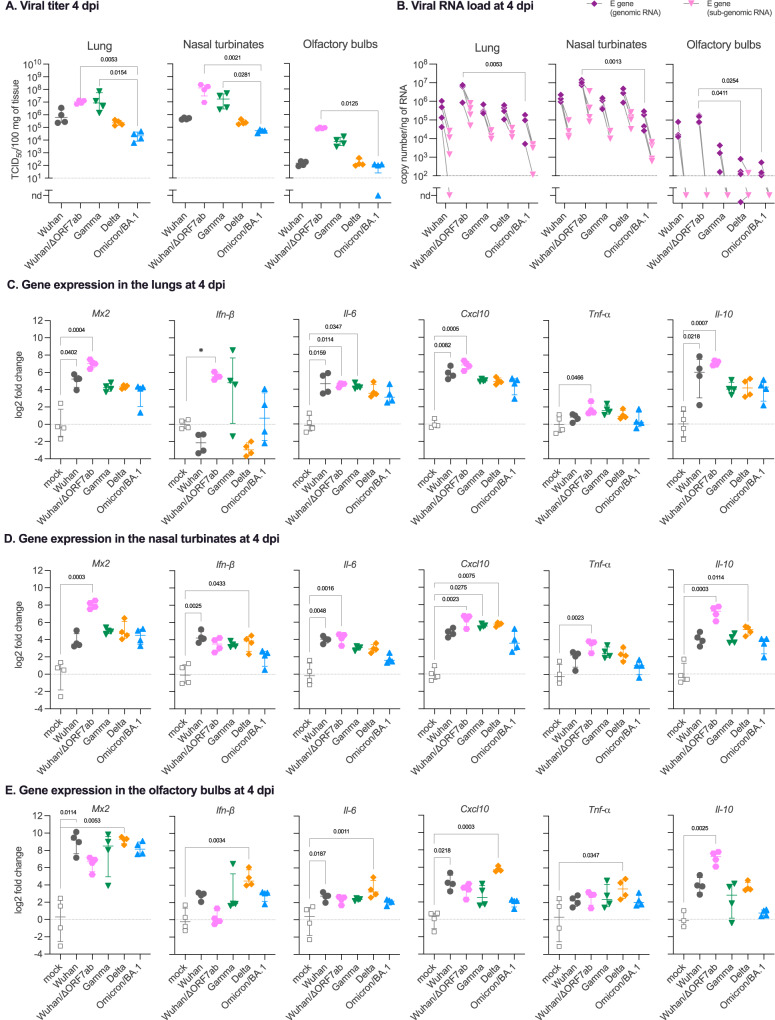
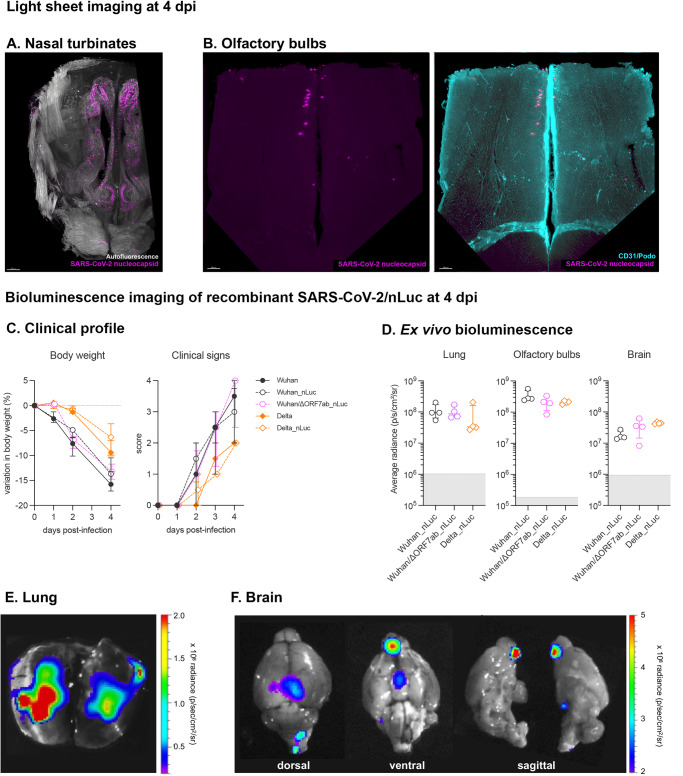
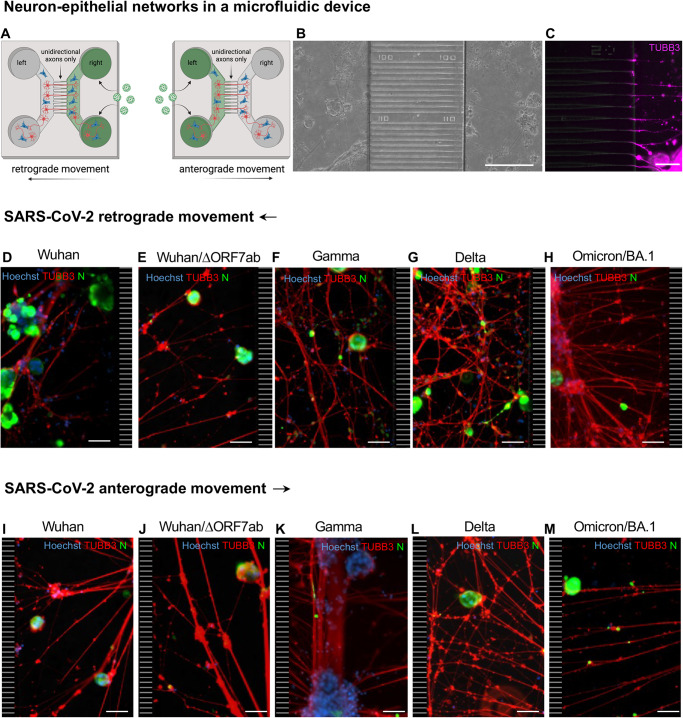
Anosmia was identified as a hallmark of COVID-19 early in the pandemic, however, with the emergence of variants of concern, the clinical profile induced by SARS-CoV-2 infection has changed, with anosmia being less frequent. Here, we assessed the clinical, olfactory and neuroinflammatory conditions of golden hamsters infected with the original Wuhan SARS-CoV-2 strain, its isogenic ORF7-deletion mutant and three variants: Gamma, Delta, and Omicron/BA.1. We show that infected animals develop a variant-dependent clinical disease including anosmia, and that the ORF7 of SARS-CoV-2 contributes to the induction of olfactory dysfunction. Conversely, all SARS-CoV-2 variants are neuroinvasive, regardless of the clinical presentation they induce. Taken together, this confirms that neuroinvasion and anosmia are independent phenomena upon SARS-CoV-2 infection. Using newly generated nanoluciferase-expressing SARS-CoV-2, we validate the olfactory pathway as a major entry point into the brain in vivo and demonstrate in vitro that SARS-CoV-2 travels retrogradely and anterogradely along axons in microfluidic neuron-epithelial networks.
© 2023. The Author(s).
Conflict of interest statement
The authors declare no competing interests.
Figures
Similar articles
-
Signs and symptoms to determine if a patient presenting in primary care or hospital outpatient settings has COVID-19.Cochrane Database Syst Rev. 2022 May 20;5(5):CD013665. doi: 10.1002/14651858.CD013665.pub3. Cochrane Database Syst Rev. 2022. PMID: 35593186 Free PMC article.
-
Omicron Impacts Olfaction in Hamsters.FASEB J. 2025 Jul 31;39(14):e70879. doi: 10.1096/fj.202501431RR. FASEB J. 2025. PMID: 40711352 Free PMC article.
-
Quantitative characterisation of extracellular vesicles designed to decoy or compete with SARS-CoV-2 reveals differential mode of action across variants of concern and highlights the diversity of Omicron.Cell Commun Signal. 2025 Jul 2;23(1):323. doi: 10.1186/s12964-025-02223-x. Cell Commun Signal. 2025. PMID: 40604989 Free PMC article.
-
Differential olfactory dysfunction and nasal tissue pathology in Syrian hamsters infected with SARS-CoV-2 variants.Microbiol Spectr. 2025 Sep 3:e0075525. doi: 10.1128/spectrum.00755-25. Online ahead of print. Microbiol Spectr. 2025. PMID: 40899851
-
SARS-CoV-2-neutralising monoclonal antibodies to prevent COVID-19.Cochrane Database Syst Rev. 2022 Jun 17;6(6):CD014945. doi: 10.1002/14651858.CD014945.pub2. Cochrane Database Syst Rev. 2022. PMID: 35713300 Free PMC article.
Cited by
-
The Aggravating Role of Failing Neuropeptide Networks in the Development of Sporadic Alzheimer's Disease.Int J Mol Sci. 2024 Dec 5;25(23):13086. doi: 10.3390/ijms252313086. Int J Mol Sci. 2024. PMID: 39684795 Free PMC article. Review.
-
Neuropathological findings in Down syndrome, Alzheimer's disease and control patients with and without SARS-COV-2: preliminary findings.Acta Neuropathol. 2024 May 27;147(1):92. doi: 10.1007/s00401-024-02743-9. Acta Neuropathol. 2024. PMID: 38801558 Free PMC article.
-
Long Neuro-COVID-19: Current Mechanistic Views and Therapeutic Perspectives.Biomolecules. 2024 Aug 28;14(9):1081. doi: 10.3390/biom14091081. Biomolecules. 2024. PMID: 39334847 Free PMC article. Review.
-
SARS-CoV-2 causes dysfunction in human iPSC-derived brain microvascular endothelial cells potentially by modulating the Wnt signaling pathway.Fluids Barriers CNS. 2024 Apr 8;21(1):32. doi: 10.1186/s12987-024-00533-9. Fluids Barriers CNS. 2024. PMID: 38584257 Free PMC article.
-
New evidence suggests SARS-CoV-2 neuroinvasion along the nervus terminalis rather than the olfactory pathway.Acta Neuropathol. 2024 Jan 6;147(1):10. doi: 10.1007/s00401-023-02664-z. Acta Neuropathol. 2024. PMID: 38183496 Free PMC article. No abstract available.
References
-
- WHO. WHO Coronavirus Disease (COVID-19) Dashboard. https://covid19.who.int/ (2022).
Publication types
MeSH terms
LinkOut - more resources
Full Text Sources
Medical
Miscellaneous
