. 2023 Jul 26;14(1):4505.
doi: 10.1038/s41467-023-40207-y.

Generation of whole tumor cell vaccine for on-demand manipulation of immune responses against cancer under near-infrared laser irradiation

Affiliations

Generation of whole tumor cell vaccine for on-demand manipulation of immune responses against cancer under near-infrared laser irradiation

Jiaqi Meng et al. Nat Commun. .

Abstract

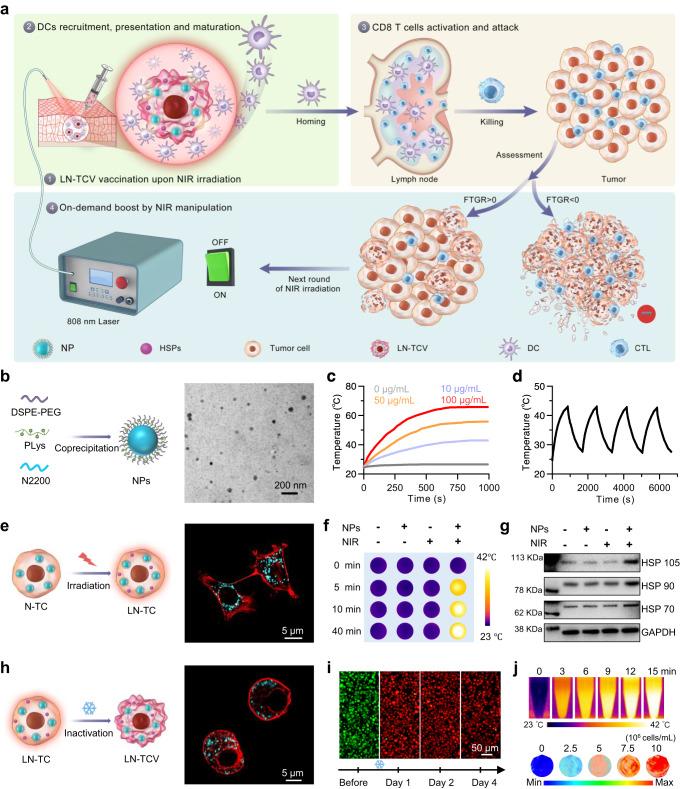
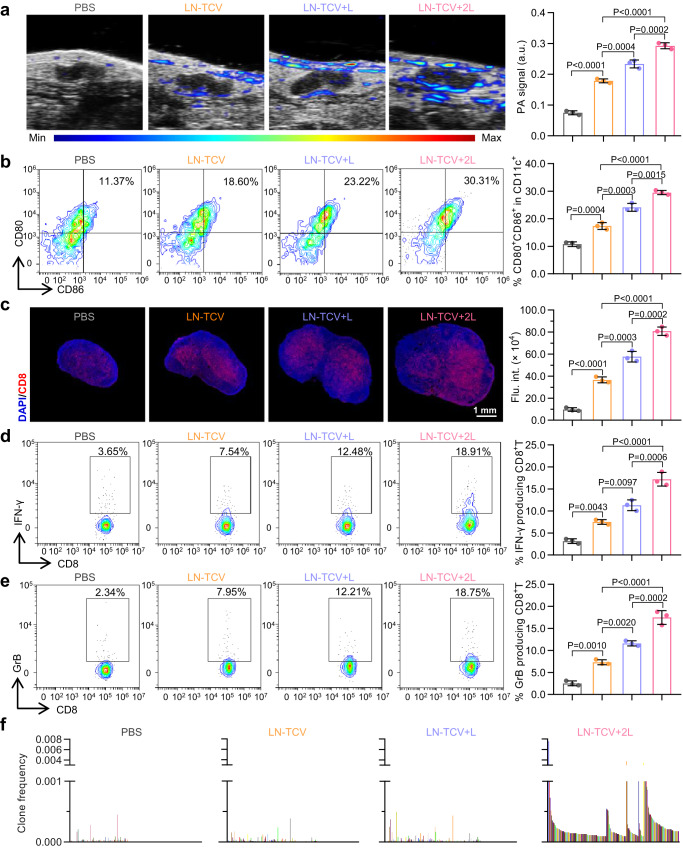
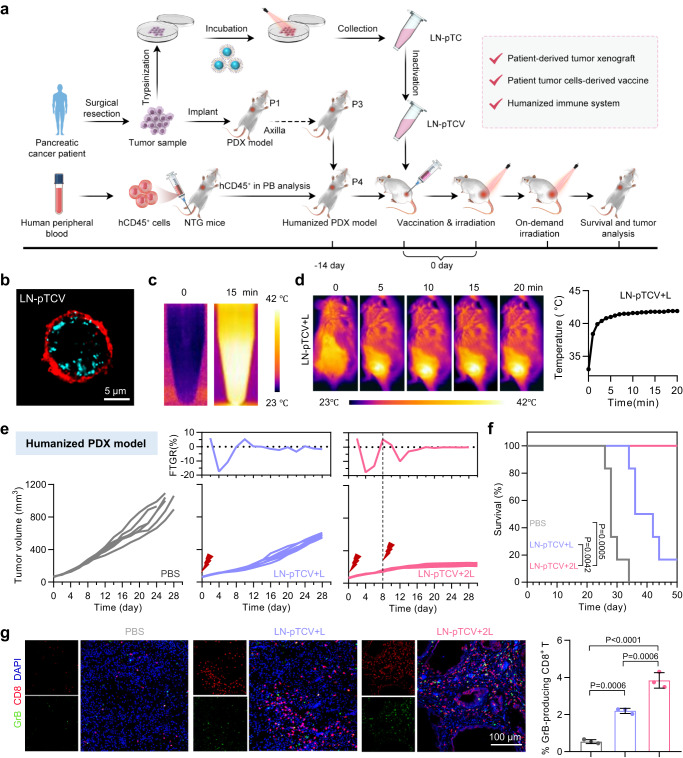
The therapeutic efficacy of whole tumor cell vaccines (TCVs) is modest, which has delayed their translation into personalized immunotherapies in the clinic. Here, we develop a TCV platform based on photothermal nanoparticle-loaded tumor cells, which can be rationally applied to diverse tumor types to achieve on-demand boost of anti-tumor immune responses for inhibiting tumor growth. During the fabrication process, mild photothermal heating by near-infrared (NIR) laser irradiation induces the nanoparticle-bearing tumor cells to express heat shock proteins as endogenous adjuvants. After a single vaccination at the back of tumor-bearing mice, non-invasive NIR laser irradiation further induces mild hyperthermia at vaccination site, which promotes the recruitment, activation, and antigen presentation by dendritic cells. Using an indicator we term fluctuation of tumor growth rate, we determine appropriate irradiation regimens (including optimized irradiation intervals and times). This TCV platform enables on-demand NIR manipulation of immune responses, and we demonstrate potent therapeutic efficacy against six murine models that mimick a range of clinical scenarios, including a model based on humanized mice and patient-derived tumor xenografts.


Conflict of interest statement

The authors declare no competing interests.

Figures

Fig. 1
Fig. 1. Strategy of using photothermal nanoparticle-adopted whole tumor cell vaccine (LN-TCV) for on-demand near-infrared (NIR) manipulation of immune responses against cancer and corresponding characterizations of the LN-TCV construction process.
a Schematic illustration of NIR laser irradiation-manipulated immune responses for antitumor immunotherapy. The on-demand immune responses manipulated by NIR laser irradiation based on the fluctuation of tumor growth rate (FTGR) can promote antitumor therapeutic effects after a single vaccination. b Schematic illustration of the preparation (left) and transmission electron microscopy (TEM) image (right) of photothermal nanoparticles (NPs). c Temperature change curves for NPs with different concentrations upon continuous NIR laser irradiation (808 nm, 0.65 W/cm2, 1000 s). d Heating and cooling curves of NPs (10 μg/mL) after pulsed NIR laser irradiation (808 nm, 0.65 W/cm2). e Schematic illustration of LN-TC construction (left) and the confocal laser scanning microscopy (CLSM) image of N-TC (right). Red: Rhodamine-phalloidin-labeled-cell membrane; Cyan: P-F8-DPSB-labeled NPs. f NIR thermographic images of 4T1 tumor cells variously exposed to NPs and/or continuous NIR laser irradiation (808 nm, 0.65 W/cm2, 40 min). The cells were incubated with NPs for 12 h, and the free NPs were washed off before irradiation. g Western blotting analysis for the expression of HSP 70, HSP 90, and HSP 105 proteins in 4T1 tumor cells variously exposed to NPs and/or NIR laser irradiation (808 nm, 0.65 W/cm2, 40 min). h Schematic illustration of LN-TCV construction and CLSM images of LN-TCV for evaluating the cell membrane framework. Red: Rhodamine-phalloidin-labeled-cell membrane; Cyan: P-F8-DPSB-labeled NPs. i Live/dead analysis of LN-TCV before inactivation (before) and cultured (day 1, 2, and 4) after inactivation for demonstrating inactivated LN-TCV. Green: live cells; Red: dead cells. The images were presented with the same magnification. j NIR thermographic images of LN-TCV exposed to continuous NIR laser irradiation (808 nm, 0.65 W/cm2, 15 min) (top). Photoacoustic (PA) images of LN-TCV with different concentrations (From left to right: 0, 2.5 × 106, 5 × 106, 7.5 × 106, and 107 cells/mL) (bottom). The experiments in (bj) were repeated three times independently with similar results. Source data were provided in the Source data file.
Fig. 2
Fig. 2. Characterizations of photothermal response and subsequent immune responses with different treatments at the vaccination site.
a NIR thermographic images of mice in various groups (PBS, LN-TCV, LN-TCV+1st NIR, and LN-TCV+2nd NIR). b Representative bioluminescence images (left) and quantitative analysis (right) of IFN-γ-IRES-Venus-AkaLuc mice in different groups (PBS, LN-TCV, LN-TCV + L, and LN-TCV + 2L). c Transcriptome analysis of the vaccination sites (back of the mice) with indicated treatments at day 6. Differential gene cluster analysis was shown as a heat map (n = 2 mice per group). d Gene set enrichment analysis (GSEA) for the altered gene sets in the LN-TCV + 2L treatment group versus the PBS group. e Immunofluorescence slices (left) and quantitative analysis (right) of DCs (CD11c+) at the vaccination sites (back of the mice) from indicated groups at day 6. Green: CD11c+cells; Blue: cell nucleus. The images were presented with the same magnification. The P values of LN-TCV to PBS, LN-TCV + L to LN-TCV, LN-TCV + 2L to LN-TCV + L, and LN-TCV + 2L to LN-TCV were 0.0003, 0.0015, 0.0038, and <0.0001, respectively. f Representative flow cytometry plots (left) and quantitative analysis (right) of CD11c+MHC I+ cells at the vaccination sites (back of the mice) from indicated groups at day 6. The P values of LN-TCV to PBS, LN-TCV + L to LN-TCV, LN-TCV + 2L to LN-TCV + L, and LN-TCV + 2L to LN-TCV were 0.0039, 0.0048, 0.0002, and <0.0001, respectively. g Representative flow cytometry plots (left) and quantitative analysis (right) of mature DCs (CD80+CD86+ in CD11c+ gate) at the vaccination sites (back of the mice) from indicated groups at day 6. The P values of LN-TCV to PBS, LN-TCV + L to LN-TCV, LN-TCV + 2L to LN-TCV + L, and LN-TCV + 2L to LN-TCV were 0.0045, 0.0188, 0.0115, and 0.0002, respectively. Quantitative data in (b), (e), (f), and (g) were represented as mean values ± s.d., n = 3 mice per group. P values in (e), (f), and (g) were calculated by one-way ANOVA. The images and flow cytometry plots in (a), (b), (e), (f), and (g) were representative of three mice. Source data were provided in the Source data file.
Fig. 3
Fig. 3. Immune responses activated by LN-TCV with NIR laser irradiation at post-injection day 9 in the lymph node.
a PA images (left) and corresponding PA signal quantitative analysis (right) around the inguinal lymph nodes of mice with different treatments (PBS, LN-TCV, LN-TCV + L, and LN-TCV + 2L) for showing the homing of DCs. The P values of LN-TCV to PBS, LN-TCV + L to LN-TCV, LN-TCV + 2L to LN-TCV + L, and LN-TCV + 2L to LN-TCV were <0.0001, 0.0004, 0.0002, and <0.0001, respectively. b Representative flow cytometry plots (left) and quantitative analysis (right) of mature DCs (CD80+CD86+ in CD11c+ gate) in the lymph nodes of mice with indicated treatments. The P values of LN-TCV to PBS, LN-TCV + L to LN-TCV, LN-TCV + 2L to LN-TCV + L, and LN-TCV + 2L to LN-TCV were 0.0004, 0.0003, 0.0015, and <0.0001, respectively. c Immunofluorescence analysis (left) and quantitative analysis (right) of CD8+ T cells in the lymph nodes of mice with indicated treatments. Red: CD8+T cells; Blue: cell nucleus. The images were presented with the same magnification. The P values of LN-TCV to PBS, LN-TCV + L to LN-TCV, LN-TCV + 2L to LN-TCV + L, and LN-TCV + 2L to LN-TCV were <0.0001, 0.0003, 0.0002, and <0.0001, respectively. d Representative flow cytometry plots (left) and quantitative analysis (right) of IFN-γ-producing CD8+ T cells in the lymph nodes of mice with indicated treatments. The P values of LN-TCV to PBS, LN-TCV + L to LN-TCV, LN-TCV + 2L to LN-TCV + L, and LN-TCV + 2L to LN-TCV were 0.0043, 0.0097, 0.0006, and <0.0001, respectively. e Representative flow cytometry plots (left) and quantitative analysis (right) of granzyme B-producing CD8+ T cells in the lymph nodes of mice with indicated treatments. The P values of LN-TCV to PBS, LN-TCV + L to LN-TCV, LN-TCV + 2L to LN-TCV + L, and LN-TCV + 2L to LN-TCV were 0.0010, 0.0020, 0.0002, and <0.0001, respectively. f Clone frequencies of CDR3 sequences in the T cells derived from the lymph nodes of mice with indicated treatments (n = 1 mice per group). Quantitative data in (ae) were represented as mean values ± s.d., n = 3 mice per group. P values in (ae) were calculated by one-way ANOVA. The images and flow cytometry plots in (ae) were representative of three mice. Source data were provided in the Source data file.
Fig. 4
Fig. 4. Immune responses activated by LN-TCV with NIR laser irradiation against 4T1 tumor models.
a Experimental design for evaluating the therapeutic effects on 4T1 model. b Average tumor growth curves in different groups (PBS, LN-TCV, LN-TCV + L, and LN-TCV + 2L). The P values of LN-TCV to PBS, LN-TCV + L to LN-TCV, and LN-TCV + 2L to LN-TCV + L were all <0.0001. c Overall survival curves of the tumor-bearing mice in indicated groups. The P values of LN-TCV to PBS, LN-TCV + L to LN-TCV, and LN-TCV + 2L to LN-TCV + L were 0.0007, 0.0012, and 0.0006, respectively. d Immunofluorescence analysis of CD8+ T cells in tumors. Red: CD8+ T cell; Blue: cell nucleus. The images were presented with the same magnification. e Representative sections for cell proliferation analysis of tumor tissue by using Ki67 staining. Brown: proliferated cells. The images were presented with the same magnification. f Representative images of gross morphology of lung tissues (top) and computed tomography (CT) images of spontaneous tibia metastasis (bottom) in indicated groups. White arrow: lung metastasis. g Experimental design for evaluating the therapeutic effects on the postoperative Luc-4T1 model. h In vivo bioluminescence images of mice in indicated groups on various days (n = 6 mice per group). i Average tumor growth curves in different groups (PBS, LN-TCV + L, and LN-TCV + 2L). The P values of LN-TCV + L to PBS and LN-TCV + 2L to LN-TCV + L were <0.0001 and 0.0025. j Overall survival curves of the tumor-bearing mice in indicated groups. The P values of LN-TCV + L to PBS and LN-TCV + 2L to LN-TCV + L were 0.0005 and 0.0039. k Representative flow cytometry plots of effector memory T cells in the spleen examined in indicated groups at day 20. Quantitative data in (b) and (i) were represented as mean values ± s.d., n = 2 independent experiment, n = 6 mice per group. The experiments in (c) and (j) were n = 6 mice per group. P values in (b) and (i) were calculated by one-way ANOVA. P values in (c) and (j) were calculated by log-rank test. The images in (df) were representative of six mice, and the flow cytometry plots in (k) were representative of three mice. Source data were provided in the Source data file.
Fig. 5
Fig. 5. Universality of LN-TCV manipulated by on-demand NIR laser irradiation for inhibiting diverse tumor models.
a Experimental design to evaluate tumor inhibition in CT26 and Luc-Pan02 tumor models. b CT26 tumor growth curves (bottom) and the corresponding FTGR values (top) analysis in different groups (PBS, LN-TCV + L, LN-TCV + 2L, LN-TCV + 2L(earlier), and LN-TCV + 2L(later)). Mice in the LN-TCV + 2L group received the second NIR laser irradiation (808 nm, 0.65 W/cm2, 20 min) at day 8 according to the value of FTGR. However, mice in the LN-TCV + 2L(earlier) and the LN-TCV + 2L(later) received second NIR laser irradiation (808 nm, 0.65 W/cm2, 20 min) at earlier (day 4) or later (day 14), respectively. The tumor growth inhibition (TGI) in each treatment group was calculated at day 20. c TUNEL analysis in CT26 tumors with indicated treatments. d Luc-Pan02 tumor growth curves (bottom) and corresponding FTGR values (top) analysis in indicated groups. According to the value of FTGR, mice in LN-TCV + 2L received the second NIR laser irradiation (808 nm, 0.65 W/cm2, 20 min) at day 8 and mice in LN-TCV + 3L received the third NIR laser irradiation (808 nm, 0.65 W/cm2, 20 min) at day 18. e In vivo bioluminescence images of the Luc-Pan02 tumor-bearing mice in different groups (PBS, LN-TCV + L, LN-TCV + 2L, and LN-TCV + 3L) at various days. f Quantitative analysis of tumor-infiltrating CD8+ T cells and phenotyping with infiltrated CD8+ T cells in tumors of indicated groups. For the percentage of CD3+CD8+cells, The P values of LN-TCV + L to PBS, LN-TCV + 2L to LN-TCV + L, LN-TCV + 3L to LN-TCV + 2L, and LN-TCV + 3L to LN-TCV + L were 0.0048, 0.3812, 0.0257, and 0.0029, respectively. Quantitative data in (f) were represented as mean values ± s.d., n = 3 mice per group. P values in (f) were calculated by one-way ANOVA. The experiments in (b), (d), and (e) were repeated two times independently with similar results, n = 6 mice per group. The images in (c) were representative of three mice. Source data were provided in the Source data file.
Fig. 6
Fig. 6. Characterizations of patient tumor cells-derived LN-pTCV and corresponding on-demand NIR laser irradiation for inhibiting a humanized pancreatic cancer PDX model.
a Experimental design and LN-pTCV construction for evaluating antitumor effect in a humanized pancreatic cancer PDX model. PDX tissue was subcutaneously inoculated at the axilla of mice. LN-pTCV was subcutaneously injected at the back of the mice, and the NIR laser irradiation was executed at the same site. b CLSM image of patient tumor cell-derived LN-pTCV. Red: cell membrane; Cyan: NPs. c NIR thermographic images of patient tumor cell-derived LN-pTCV upon NIR laser irradiation (808 nm, 0.65 W/cm2, 15 min). d NIR thermographic images (left) and quantitative analysis (right) of mice treated with NIR laser irradiation (808 nm, 0.65 W/cm2, 20 min). e PDX tumor growth curves (bottom) and corresponding FTGR values analysis (top) in different groups (PBS, LN-pTCV+L, and LN-pTCV+2L). f Overall survival curves in indicated groups. The P values of LN-pTCV+2L to PBS and LN-pTCV+2L to LN-pTCV+L were 0.0005 and 0.0042. g Immunofluorescence analysis (left) and quantitative analysis (right) of granzyme B-producing CD8+ T cells in tumors. Red: CD8+ T; Green: granzyme B; Blue: cell nucleus. The images were representative of three mice and were presented with the same magnification. The P values of LN-pTCV+2L to PBS, LN-pTCV+L to PBS, and LN-pTCV+2L to LN-pTCV+L were <0.0001, 0.0006, and 0.0006, respectively. Quantitative data in (g) were represented as mean values ± s.d., n = 3 mice per group. P values in (g) were calculated by one-way ANOVA. P values in (f) were calculated by log-rank test. The experiments in (e) and (f) were n = 6 mice per group. The experiments in (b), (c), and (d) were repeated three times independently with similar results. Source data were provided in the Source data file.

Similar articles

Cited by

References

    1. Rosenberg SA, Yang JC, Restifo NP. Cancer immunotherapy: moving beyond current vaccines. Nat. Med. 2004;10:909–915. doi: 10.1038/nm1100. - DOI - PMC - PubMed
    1. Romero P, et al. The Human vaccines project: a roadmap for cancer vaccine development. Sci. Transl. Med. 2016;8:334–339. doi: 10.1126/scitranslmed.aaf0685. - DOI - PubMed
    1. Butterfield LH. Cancer vaccines. Br. Med. J. 2015;350:988. doi: 10.1136/bmj.h988. - DOI - PMC - PubMed
    1. Finn OJ. The dawn of vaccines for cancer prevention. Nat. Rev. Immunol. 2018;18:183–194. doi: 10.1038/nri.2017.140. - DOI - PubMed
    1. Hu Z, Ott PA, Wu CJ. Towards personalized, tumour-specific, therapeutic vaccines for cancer. Nat. Rev. Immunol. 2018;18:168–182. doi: 10.1038/nri.2017.131. - DOI - PMC - PubMed

Publication types