. 2023 Aug;620(7974):607-614.
doi: 10.1038/s41586-023-06333-9. Epub 2023 Jul 26.

Evolutionary histories of breast cancer and related clones

Affiliations

Evolutionary histories of breast cancer and related clones

Tomomi Nishimura et al. Nature. 2023 Aug.

Abstract

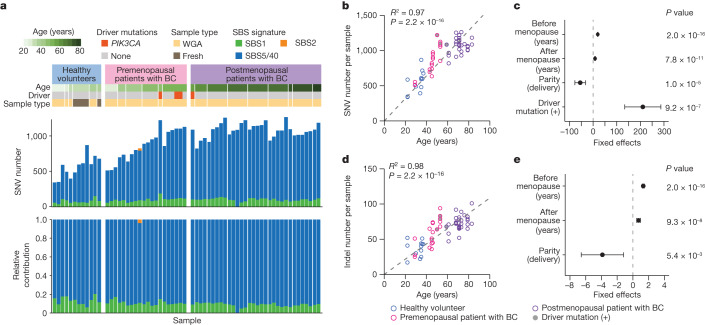
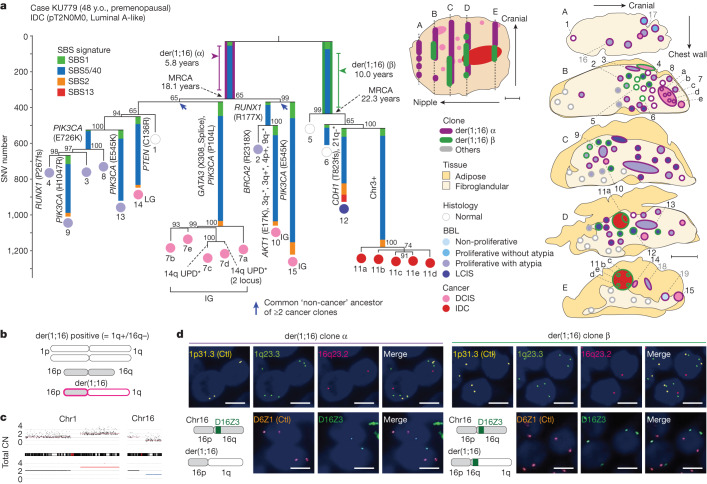
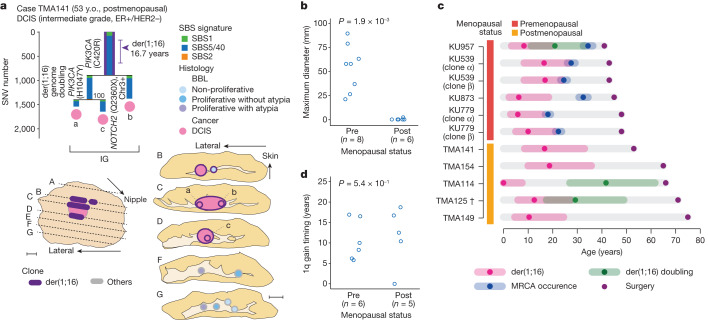
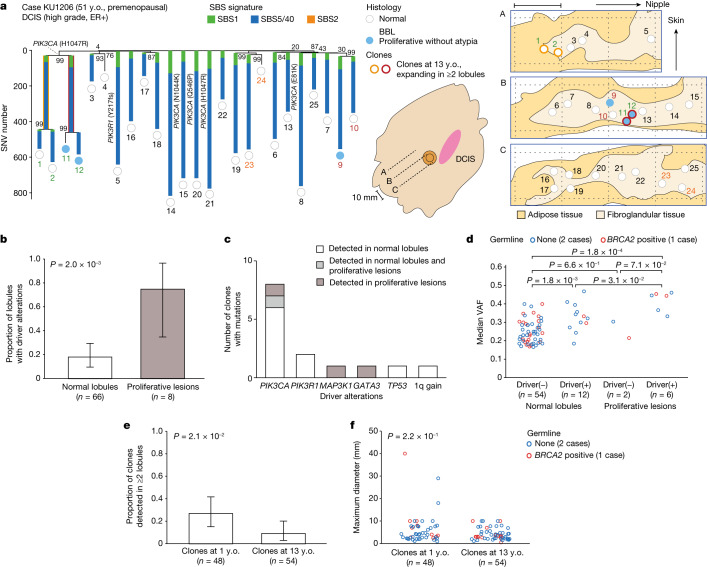
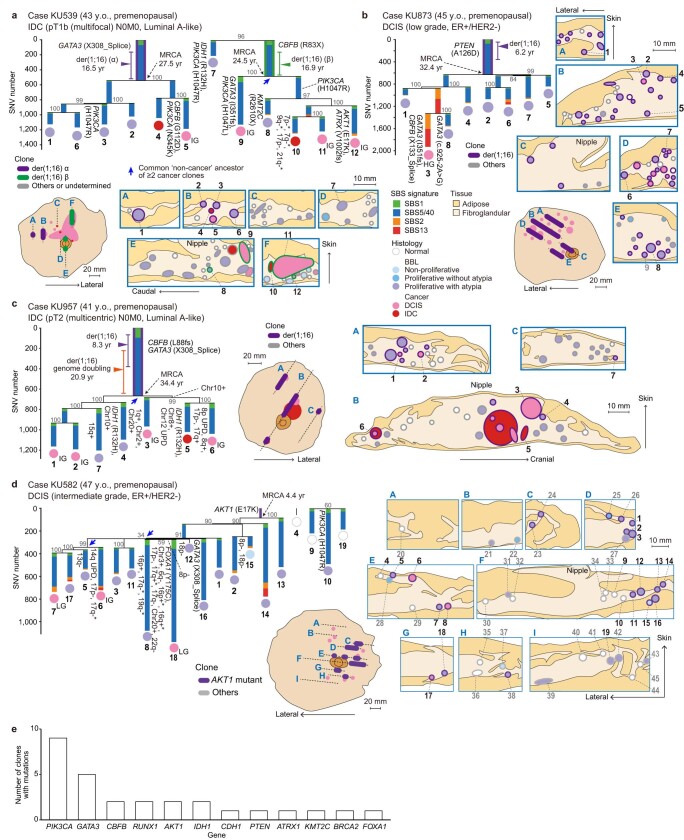
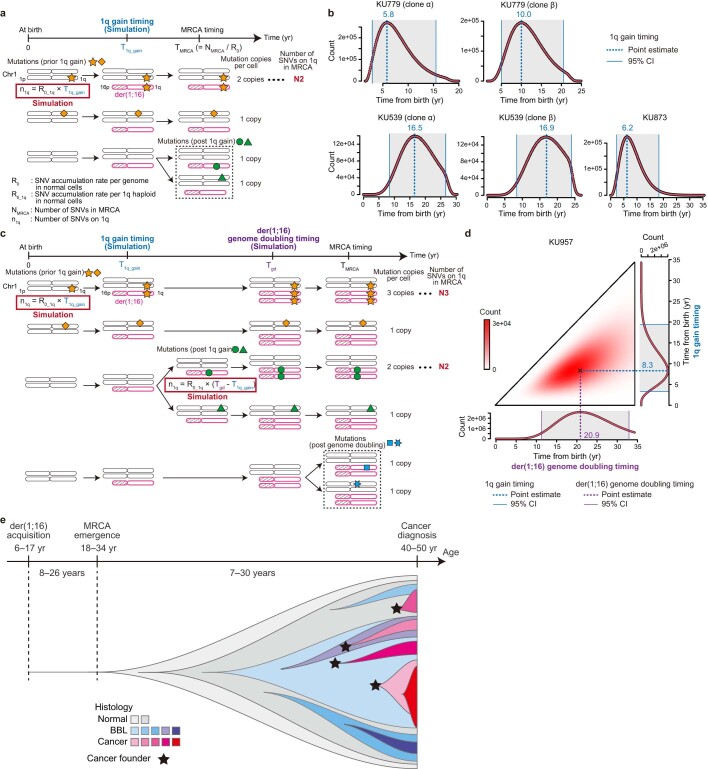
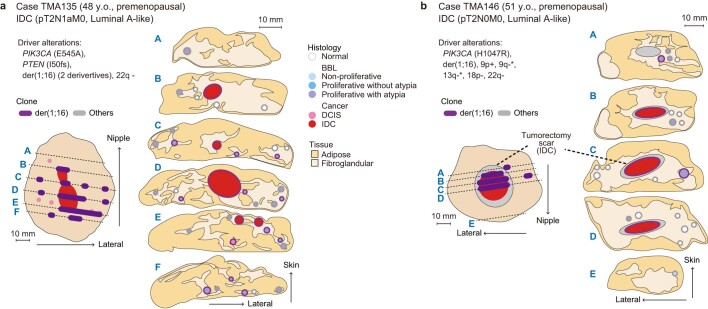
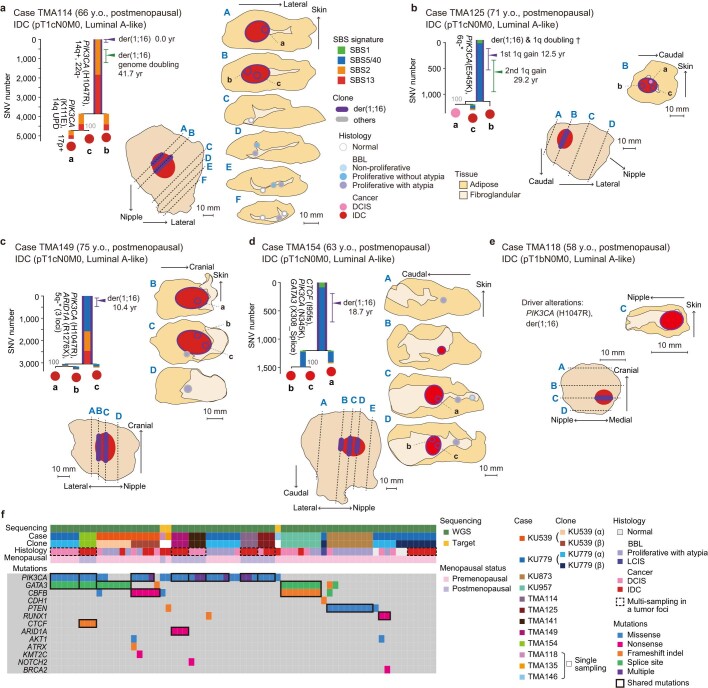
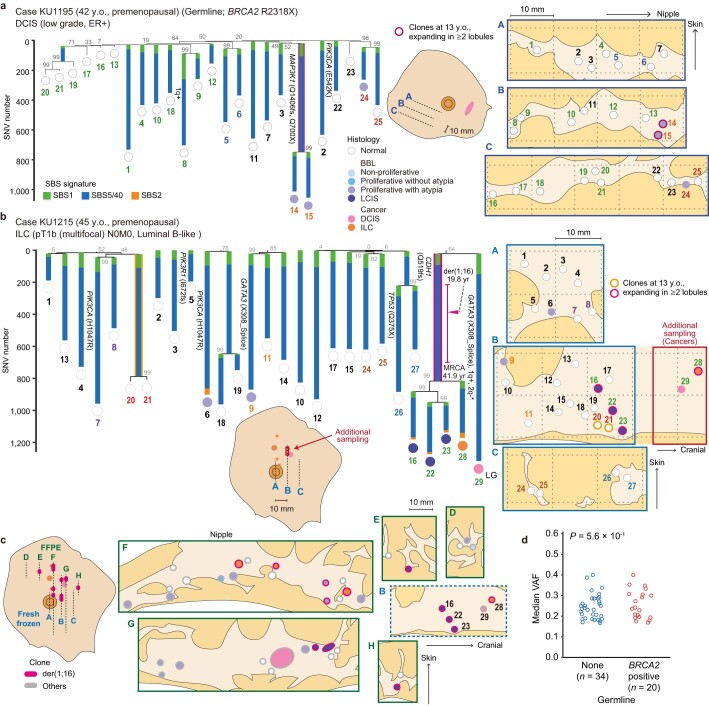
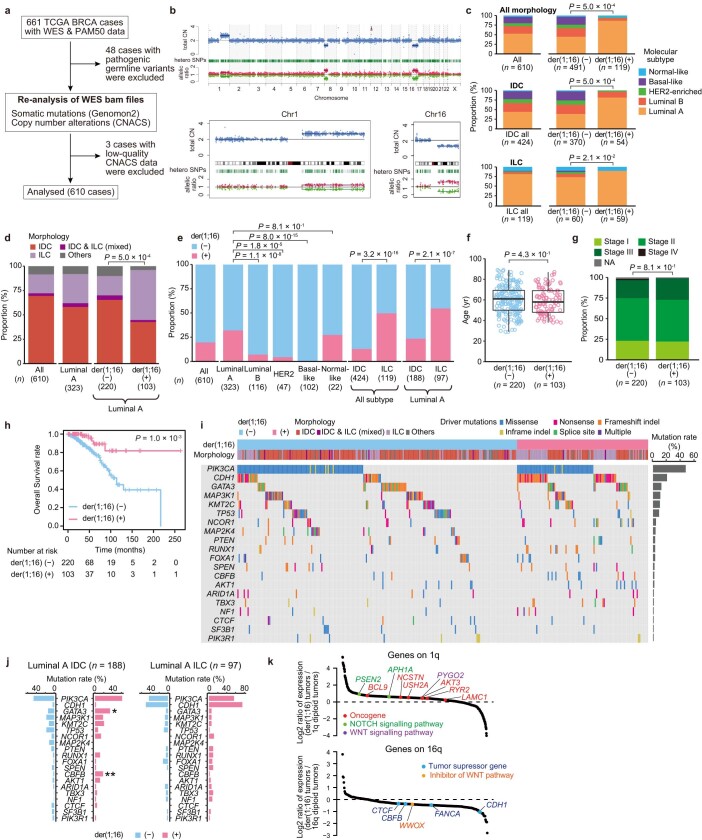
Recent studies have documented frequent evolution of clones carrying common cancer mutations in apparently normal tissues, which are implicated in cancer development1-3. However, our knowledge is still missing with regard to what additional driver events take place in what order, before one or more of these clones in normal tissues ultimately evolve to cancer. Here, using phylogenetic analyses of multiple microdissected samples from both cancer and non-cancer lesions, we show unique evolutionary histories of breast cancers harbouring der(1;16), a common driver alteration found in roughly 20% of breast cancers. The approximate timing of early evolutionary events was estimated from the mutation rate measured in normal epithelial cells. In der(1;16)(+) cancers, the derivative chromosome was acquired from early puberty to late adolescence, followed by the emergence of a common ancestor by the patient's early 30s, from which both cancer and non-cancer clones evolved. Replacing the pre-existing mammary epithelium in the following years, these clones occupied a large area within the premenopausal breast tissues by the time of cancer diagnosis. Evolution of multiple independent cancer founders from the non-cancer ancestors was common, contributing to intratumour heterogeneity. The number of driver events did not correlate with histology, suggesting the role of local microenvironments and/or epigenetic driver events. A similar evolutionary pattern was also observed in another case evolving from an AKT1-mutated founder. Taken together, our findings provide new insight into how breast cancer evolves.


Conflict of interest statement

The authors declare no competing interests.

Figures

Fig. 1
Fig. 1. Mutations in normal mammary epithelium.
a, Summary of SNVs found in 64 single-cell-derived organoids established from six healthy premenopausal breastfeeding women (healthy volunteers) and six premenopausal and nine postmenopausal patients with breast cancer (BC). Information about participant’s age, driver mutations and the presence or absence of WGA, are shown in the top panel. The stacked bar plots in the middle and bottom panels show the number of mutations and the proportion of indicated mutational signatures, respectively. b,d, The number of SNVs (b) and indels (d) in organoids (n = 64) are plotted for participant’s age. Regression lines assuming a zero intercept are applied to mean number of mutations for each participant (n = 21) and age, with R2 and P values from the two-sided F-test (grey dashed lines). c,e, Linear regression models were applied to 61 organoids with information on age at menopause and parity. Estimates of coefficients that significantly affect the number of mutations in the linear regression model are shown for SNVs (c) and indels (e), with 95% CI and P values from the two-sided t-test. Source Data
Fig. 2
Fig. 2. Clonal evolution of breast cancers.
a, Phylogenetic tree (left) and corresponding geographical maps of clones detected in the surgical specimens of a patient with breast cancer who underwent lumpectomy (KU779) (middle, an overview of the surgical specimen; right, split faces of the sliced specimens indicated by dotted lines in the overview image). Signature extraction was performed on branches with more than 100 SNVs, and each branch is coloured according to the proportion of SBS signatures. Bootstrap values (%) are shown in grey. Driver mutations and CNAs (*focal changes) are shown on each branch. Estimated timing of der(1;16) acquisition and MRCA emergence are shown, with 95% CI for der(1;16) acquisition. Colours inside the circles indicate histological results. Numbers indicate samples in which each clone representing the tip of tree was identified. Grade of DCIS is shown in the tree (LG, low grade; IG, intermediate grade). Blue arrows indicate common ‘non-cancer’ ancestors of two or more cancer clones. Colours around the circles in split faces depict clones to which lesions belong. Each circle was analysed by WGS (black numbers) or targeted sequencing (grey numbers), and/or FISH (unnumbered). UPD, uniparental disomy. Scale bars, 10 mm; y.o., years old. b,c, Schema of der(1;16)(q10;p10), which leads to concurrent whole-arm 1q gain and 16q loss (b); copy-number plots on chromosomes 1 and 16 (no. 7d in KU779) are shown in c. d, Representative FISH images of der(1;16) clones α (out of 62 lesions) and β (out of 22 lesions) in KU779 (nos. 13 and 12, respectively). The probe set of 1p.31.3, 1q23.3 and 16q23.2 (top row) was designed to detect all types of der(1;16)(+) clone, wherein 1p.31.3 signals were used as controls (Ctl). The probe set of D6Z1 and D16Z3 (bottom row) was designed to distinguish between clones α and β in KU779, wherein D6Z1 signals were used as Ctl (schemas are shown at the bottom left). Scale bar, 5 μm. Source Data
Fig. 3
Fig. 3. Clonal expansion in patients with der(1;16)(+) breast cancer.
a, Phylogenetic tree (top) and corresponding geographical map (bottom) of clones detected in the surgical specimen of a postmenopausal patient with der(1;16)(+) breast cancer who underwent lumpectomy (TMA141). All the representations follow those in Fig. 2a. Scale bars, 10 mm. b, Maximum diameter of the area where der(1;16)(+) non-cancer clones were observed in premenopausal (eight clones in six cases) and postmenopausal (six clones in six cases) patients with der(1;16)(+) breast cancer; P values were calculated using the two-sided Mann–Whitney U-test. c, Estimated timing of der(1;16) acquisition and MRCA emergence (only for premenopausal cases) is shown with the 95% CI. †, the first and second 1q gain timing were estimated because the order of der(1;16) and another 1q gain could not be determined in TMA125. d, Estimates of the first 1q gain timing of der(1;16)(+) clones were compared between premenopausal and postmenopausal patients. P values from the two-sided Mann–Whitney U-test. Source Data
Fig. 4
Fig. 4. Clonal expansion of non-cancer clones without der(1;16).
a, Phylogenetic tree (left) and corresponding geographical maps of clones detected in non-cancer lobules multi-sampled from the contralateral quadrant of the cancer-containing quadrant in a premenopausal patients with breast cancer without pathogenic germline variants (KU1206) (middle shows an overview of the surgical specimen, right shows split faces of the sliced specimens indicated by black dotted lines in the overview image). SBS signatures, bootstrap values, driver mutations, histological results and numbers are shown as in Fig. 2a. Numbers with the same colour depict samples belonging to the same clones that were present at the age of 1 year. As for clones that were present at the age of 13 years and detected in two or more lobules, corresponding shared branches in the trees and samples in the split faces are highlighted by colours and depicted with colours around circles, respectively. Scale bar, 10 mm. b, Proportion of lobules with driver alterations in histologically normal lobules (n = 66) and proliferative lesions (n = 8), with P values calculated using two-sided Fisher’s exact test. c, Number of clones carrying each driver alteration detected in the normal lobules and/or proliferative lesions. d, Median VAF in histologically normal lobules and proliferative lesions with and without driver alterations, with P values from the two-sided Mann–Whitney U-test. e,f, Proportion of der(1;16)(–) non-cancer clones detected in two or more lobules (e), and the maximum diameter of the area where each clone was observed (f); the clones present at the age of 1 year and 13 years, with P values from two-sided Fisher’s exact test (e) and the two-sided Mann–Whitney U-test (f), respectively. Whiskers in b and e indicate the 95% CI from the binomial distribution. The colours of plots in d and f depict the status of the germline variants. Source Data
Extended Data Fig. 1
Extended Data Fig. 1. Methods for WGS of single cell-derived organoids.
a, Schema of single normal epithelial cell-derived organoid establishment. WGA, whole-genome amplification. b, Methods for mutation calling of WGA samples established via culture method-1 shown in a. c, The number of SNVs (left) and indels (right) in single organoids plotted against the age of participants. Twelve organoids derived from milk of healthy breastfeeding women (healthy volunteers, n = 6) and 20 derived from the normal breast tissue of premenopausal breast cancer patients (n = 6) are shown. Linear regression models assuming a zero intercept were applied to mean number of mutations per participant and age, which are shown in grey dashed lines with R2 and coefficient values, wherein three organoids carrying driver mutations were excluded from the analysis. Source Data
Extended Data Fig. 2
Extended Data Fig. 2. VAF distribution of SNVs in single cell-derived organoids.
a, VAF densities of SNVs in representative organoids. Organoids with median VAF values ≥0.4 were defined as clonal, wherein the existence of subclones and VAF density of each clone were evaluated using Gaussian mixture models. In bimodal organoids with subclones, mutations with VAF values lower than the intersection point of the two clones were eliminated as subclonal mutations. b, VAF densities of SNVs identified in 71 single cell-derived organoids are depicted. The germline variants and somatic driver genes mutated in each sample are indicated.
Extended Data Fig. 3
Extended Data Fig. 3. Multi-sampling via LCM to investigate clonal evolution of breast cancers.
a, Representative haematoxylin and eosin staining of normal lobules, benign breast lesions (BBL), and cancer lesions (top row), and the corresponding images at a high power magnification (bottom row) (14 out of 337 lesions). b, Representative LCM images before and after the dissection (one out of 194 lesions). c, Representative sequence of lesions originating from the same clones (four out of seven clones). Founder driver alterations in each clone are shown in black. Scale bar = 150 μm.
Extended Data Fig. 4
Extended Data Fig. 4. Analysis of mutational signatures.
a, Number of SNVs in each sample (top) and the relative contribution of SBS signatures extracted using MutationalPatterns (second panel), SigProfiler (third panel), and HDP (bottom), fitted to known COSMIC SBS signatures. Signature extraction was performed on branches with more than 100 SNVs in FFPE and fresh-frozen LCM samples. b, Scatter plots showing the relative contribution of mutations in each sample assigned to each signature by MutationalPatterns (x-axis) versus SigProfiler (y-axis) (top), by MutationalPatterns (x-axis) versus HDP (y-axis) (middle), and by SigProfiler (x-axis) versus HDP (y-axis) (bottom), with the coefficient of determination (R2) derived from Pearson’s correlation. c, The proportion of APOBEC signatures (SBS2/SBS13) in the MRCA and peripheral private branches in normal, BBL, and cancer lesions in five FFPE multi-sampled premenopausal breast cancer patients (Supplementary Table 1), with P-values from the two-sided Mann–Whitney U test. Source Data
Extended Data Fig. 5
Extended Data Fig. 5. Life history of breast cancers in premenopausal patients.
a–d, Phylogenetic trees and the corresponding geographical maps of clones detected in cancer and non-cancer lesions in four premenopausal breast cancer patients who underwent total mastectomy (KU539 (a), KU873 (b), KU957 (c), and KU582 (d)). All the representations follow those in Fig. 2a. LG, low grade DCIS; IG, intermediate grade DCIS; HG, high grade DCIS; UPD, uniparental disomy. e, Number of clones which had acquired each driver mutation in peripheral branches after MRCA emerged. Source Data
Extended Data Fig. 6
Extended Data Fig. 6. Estimation of the timing of der(1;16) acquisition.
a–d, Schema of the simulation to estimate the timing of der(1;16) acquisition, that is, 1q gain timing (T1q_gain), in clones with one der(1;16) (a) and two der(1;16) derivatives (c), and the corresponding simulation results related to each case shown in Fig. 2a and Extended Data Fig. 5a–c (b,d) (Methods). e, Schematic diagram of clonal evolution in premenopausal der(1;16)(+) breast cancer cases is shown with a time course. The colours of each clone depict the histology. The black-coloured stars indicate multiple cancer founder clones.
Extended Data Fig. 7
Extended Data Fig. 7. Expansion of der(1;16)(+) clones in premenopausal cases in another set of samples.
a,b, Geographical maps of clones detected via FISH in the surgical specimens of two premenopausal der(1;16)(+) breast cancer patients who underwent lumpectomy (left: overview of the surgical specimens, right: split faces of the sliced specimens indicated by dotted lines in the overview images). Driver mutations and copy number alterations (*, focal changes) detected in cancer lesions via targeted capture sequencing are shown. Histological results are depicted by the colours inside the circles. Coloured bars in the overview images and colours around the circles in the split faces show the areas wherein der(1;16)(+) clones were detected using FISH.
Extended Data Fig. 8
Extended Data Fig. 8. Expansion of der(1;16)(+) clones in postmenopausal cases in another set of samples.
a–e, Phylogenetic trees (a–d) and corresponding geographical maps of clones (a–e) detected in the surgical specimens of five postmenopausal der(1;16)(+) breast cancer patients who underwent lumpectomy (middle: overview of the surgical specimens, right: split faces of the sliced specimens indicated by dotted lines in the overview images). All the representations follow those in Fig. 2a. †, cancer lesions in TMA125 (b) carried one der(1;16) derivative and another 1q gain, and the order of these alterations could not be determined; thus, timing of the first and second 1q gain was estimated; UPD, uniparental disomy. f, Landscape of driver mutations in der(1;16)(+) non-cancer and cancer lesions, including 64 WGS samples multi-sampled from nine cancer cases and three targeted sequencing samples from three cancer cases. Multiple samples obtained from a single tumour focus are enclosed in black dotted squares. Mutations enclosed in black bold squares represent shared mutations. Source Data
Extended Data Fig. 9
Extended Data Fig. 9. Clonal expansion in lobules without der(1;16).
a,b, Phylogenetic trees and the corresponding geographical maps of clones detected in multi-sampled lobules of two premenopausal breast cancer patients with a pathogenic BRCA2 variant (KU1195 (a)) and without pathogenic germline variants (KU1215 (b)). All the representations follow those in Fig. 4a. In the case of KU1215 (b), three der(1;16)(+) LCIS lesions (#16, #22, and #23) were detected unexpectedly; thus, additional sampling was performed in red-coloured tissue to investigate the correlation between der(1;16)(+) LCIS and cancers. LG, low grade DCIS. c, Geographical maps of clones detected with FISH using FFPE specimens in the case shown in b (KU1215). Coloured bars in the overview image and colours around the circles in split faces depict the clones to which samples belong. Circles numbered with black characters are samples analysed via WGS, whereas unnumbered circles show the lesions analysed only via FISH. d, Median VAF in histologically normal lobules carrying no somatic driver alterations in breast cancer patients with and without pathogenic germline variants, with P-values from the two-sided Mann–Whitney U test. Source Data
Extended Data Fig. 10
Extended Data Fig. 10. Features of der(1;16)(+) breast cancer in TCGA cohort.
a, Schema of re-analysis of TCGA breast cancer (BRCA) cohort (Methods). b, Representative copy number plots in der(1;16)(+) cancers analysed using CNACS. c, Distribution of PAM50 molecular subtypes in all cancers (n = 610), IDC (n = 424), and ILC (n = 119), with and without der(1;16), with P-values from two-sided Fisher’s exact test. d, Distribution of morphology, which was compared between der(1;16)(−) and der(1;16)(+) Luminal A cancers using two-sided Fisher’s exact test. e, Proportion of der(1;16)(+) cancer in each PAM50 molecular subtype, and IDC and ILC in all subtypes and Luminal A, respectively, with P-values from two-sided Fisher’s exact test. f,g, Distribution of age (f) and stage (g) in der(1;16)(−) and der(1;16)(+) Luminal A cancer cases, with P-values from two-sided Mann–Whitney U test and Fisher’s exact test, respectively. Box plots show the median, first and third quartiles, with whiskers that extend to the furthest value within a 1.5× interquartile range. h, Kaplan-Meier survival analysis of der(1;16)(−) and der(1;16)(+) Luminal A cancer cases with P-values from two-sided log-rank test. i, Landscape of driver mutations in der(1;16)(−) and der(1;16)(+) Luminal A cancers (n = 220 and 103, respectively). Frequency of each mutation is indicated on the right-hand side. j, Frequency of driver mutations among der(1;16)(−) and der(1;16)(+) cancers in Luminal A IDC (n = 188) and Luminal A ILC (n = 97), respectively. **, q<0.05; *, q<0.1 (from two-sided Fisher’s exact test with Benjamini–Hochberg adjustment). k, Ratio of average expression of genes on 1q in der(1;16)(+) Luminal A tumours (n = 103) to those in 1q-diploid Luminal A tumours (n = 77) was depicted on the top, and the ratio of genes on 16q in der(1;16)(+) Luminal A tumours (n = 51) to those in 16q-diploid Luminal A tumours (n = 83) was depicted on the bottom. Coloured dots indicate known oncogenes, tumour suppressor genes, or other genes on the NOTCH and WNT signalling pathways. Source Data

References

    1. Kakiuchi N, Ogawa S. Clonal expansion in non-cancer tissues. Nat. Rev. Cancer. 2021;21:239–256. doi: 10.1038/s41568-021-00335-3. - DOI - PubMed
    1. Yokoyama A, et al. Age-related remodelling of oesophageal epithelia by mutated cancer drivers. Nature. 2019;565:312–317. doi: 10.1038/s41586-018-0811-x. - DOI - PubMed
    1. Kakiuchi N, et al. Frequent mutations that converge on the NFKBIZ pathway in ulcerative colitis. Nature. 2020;577:260–265. doi: 10.1038/s41586-019-1856-1. - DOI - PubMed
    1. Lawson ARJ, et al. Extensive heterogeneity in somatic mutation and selection in the human bladder. Science. 2020;370:75–82. doi: 10.1126/science.aba8347. - DOI - PubMed
    1. Ng SWK, et al. Convergent somatic mutations in metabolism genes in chronic liver disease. Nature. 2021;598:473–478. doi: 10.1038/s41586-021-03974-6. - DOI - PubMed

Publication types

MeSH terms

Substances