. 2023 Aug;620(7974):600-606.
doi: 10.1038/s41586-023-06350-8. Epub 2023 Jul 26.

Extensive pedigrees reveal the social organization of a Neolithic community

Affiliations

Extensive pedigrees reveal the social organization of a Neolithic community

Maïté Rivollat et al. Nature. 2023 Aug.

Abstract

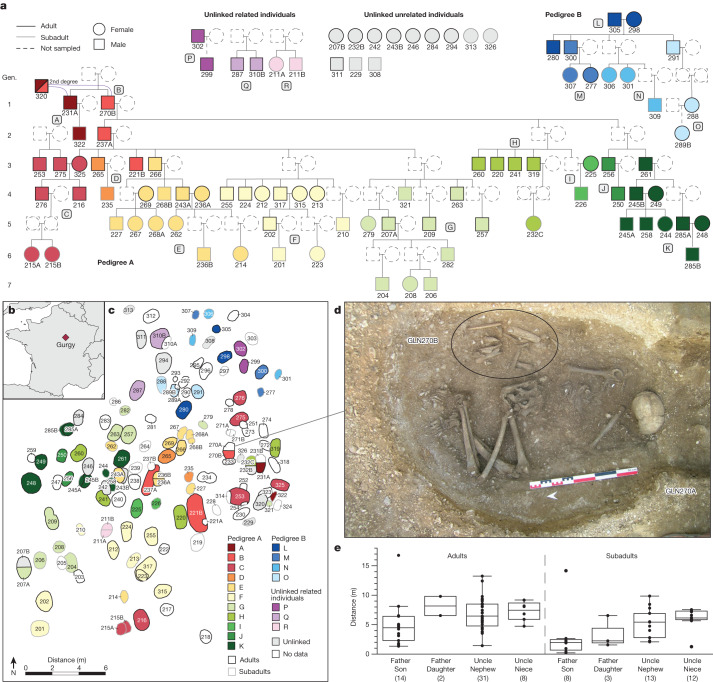
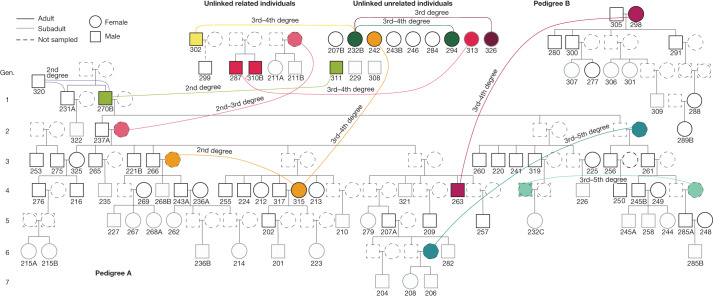
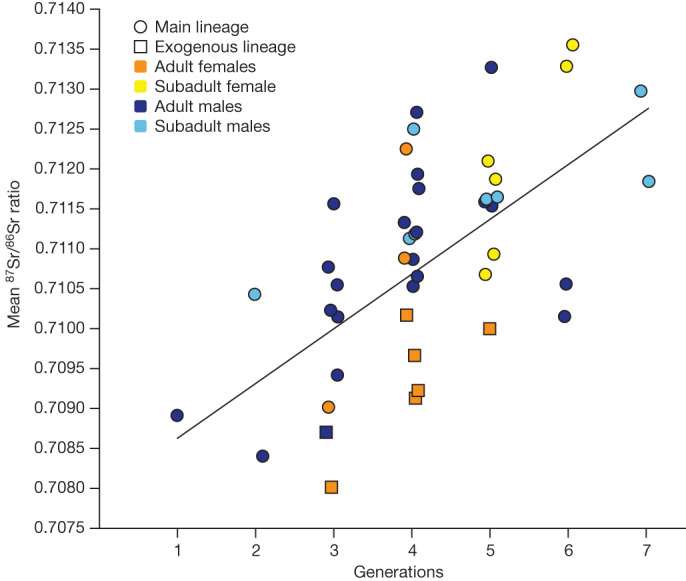
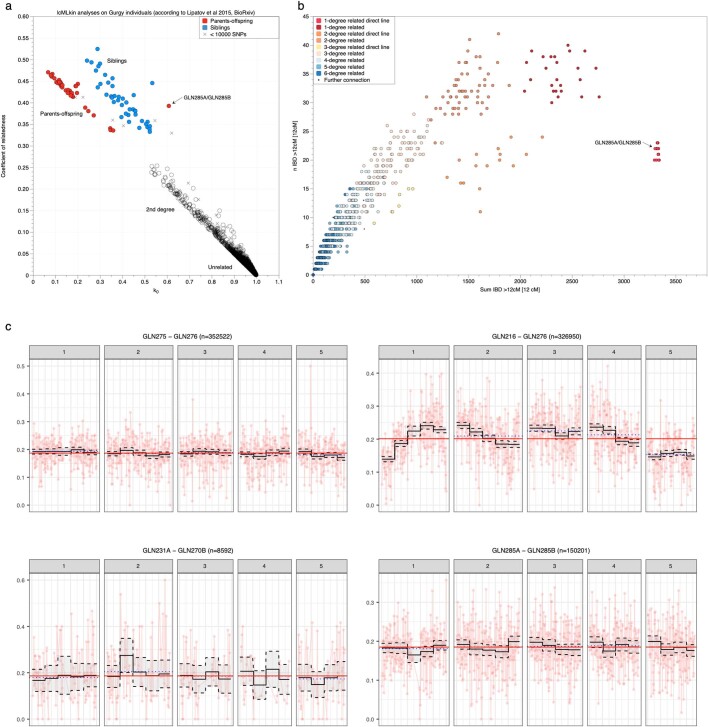
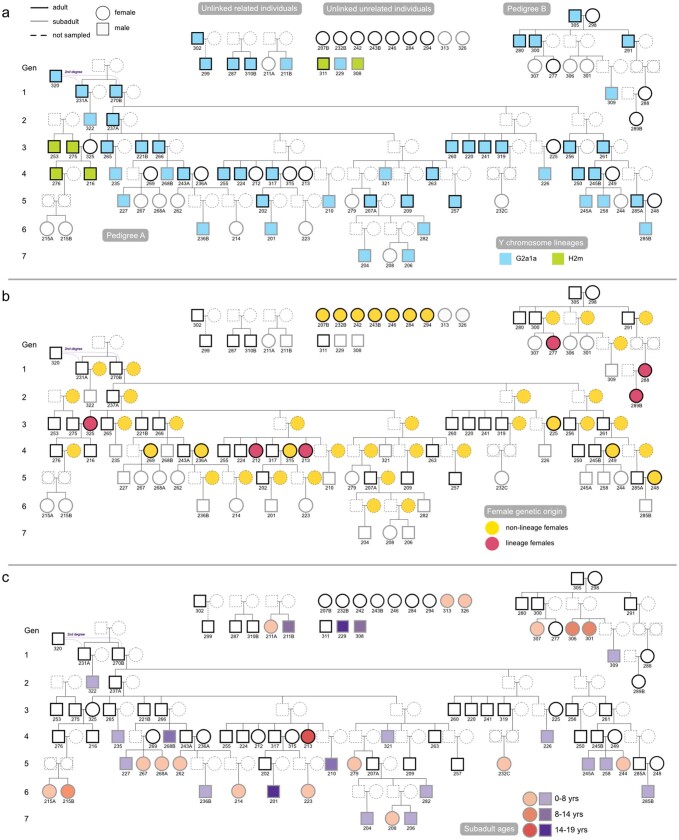
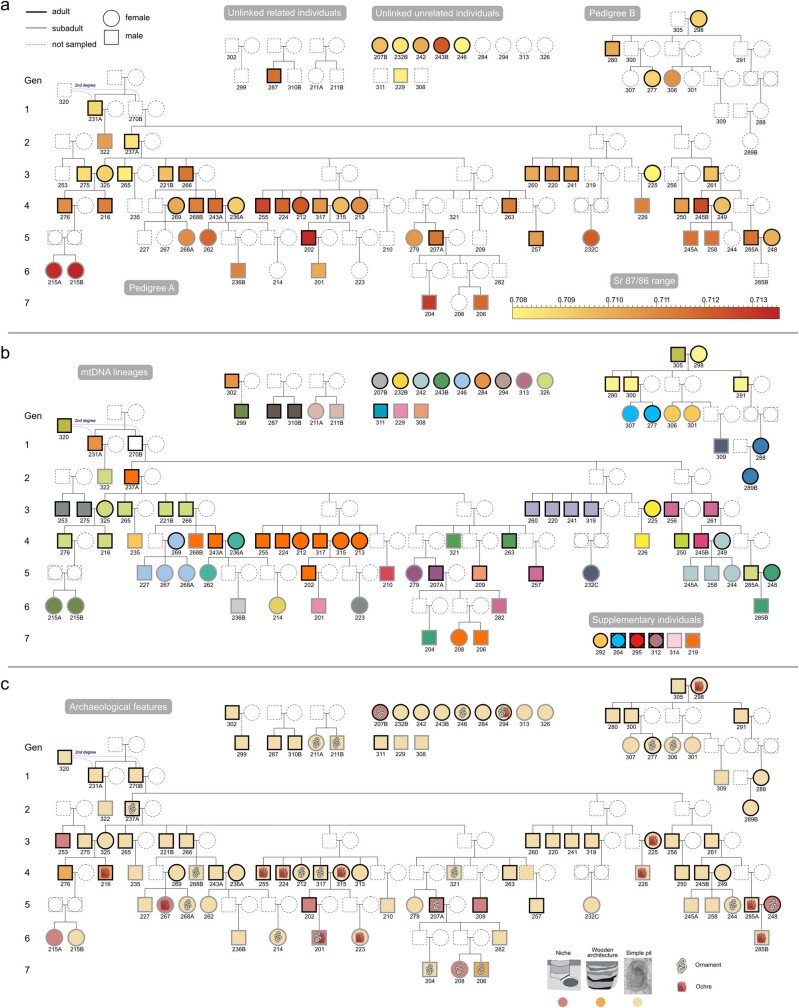
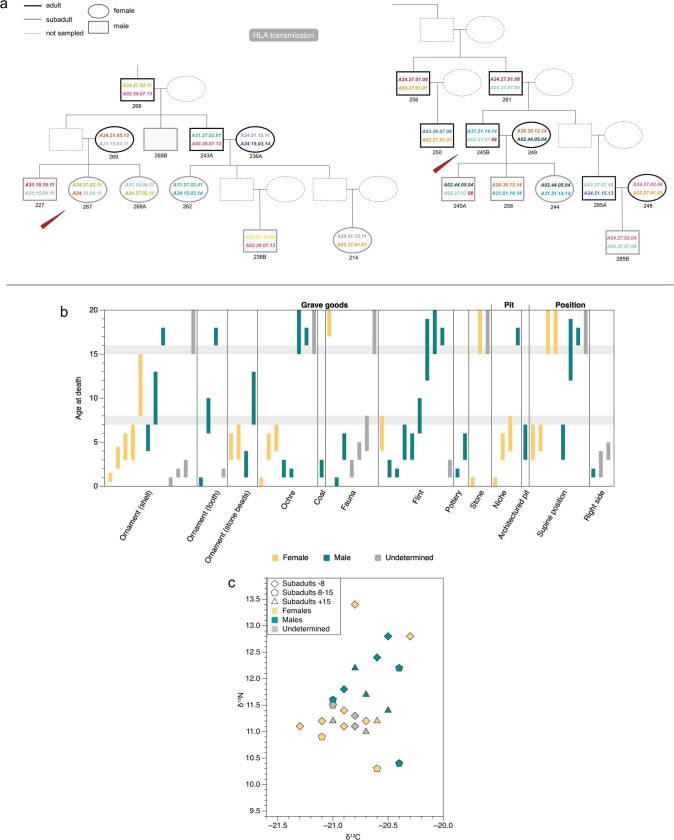
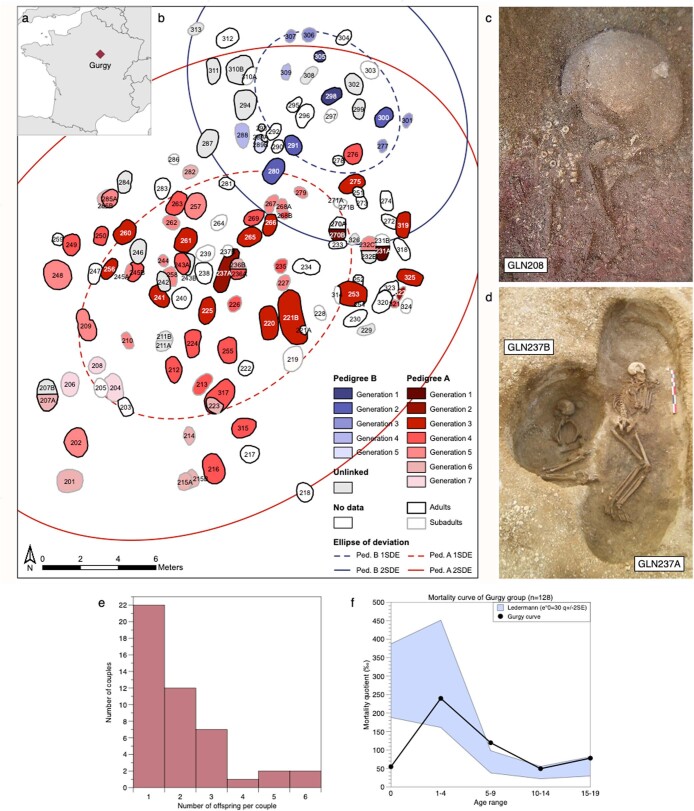
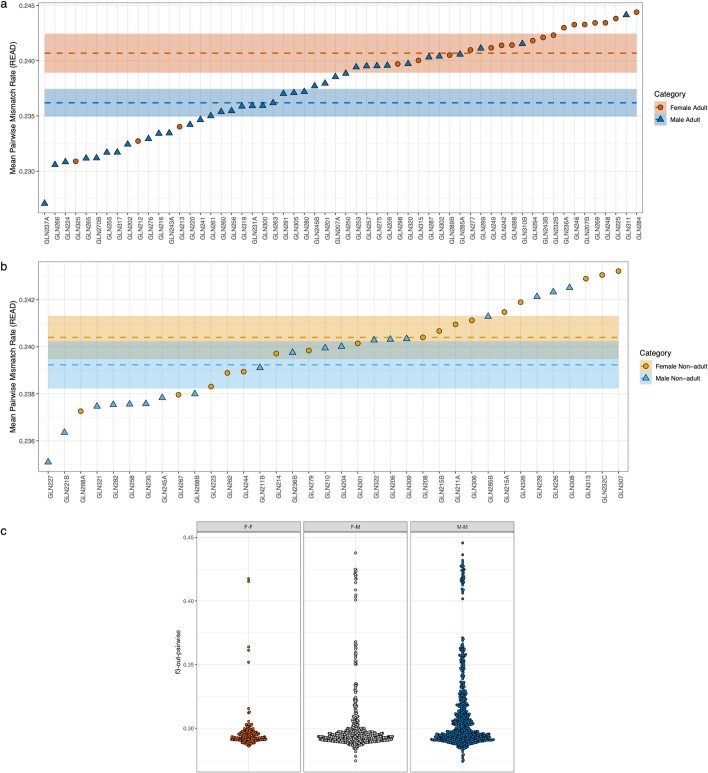
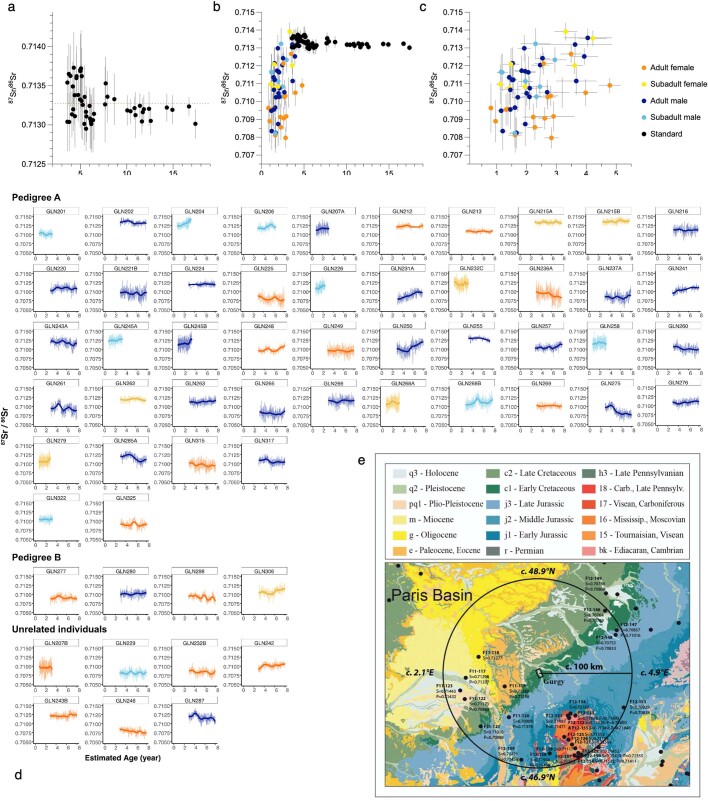
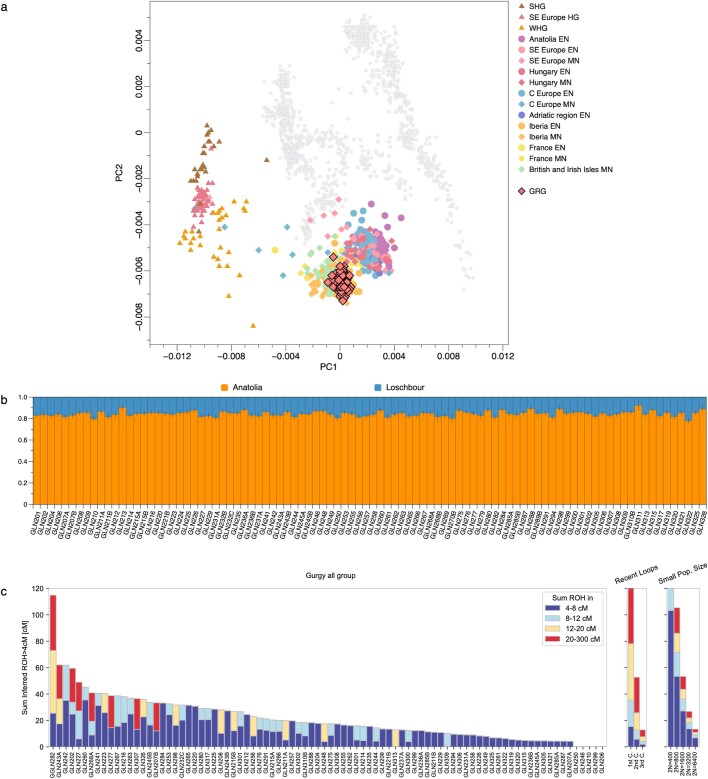
Social anthropology and ethnographic studies have described kinship systems and networks of contact and exchange in extant populations1-4. However, for prehistoric societies, these systems can be studied only indirectly from biological and cultural remains. Stable isotope data, sex and age at death can provide insights into the demographic structure of a burial community and identify local versus non-local childhood signatures, archaeogenetic data can reconstruct the biological relationships between individuals, which enables the reconstruction of pedigrees, and combined evidence informs on kinship practices and residence patterns in prehistoric societies. Here we report ancient DNA, strontium isotope and contextual data from more than 100 individuals from the site Gurgy 'les Noisats' (France), dated to the western European Neolithic around 4850-4500 BC. We find that this burial community was genetically connected by two main pedigrees, spanning seven generations, that were patrilocal and patrilineal, with evidence for female exogamy and exchange with genetically close neighbouring groups. The microdemographic structure of individuals linked and unlinked to the pedigrees reveals additional information about the social structure, living conditions and site occupation. The absence of half-siblings and the high number of adult full siblings suggest that there were stable health conditions and a supportive social network, facilitating high fertility and low mortality5. Age-structure differences and strontium isotope results by generation indicate that the site was used for just a few decades, providing new insights into shifting sedentary farming practices during the European Neolithic.


Conflict of interest statement

The authors declare no competing interests.

Figures

Fig. 1
Fig. 1. Genetic relatedness at Gurgy in light of the spatial layout and generational succession.
a, Reconstructed pedigrees of the Gurgy group coloured according to family lineages (lineages A–R, according to the colour scale in c). Gen., generation. b, The geographical location of the Gurgy ‘les Noisats’ site in present-day France. The map was created using the R packages maps (v.3.3.0) and mapdata (v.2.3.0). c, The site layout, representing the spatial distribution of family lineages coloured as in a. d, Photograph of female individual GLN270A (no genetic results) with the reburied remains of the main male ancestor GLN270B of pedigree A. e, The spatial distances of father–offspring and uncle–nephew/niece pairs (the number of pairs is given in parentheses; Supplementary Table 20). Fathers and subadult sons are, on average, buried significantly closer to each other than any other pairs (Supplementary Note 12). The centre line shows the median, the box limits delineate the interquartile range and the whiskers extend to the maximum and minimum values, excluding the outliers.
Fig. 2
Fig. 2. IBD links.
Additional biological relatedness up to the fifth degree between individuals within and between the previously reconstructed pedigrees as revealed by the analysis of shared IBD blocks and f3 statistics (Supplementary Tables 10 and 12 and Supplementary Notes 3 and 5).
Fig. 3
Fig. 3. Strontium data of pedigree A.
Mean 87Sr/86Sr ratio per age and sex cohort across generations. A significant difference between sex was observed per generation (two-sided analysis of variance, P = 0.01474; Supplementary Note 11).
Extended Data Fig. 1
Extended Data Fig. 1. Biological relatedness analysis of the Gurgy individuals.
a, lcMLkin estimates of k0 and the coefficient of relatedness r. Clusters of different first-degree related individuals emerge when plotting these measures of relatedness against each other. Colours are given a posteriori according to the reconstructed trees. One inconsistency can be observed with the red point (parent-offspring relationship) plotting in the sibling cluster in blue, representing the pair GLN285A and GLN285B (Supplementary Note 2 and 3, Supplementary Table 9). b, Identity-by-descent (IBD) sharing analysis. Pairs of individuals plotted according to shared long blocks of IBD (>12cM), clustering by degrees of relatedness. Direct and indirect lineages form two different clines, indicating different numbers of meiosis events. From the fourth degree of relatedness, these clusters overlap (Supplementary Note 3, Supplementary Table 10). The pair GLN285A and GLN285B falls in the parent-offspring cluster. c, PMR-window plots. Pairwise-mismatch Rates (PMR) plotted along the chromosomes 1 to 5 in windows of 1 Megabase width. The number of overlapping SNPs is given in brackets. For example, the windowed estimate of PMR (dark line) is stable around the average PMR (red line) for the parent-offspring relationship GLN275-GLN276, whereas it is more variable for the full sibling relationship GLN216-GLN276. The pairs GLN231A-GLN270B and GLN285A-GLN285B are discussed in Supplementary Note 2.
Extended Data Fig. 2
Extended Data Fig. 2. Y chromosome haplogroups, exogenous females, and age at death of subadults visualized on the Gurgy pedigrees.
a, Y chromosome haplogroup distribution along the lineages. Male individuals of Gurgy carry only two Y haplogroups: G2a1a (Z38302) and H2m (P96), which illustrates the strong patrilineal pattern of the pedigrees (Supplementary Table 7). b, Exogenous females, i.e., all females with no parents buried at the site, including unsampled females, are highlighted in yellow. c, Distribution of age at death classes of subadult across the pedigrees (Supplementary Table 1).
Extended Data Fig. 3
Extended Data Fig. 3. Strontium ratio, mitochondrial haplogroup diversity, and archaeological features visualized on the Gurgy pedigrees.
a, Strontium isotope ratio. The first generations and exogenous females carry lower values, which indicate non-local origins (Supplementary Note 11, Supplementary Table 23). b, Mitochondrial diversity. Each colour represents a different mitochondrial haplogroup. (Supplementary Note 3, Supplementary Table 5). c, Visualization of select archaeological features on the reconstructed pedigrees. The different types of pits, individuals buried with ornaments and ochre are represented. No clustering according to biological relatedness is visible (Supplementary Table 1).
Extended Data Fig. 4
Extended Data Fig. 4. Heatmaps of biological relatedness.
a, Heatmap showing pairwise outgroup f3 statistics between all individuals from Gurgy (n = 94). Lighter colours indicate higher shared genetic affinity between individuals. Each sub-lineage forms a cluster, and the two bigger pedigrees are also visible (Supplementary Note 5, Supplementary Table 12). b, Heatmap showing pairwise outgroup f3 statistics between all exogenous female individuals (n = 16). Three pairs show distant relatedness (GLN232B-GLN294, GLN288-GLN298, GLN242-GLN315), but are otherwise unrelated (Supplementary Note 5, Supplementary Table 12). c, Heatmap showing pairwise IBD sharing between individuals with more than 500,000 SNPs (n = 72). Different clusters of lighter colour reveal the extra-links between the different branches and pedigrees (Supplementary Notes 3 and 5, Supplementary Table 10). d, Heatmap showing pairwise IBD sharing between all exogenous female individuals with more than 500,000 SNPs (n = 12). The absence of relatedness between the exogenous female individuals is confirmed by the deeper resolution provided by IBD sharing analysis, with a single pair of females related in the third degree, as detected by the f3 statistics (Supplementary Notes 3 and 5, Supplementary Table 10).
Extended Data Fig. 5
Extended Data Fig. 5. HLA recombination, and dietary isotopes of the Gurgy individuals.
a, Zoom in on two events of recombination of HLA haplotypes, one of class I in the individual GLN267, where both haplotypes carried by the mother recombined, and one in class II in the individual GLN245B where both haplotypes carried by the father recombined and transmitted to the son GLN245A (Supplementary Table 14). b, Distribution of specific archaeological features according to the age at death of all subadult individuals (irrespective of DNA preservation) and their sex. Each bar represents one individual for each feature, that is some individuals are represented several times. Grey lines represent the two observed thresholds before and after individuals tend to be buried with grave goods or with specific archaeological features. c, Stable isotope data (carbon and nitrogen) (Rey et al. 2019), plotted with the genetic sexing of subadult individuals provided by this study. Two significant clusters can be observed between male and female individuals (two-sided permutation test, p = 0.01019; Supplementary Note 14.1). The high values of δ15N of three outlier individuals (GLN232C, GLN326, GLN245A, all younger than 6 years of age) might be a signal for breastfeeding or weaning time.
Extended Data Fig. 6
Extended Data Fig. 6. Archaeological features, spatial and demographic distribution of Gurgy individuals.
a, Geographical location of the Gurgy ‘les Noisats’ site in present-day France. Map created with R packages maps (v3.3.0; Becker et al. 2018) and mapdata (v2.3.0; Becker et al. 2018). b, Spatial layout of the site with burials visualized per generation. For both pedigrees, the expansion of the graveyard followed in the direction of North-East to South-West. Ellipses indicate one and two standard deviations (Supplementary Note 12). c, Picture of GLN208 buried with limestone beads. d, Picture of GLN237A and GLN237B. GLN237A has one of the two largest graves of the site. e, Histogram of the number of offspring per couple. Minimum estimation of number of offspring per couple necessary to explain the pedigrees. f, Comparison of the mortality curve of Gurgy individuals calculated on subadults (Supplementary Table 19) with an expected wide pattern of archaic mortality (Ledermann 1969). We notice a deficit of infants among the Gurgy cohort (Supplementary Note 14.2, Supplementary Table 19).
Extended Data Fig. 7
Extended Data Fig. 7. Trends of relatedness between female-male cohorts at Gurgy.
a, Average of the pairwise P0 values, obtained via READ, for all adult individuals. The lower the P0 value, the more related the individual is to the group, on average. Dashed lines show the average P0 values for each sex and 95% CIs are given as coloured bands. A two-sided Wilcoxon test shows that male individuals are significantly (P = 1.375e-05) more related to the group than female individuals (Supplementary Note 2, Supplementary Table 8). b, Average P0 for all subadult male and female individuals are not significantly differentially related to the group (two-sided Wilcoxon, p = 0.1067) (Supplementary Note 2, Supplementary Table 8). c, f3-outgroup statistics of the form f3(female, female; Mbuti), f3(female, male; Mbuti), and f3(male, male; Mbuti) for all adults. The deeper relatedness among pairs, whenever they involve at least one male individual, is, on average, higher than among female individuals (first- and second-degree related pairs are excluded from the calculation; Supplementary Table 12).
Extended Data Fig. 8
Extended Data Fig. 8. Results of radiogenic Sr isotope analyses.
a, Distribution of the standards (n = 52) average 88Sr and 87Sr/86Sr values and SD used to bracket the individuals 87Sr/86Sr values. The accepted 87Sr/86Sr value of 0.71310 for SRM-1400 is indicated by the dashed red line (Supplementary Table 22). b, Distribution of the standards (n = 52) and samples (n = 57) average 88Sr and 87Sr/86Sr values and SD (Supplementary Table 22). c, Distribution of the samples (n = 57) average 88Sr and 87Sr/86Sr values and SD (Supplementary Table 22). d, 87Sr/86Sr profiles of all individuals analysed in this study (n = 57). Each curve is plotted as a function of the reconstructed dental age, according to the sampled tooth (M1 or M2; https://doi.org/10.5281/zenodo.7224898). e, Geological map of the area surrounding Gurgy, as reconstructed by BRGM (https://infoterre.brgm.fr), with environmental 87Sr/86Sr ratios from the IRHUM database (Willmes et al. 2013). ‘P’ stands for ‘plants’ and ‘S’ for ‘soil’.
Extended Data Fig. 9
Extended Data Fig. 9. Population genetic analyses of Gurgy individuals.
a, Principal component analysis. Published ancient (symbols with no outline) and Gurgy (black outlined symbols) individuals projected onto 777 present-day west Eurasians (grey circles; Supplementary Note 10). b, Genetic ancestry proportions. Results of qpAdm (MODEL 1) ancestry modelling of Loschbour hunter-gatherer and Anatolia_Neolithic ancestry for all Gurgy individuals (Supplementary Note 10). c, Runs of homozygosity. Selected individuals with more than 300,000 SNPs on the 1.2 million SNP panel (n = 86) and simulated data expected for inbred individuals from parents related at the first- to third-degree, and for individuals from small populations with different sizes. Individual GLN282 shows an inbreeding signal similar to a first-cousin union, but both carried ROH are 20–22 cM long, therefore this individual is more plausibly the offspring of second or third cousins (Supplementary Note 4, Supplementary Table 1).
Extended Data Fig. 10
Extended Data Fig. 10. Bayesian modelling of radiocarbon dates.
a, Radiocarbon dates available for Gurgy, calibrated with Intcal20.14c. b, Bayesian modelling with ChronoModel 2.0.18. Model with constrained relationships inferred from the pedigrees (Supplementary Note 13, Supplementary Table 25). F = Pedigree and G = Generation. c, Model with constrained relationships inferred from archaeology (Supplementary Note 13, Supplementary Table 25). d, Modelled intervals for each run set at 30, 60, 80 and 120 years for Pedigrees A and B, and for the whole group (111,000 iterations for 3 independent chains per run, Supplementary Note 13, Supplementary Table 25).

References

    1. Fox, R. Kinship and Marriage: An Anthropological Perspective (Cambridge Univ. Press, 1983).
    1. Morgan, L. H. Ancient Society: Or, Researches in the Lines of Human progress from Savagery, Through Barbarism to Civilization (C. H. Kerr, 1877).
    1. Lévi-Strauss, C. The Elementary Structures of Kinship (Beacon Press, 1971).
    1. Schneider, D. M. A Critique of the Study of Kinship (Univ. Michigan Press, 1984).
    1. Bocquet-Appel J-P. Paleoanthropological traces of a Neolithic demographic transition. Curr. Anthropol. 2002;43:637–650. doi: 10.1086/342429. - DOI

Publication types

Substances