. 2023 Jul 26;13(1):12091.
doi: 10.1038/s41598-023-39259-3.

Time interval between breast cancer diagnosis and surgery is associated with disease outcome

Affiliations

Time interval between breast cancer diagnosis and surgery is associated with disease outcome

Siji Zhu et al. Sci Rep. .

Abstract

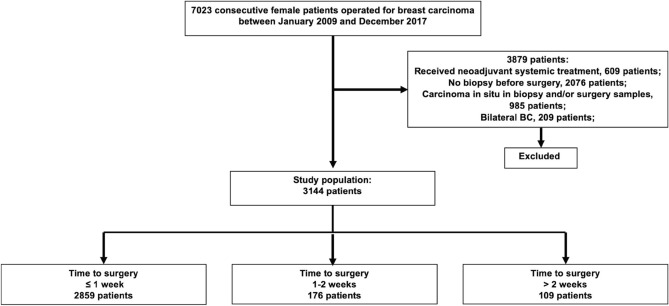
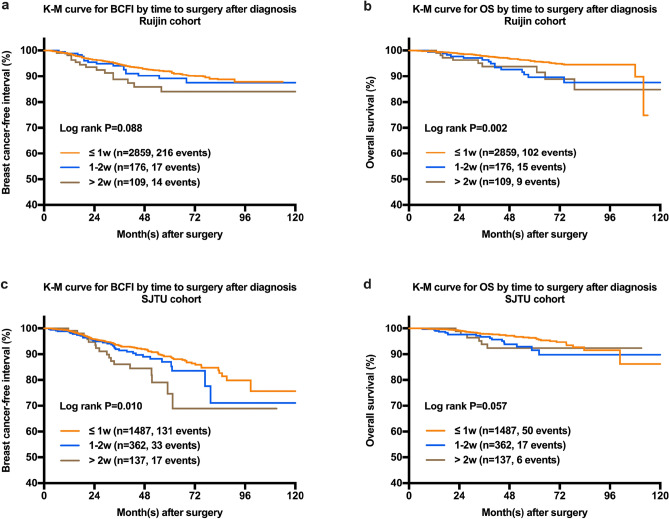
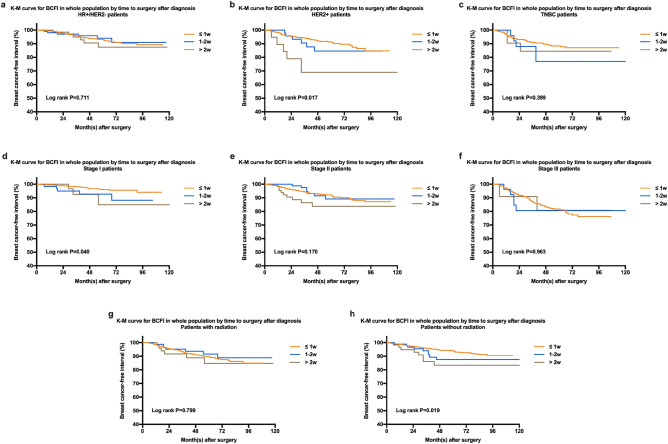
Time interval between breast cancer (BC) diagnosis and surgery is of concern to patients and clinicians, but its impact on survival remains unclear. We identified 5130 BC patients receiving surgery between 2009 and 2017 from the Shanghai Jiaotong University Breast Cancer Database (SJTU-BCDB), and divided as Ruijin cohort and SJTU cohort. All participants were divided into three groups according to the interval between diagnosis and surgery: ≤ 1 week, 1-2 weeks, and > 2 weeks. Among 3144 patients of Ruijin cohort, the estimated 5-year breast cancer-free interval (BCFI) rates for the ≤ 1 week, 1-2 weeks and > 2 weeks groups were 91.8%, 87.5%, and 84.0% (P = 0.088), and the estimated 5-year overall survival (OS) rates were 95.6%, 89.6%, and 91.5% (P = 0.002). Multivariate analysis showed that patients with a TTS > 2 weeks had significantly lower BCFI (HR = 1.80, 95%CI 1.05-3.11, P = 0.034) and OS (HR = 2.07, 95% CI 1.04-4.13, P = 0.038) rates than patients with a TTS ≤ 1 week. Among 5130 patients when combining Ruijin cohort with SJTU cohort, the estimated 5-year BCFI rates for the ≤ 1 week, 1-2 weeks, and > 2 weeks groups were 91.0%, 87.9%, and 78.9%, and the estimated 5-year OS rates for the ≤ 1 week, 1-2 weeks, and > 2 weeks groups were 95.8%, 90.6%, and 91.5%, both with a significantly p value < 0.001. Our findings demonstrated the prolonged time to surgery (more than 2 weeks) after BC diagnosis was associated with poor disease outcomes, suggesting that efforts to early initiate treatment after diagnosis need to be pursued where possible to improve survival.


Conflict of interest statement

The authors declare no competing interests.

Figures

Figure 1
Figure 1
Identification of study population, the Ruijin cohort.
Figure 2
Figure 2
Kaplan–Meier curves of BCFI and OS in whole population by time to surgery after diagnosis. (a) The estimated 5-year BCFI rates in the Ruijin cohort for the ≤ 1w, 1-2w and > 2w groups were 91.8%, 89.2%, and 84.0%, respectively (P = 0.088). The P value for the ≤ 1w vs. 1-2w group was 0.408, for the 1-2w vs. > 2w group was 0.300, for the ≤ 1w vs. > 2w group was 0.036. (b) The estimated 5-year OS rates in the Ruijin cohort for the ≤ 1w, 1-2w and > 2w groups were 95.6%, 89.6% and 91.5%, respectively (P = 0.002). The P value for the ≤ 1w vs. 1-2w group was 0.004, for the 1-2w vs. > 2w group was 0.917, for the ≤ 1w vs. > 2w group was 0.021. (c) The estimated 5-year BCFI rates in the SJTU cohort for the ≤ 1w, 1-2w and > 2w groups were 89.2%, 87.0%, and 74.7%, respectively (P = 0.001). The P value for the ≤ 1w vs. 1-2w group was 0.174, for the 1-2w vs. > 2w group was 0.128, for the ≤ 1w vs. > 2w group was 0.004. (d) The estimated 5-year OS rates in the SJTU cohort for the ≤ 1w, 1-2w and > 2w groups were 96.4%, 91.5% and 92.4%, respectively (P = 0.057). The P value for the ≤ 1w vs. 1-2w group was 0.034, for the 1-2w vs. > 2w group was 0.901, for the ≤ 1w vs. > 2w group was 0.131.
Figure 3
Figure 3
Kaplan–Meier curves of BCFI in different subgroup by time to surgery after diagnosis, the Ruijin cohort. (a–c) The estimated 5-year BCFI rates for HR + /HER2 −, HER2 + and TNBC patients by time to surgery after diagnosis. (d–f) The estimated 5-year BCFI rates for the Stage I, II and III groups by time to surgery after diagnosis. (g,h) The estimated 5-year BCFI rates for patients with or without radiation by time to surgery after diagnosis.

References

    1. Neal RD, et al. Is increased time to diagnosis and treatment in symptomatic cancer associated with poorer outcomes? Systematic review. Br. J. Cancer. 2015;112(Suppl 1):S92–S107. doi: 10.1038/bjc.2015.48. - DOI - PMC - PubMed
    1. Bleyer A, Welch HG. Effect of three decades of screening mammography on breast-cancer incidence. N. Engl. J. Med. 2012;367(21):1998–2005. doi: 10.1056/NEJMoa1206809. - DOI - PubMed
    1. Bardell T, Belliveau P, Kong W, Mackillop WJ. Waiting times for cancer surgery in Ontario: 1984–2000. Clin. Oncol. 2006;18:401–409. doi: 10.1016/j.clon.2006.02.012. - DOI - PubMed
    1. Mayo NE, Scott SC, Shen N, Hanley J, Goldberg MS, MacDonald N. Waiting time for breast cancer surgery in Quebec. CMAJ. 2001;164:1133–1138. - PMC - PubMed
    1. Fan L, et al. Breast cancer in China. Lancet Oncol. 2014;15(7):e279–e289. doi: 10.1016/S1470-2045(13)70567-9. - DOI - PubMed

Publication types