Review
. 2023 Sep;18(9):2625-2641.
doi: 10.1038/s41596-023-00853-4. Epub 2023 Jul 26.

Tutorial: a statistical genetics guide to identifying HLA alleles driving complex disease

Affiliations
Review

Tutorial: a statistical genetics guide to identifying HLA alleles driving complex disease

Saori Sakaue et al. Nat Protoc. 2023 Sep.

Abstract

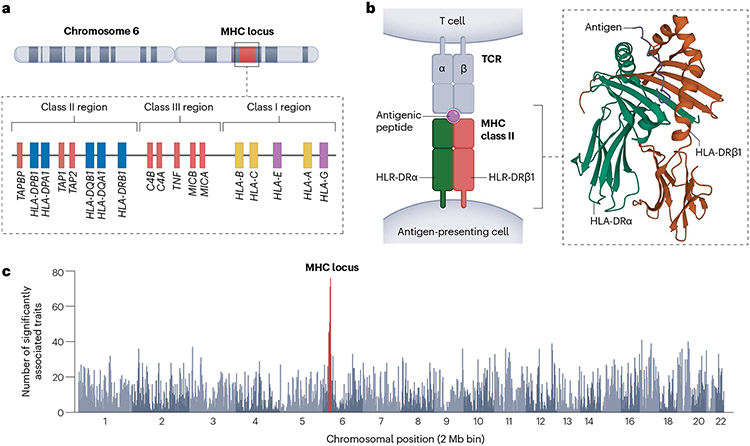
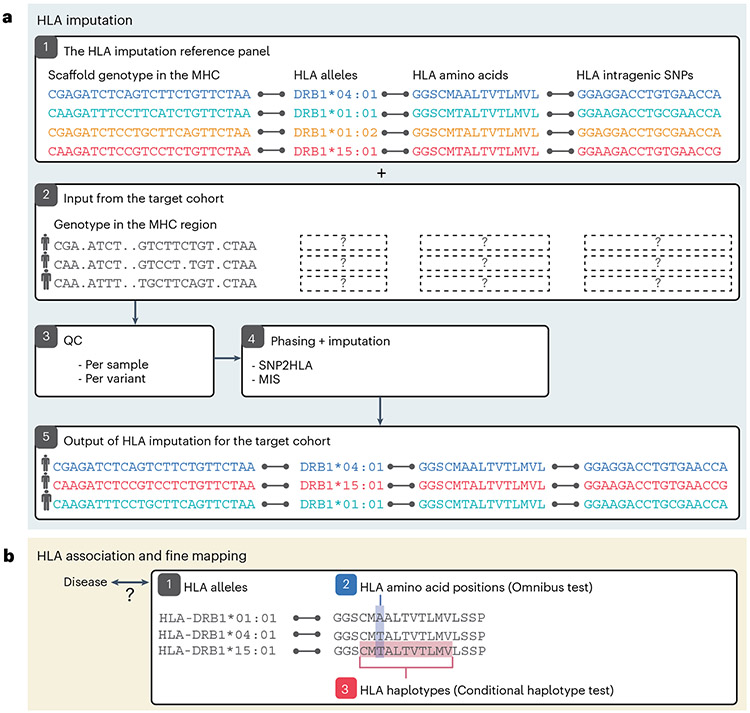
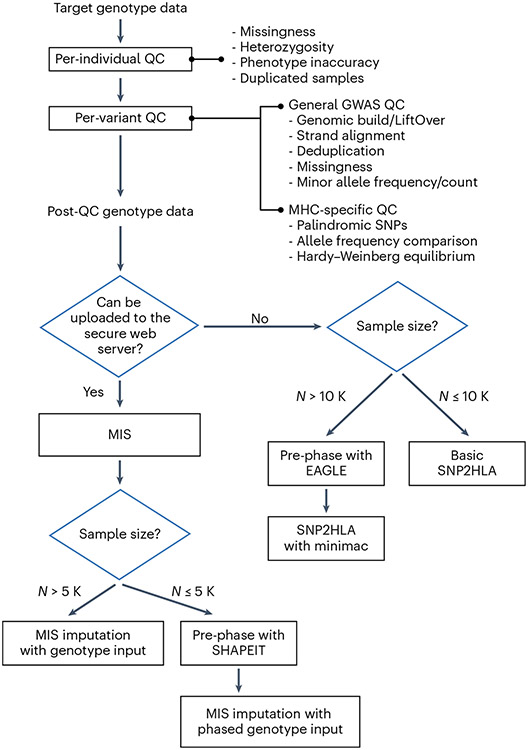
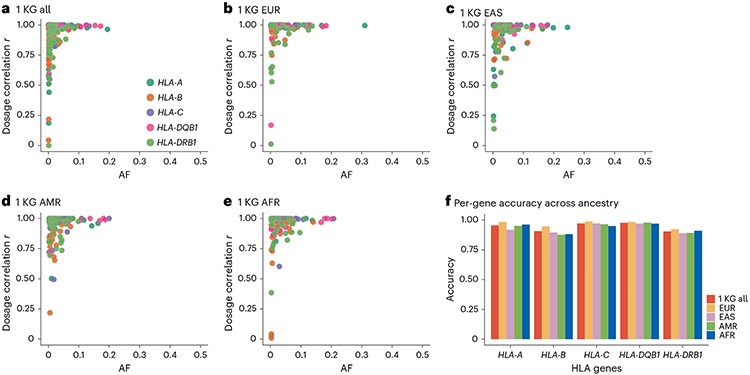
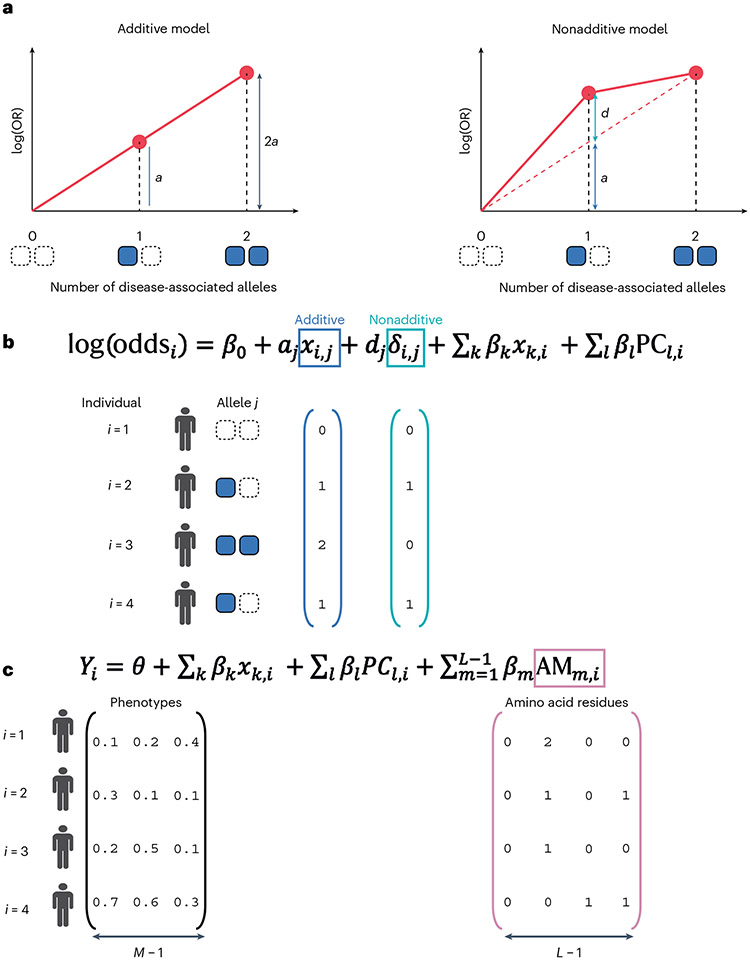
The human leukocyte antigen (HLA) locus is associated with more complex diseases than any other locus in the human genome. In many diseases, HLA explains more heritability than all other known loci combined. In silico HLA imputation methods enable rapid and accurate estimation of HLA alleles in the millions of individuals that are already genotyped on microarrays. HLA imputation has been used to define causal variation in autoimmune diseases, such as type I diabetes, and in human immunodeficiency virus infection control. However, there are few guidelines on performing HLA imputation, association testing, and fine mapping. Here, we present a comprehensive tutorial to impute HLA alleles from genotype data. We provide detailed guidance on performing standard quality control measures for input genotyping data and describe options to impute HLA alleles and amino acids either locally or using the web-based Michigan Imputation Server, which hosts a multi-ancestry HLA imputation reference panel. We also offer best practice recommendations to conduct association tests to define the alleles, amino acids, and haplotypes that affect human traits. Along with the pipeline, we provide a step-by-step online guide with scripts and available software ( https://github.com/immunogenomics/HLA_analyses_tutorial ). This tutorial will be broadly applicable to large-scale genotyping data and will contribute to defining the role of HLA in human diseases across global populations.


Figures

Extended Data Fig.1 ∣
Extended Data Fig.1 ∣. The linkage disequilibrium (LD) patterns across the extended MHC region.
A heatmap of LD r2 for pairwise variants across the extended MHC region. We used biallelic markers in our HLA reference panel within European populations and calculated LD r2 values for exhaustive pairs of these variants. The variants are ordered (both on x-axis and y-axis) and annotated by HLA gene names (on x-axis) based on their genomic coordinates on chromosome 6. The bottom plot shows the detailed LD pattern in the class II region.
Extended Data Fig.2 ∣
Extended Data Fig.2 ∣. Schematic illustration of method used to construct scaffold variants within multi-ancestry HLA reference panel.
We extracted SNP variants within MHC region in 1000 Genomes Project (1KG) samples. We only retained variants that were included in major genotyping arrays (Illumina Multi-Ethnic Genotyping Array, Global Screening Array, OmniExpressExome, and Human Core Exome), colored in teal. We then quality controlled each of the participating cohorts’ MHC SNPs separately, retained overlapping variants with selected SNPs in 1KG, and cross-imputed each cohorťs missing variants by using 1KG genotypes. We finally concatenate all cohorts together to construct scaffold variants for multi-ancestry reference panel.
Extended Data Fig.3 ∣
Extended Data Fig.3 ∣. Michigan Imputation Server.
Example usage of Michigan Imputation Server for HLA imputation at https://imputationserver.sph.umich.edu/index.html.
Extended Data Fig.4 ∣
Extended Data Fig.4 ∣. The runtime benchmark for HLA imputation using different platforms.
a. For SNP2HLA, we used BEAGLE4 for phasing and imputation algorithm (Luo et al. Nat Genet. 2021) with using 10 CPUs. For Minmac4, we used SHAPEIT2 as phasing algorithm with samples <10,000 and EAGLE2 as phasing algorithm with samples > 5,000 as we described in the manuscript both with using 10 CPUs. b. For Michigan Imputation Server, we uploaded the unphased genotype data and standard imputation pipeline was performed with default setting (with 1CPU).
Fig.1 ∣
Fig.1 ∣. Location and structure of HLA genes on human chromosome 6 and their associations with human traits.
a, A schematic representation of the human MHC locus highlighting the three main classes of the region, and the genes within them. The classical class I HLA genes are shown in yellow, the classical class II HLA genes in blue, the nonclassical HLA genes in purple and the genes other than the HLA genes within the MHC region in red. b, Presentation of an antigenic peptide by an antigen-presenting cell to a T cell through interaction between an MHC class II molecule and a TCR. The inset shows the protein structure of the MHC class II complex composed of HLA-DRA and DRB1 bound to an antigenic peptide (PDB ID: 3L6F). c, The number of traits associated with any variants within a 2 Mb genomic window with P < 5 × 10⁻⁸ among the 198 diseases and biomarkers in the UK Biobank and FinnGen. The MHC region is highlighted in red. The GWAS data for 198 diseases and biomarkers were obtained and analyzed as previously described.
Fig.2 ∣
Fig.2 ∣. Overview of HLA imputation, association and fine mapping.
a, A toy example illustrating the workflow for HLA imputation. The process begins with (1) either using an existing HLA imputation reference panel or creating a custom one, (2) collecting the input genotype in the MHC region from the target cohort without HLA types, (3) performing QC of the target genotype, (4) genotype phasing and imputation to predict the untyped HLA alleles in the target cohort (locally using the SNP2HLA software or online using the MIS), and results in (5) predicted HLA alleles in the target cohort. b, Statistical methods to investigate and fine-map association of (1) individual HLA alleles, (2) amino acid positions comprising multiple residues (highlighted in blue) and (3) their haplotypes (highlighted in red) with a trait of interest. See Fig. 3 for an overview of HLA allele nomenclature and structure.
Fig.3 ∣
Fig.3 ∣. Nomenclature, structure and encoding of HLA alleles.
a, The nomenclature of HLA alleles consists of four fields, with each field corresponding to the types and consequences of nucleotide variations. b, (Top) The amino acid sequences defining each of three example HLA-DRB1 alleles. The amino acids colored in red indicate the positions where they have variations among the alleles. The numbers (−25 and −24) at the bottom indicate the relative position of those amino acids within a coding region of HLA-DRB1. The negative positions indicate amino acids within a signal peptide, which is not part of the HLA protein presented on a cell surface. (Bottom) A procedure to code each of the HLA alleles and amino acid polymorphisms as binary markers: 1 if that marker is present within a haplotype and 0 otherwise. Each of the residues is coded separately for a given amino acid position in the corresponding HLA protein.
Fig.4 ∣
Fig.4 ∣. A flow chart of suggested analytical steps for genotype QC and HLA imputation.
A best-practice guideline to impute HLA alleles by using SNP2HLA algorithm, depending on the characteristics of the target genotype data.
Fig.5 ∣
Fig.5 ∣. HLA Imputation quality in MIS.
ae. Dosage correlation r (y axis) between the MIS imputed dosage and true genotypes of all two-field alleles in 1 KG samples as a function of AF (x axis), colored by HLA gene, for all 1 KG individuals (a) or per ancestry (be). f, The accuracy (concordance) of the imputed dosage of all two-field alleles in 1 KG samples in the MIS and the true genotype of those per HLA gene and per ancestry. The accuracy metric was calculated as previously described. EUR, Europeans; EAS, East Asians; AMR, admixed Americans; AFR, Africans.
Fig.6 ∣
Fig.6 ∣. Grouping of two-field alleles using the conditional haplotype test.
a,b, An example illustration of the conditional haplotype test for the HLA-DRB1 gene. In the first round of conditional haplotype test, (a), we group all two-field alleles (32 alleles in total) into six groups on the basis of the amino acid residues at position +11 and ask whether those groups significantly explain the disease risk by using the omnibus test. In the second round of conditional haplotype test (b; position +71 as an example), we group the two-field alleles into ten groups on the basis of the amino acid residues at positions +11 and +71. Then, we ask whether the full model with those ten groups explains the disease risk better than the reduced model with the six groups that we defined in the first round by the delta deviance using an F-test.
Fig.7 ∣
Fig.7 ∣. Nonadditive test and multitrait analysis.
a, Schematic illustrations of the additive and nonadditive models using the log odds ratio (log(OR)) according to the dosage of the genotype of interest. a denotes the purely additive effect by having one copy of the disease or trait-associated allele, and d denotes any departure from additivity for a heterozygous genotype. b, A logistic regression model to assess both the additive and nonadditive effect of the allele j (see main text for details). c, Multitrait analysis using a multiple linear regression model to test the association between the multidimensional phenotype Y and the amino acid polymorphism.

References

    1. Trowsdale J & Knight JC Major histocompatibility complex genomics and human disease. Ann. Rev. Genomics Hum. Genet 14, 301–323 (2013). - PMC - PubMed
    1. Amiel J. in Histocompatibility Testing (ed. Teraski PI) 79–81 (Munksgaard, 1967).
    1. Murphy K & Weaver C Janeway’s immunology. America 1–277 (2017).
    1. Dendrou CA, Petersen J, Rossjohn J & Fugger L HLA variation and disease. Nat. Rev. Immunol 18, 325–339 (2018). - PubMed
    1. Murphy K Kenneth M & Weaver C Janeway’s Immunobiology (Garland Science, 2016).

Publication types