. 2023 Jul 26;6(1):782.
doi: 10.1038/s42003-023-05099-0.

Evolutionary modeling suggests that addictions may be driven by competition-induced microbiome dysbiosis

Affiliations

Evolutionary modeling suggests that addictions may be driven by competition-induced microbiome dysbiosis

Ohad Lewin-Epstein et al. Commun Biol. .

Abstract

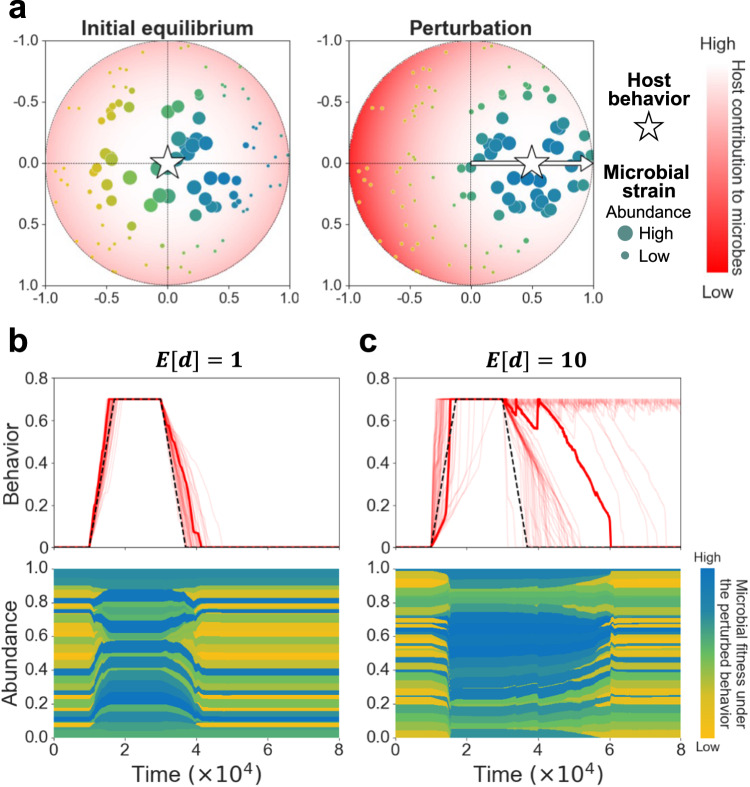
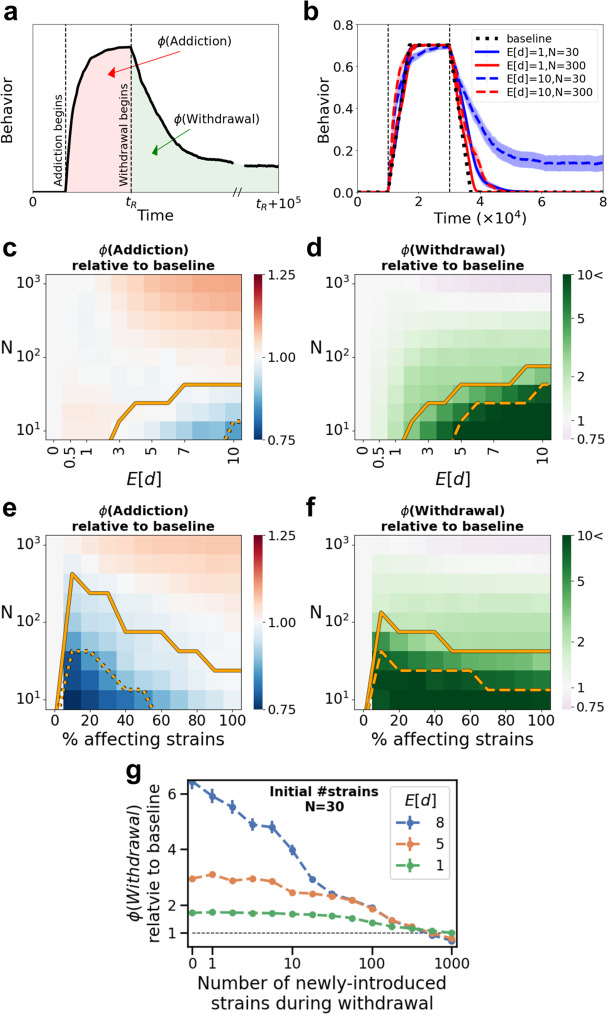
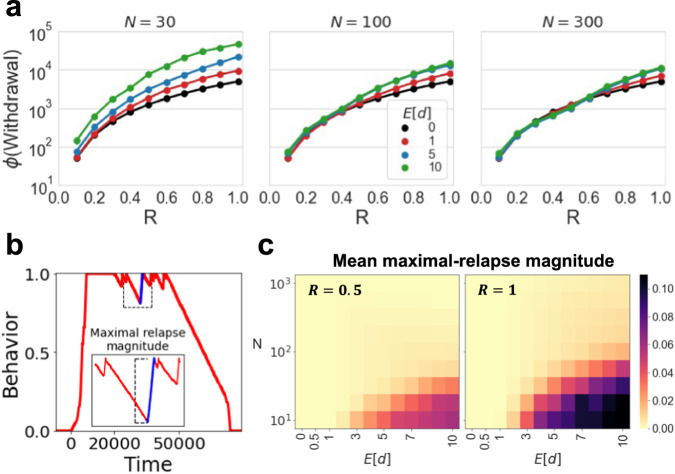
Recent studies revealed mechanisms by which the microbiome affects its host's brain, behavior and wellbeing, and that dysbiosis - persistent microbiome-imbalance - is associated with the onset and progress of various chronic diseases, including addictive behaviors. Yet, understanding of the ecological and evolutionary processes that shape the host-microbiome ecosystem and affect the host state, is still limited. Here we propose that competition dynamics within the microbiome, associated with host-microbiome mutual regulation, may promote dysbiosis and aggravate addictive behaviors. We construct a mathematical framework, modeling the dynamics of the host-microbiome ecosystem in response to alterations. We find that when this ecosystem is exposed to substantial perturbations, the microbiome may shift towards a composition that reinforces the new host state. Such a positive feedback loop augments post-perturbation imbalances, hindering attempts to return to the initial equilibrium, promoting relapse episodes and prolonging addictions. We show that the initial microbiome composition is a key factor: a diverse microbiome enhances the ecosystem's resilience, whereas lower microbiome diversity is more prone to lead to dysbiosis, exacerbating addictions. This framework provides evolutionary and ecological perspectives on host-microbiome interactions and their implications for host behavior and health, while offering verifiable predictions with potential relevance to clinical treatments.


Conflict of interest statement

The authors declare no competing interests.

Figures

Fig. 1
Fig. 1. A microbe’s effect on its host’s state may be beneficial when it provides an advantage over a competitor that outweighs the cost of producing that effect.
a Model Illustration. We model competition between two microbial strains for host resources, which are derived from the host behavior. Host behavior is modeled as a random walk along the [0,1] interval, starting at 0.5. The microbial strains are represented by coordinates on that same segment, while the distance between their coordinates and the behavior coordinate represents the fitness of each strain under that host behavior (see Methods). One of the two microbial strains (blue) has the potential to affect its host’s behavior: it secretes positive feedback when proliferating, inducing the host to continue its behavioral trend, and secretes negative feedback when declining, inducing the host to reverse its behavioral trend. These secretions are proportional to the strain’s abundance (see Methods). b Heatmaps presenting the proportion of the strain that affects its host, after 100,000 time points, as a function of the effect’s magnitude and the cost of producing the effect, for two different intra-strain competition regimes (upper panel: s=0.01; bottom panel: s=0.1). The vertical dashed lines represent the maximal advantage that the affecting strain can gain from the host behavior, relative to its competitor (0.1 in these simulations); thus it is not expected to succeed when the cost is greater (see Methods). Each pixel represents the average result of 500 simulations. c Time series examples showing the host behavior as function of time over 100,000 time points; s=0.1 and the cost of effect production is 0.09. In panels (b) and (c) the coordinates of the affecting strain and its non-affecting competitor were set to 0 and 1 respectively. The line at 0.5 is the starting position of the behavior. See Methods for a detailed description of the model.
Fig. 2
Fig. 2. Microbiome effect on host behavior may considerably decelerate the withdrawal stage.
a Model illustration. The host behavior is represented by coordinates in the 2D unit sphere (star). Microbial strains (colored dots) are characterized by features, represented as coordinates in that sphere. The host contribution to the growth of each strain is a function of the distance between the host behavior and the strain’s features (see Methods). Thus, the microbial coordinates represent the access to host-derived resources, as a function of the host behavior. The illustration demonstrates how a perturbation in the host behavior (movement of the star) produces a change in the contribution of the host to each microbial strain, which affects the microbiome composition. The color and size of each dot represents the strain’s feature-distance from the perturbed host behavior (bluer is closer) and the strain’s proportion within the microbiome, respectively. b, c Simulation examples. Upper panels show a collection of simulation results: the change in behavior over time without (dashed black) and with microbiome effects (red; 50 runs in each panel), for different mean microbiome effect magnitudes Ed=1,10. The bold red curve represents a randomly selected simulation run, for which the microbiome composition over time is plotted in the bottom panels. Each stripe (yellow-blue scale) represents a microbial strain, while the width of the stripe represents the temporal proportion of the strain within the microbiome. As in panel (a), the color of each stripe represents the strain’s feature-distance from the perturbed host’s behavior, which is the basis for the fitness evaluation. The number of strains N is set to 50.
Fig. 3
Fig. 3. Low richness of the host microbiome may affect the addiction process and lead to substantial aggravation of the withdrawal stage.
a Illustration of a host-behavior time series. The colored markings present the integral of the behavior over time, for the addiction process (ϕ(Addiction); light red) and withdrawal process (ϕ(Withdrawal); light green). For the addiction process we consider the time from the addiction initiation until the withdrawal initiation, while for the withdrawal we consider the time from the withdrawal initiation, until the end of the simulation, 100,000 time points after withdrawal stage initiation. b Average host behavior over time is plotted for the baseline case of no microbiome effect (dashed black) and for cases that include the microbiome effect (red-blue curves), considering two mean microbial effect magnitudes Ed and two numbers of available strains N. Each curve presents the average of 50 simulation runs. c, d The color of each pixel in the heatmaps represent the fold increase or decrease in ϕ(Addiction) (c) and ϕ(Withdrawal) (d) relative to the baseline case of no microbiome effect, as functions of N and Ed. Each pixel in the heatmap presents the average of 1000 simulations (see also Methods and Supplementary Fig. 6). e, f The color of each pixel in the heatmaps represent the fold increase or decrease in ϕ(Addiction) (e) and ϕ(Withdrawal) (f) relative to the baseline case of no microbiome effect, as a function of N and of the percentage of strains that can affect the host behavior. Each pixel in the heatmaps presents the average of 1000 simulations. To keep the mean of the overall manipulation strength of the microbiome constant and vary only the proportion of strains that affect the host behavior, we set the mean magnitude of the microbes’ effects Ed=5proportionofaffectingstrains. Below the solid lines in (c) and (e), in more than 1% of the simulations the behavior does not reach the maximal addiction severity R, and below the dashed line, in more than 20% it does not. Below the solid line in (d) and (f) the behavior does not return to the initial state at the end of the simulation in more than 1% of the runs; and below the dashed line, the behavior does not return in more than 20% of the runs. g The ϕ(Withdrawal) relative to the baseline case of no microbiome effect is plotted as function of the number of new strains that are introduced to the system during the withdrawal stage, for several mean microbial effect magnitudes Ed. For the analysis of this panel the initial microbiome community, before the introduction of new strains during the withdrawal, was set to contain 30 different strains. Each dot represents the average of 1000 simulations. Error bars represent the standard error of the mean. R=0.7 is used throughout the analysis for this figure.
Fig. 4
Fig. 4. Exacerbating effect of microbiome on host withdrawal increases with addiction severity.
a The integral of the behavior over time during the withdrawal stage (ϕ(Withdrawal)) is plotted as a function of the maximal addiction severity R, for several numbers of available strains N and the mean magnitudes of the effects Ed. Each dot represents the average of 1000 simulations. b Relapse schematic example: we define a relapse as an increase in the addictive behavior that occurs after the withdrawal phase has begun. In each simulation we define the maximal-relapse magnitude as the maximum among the differences between all coordinates of the behavior in the withdrawal phase, and the coordinates of behavior that follow. c The color of each pixel in the heatmaps represent the mean maximal-relapse magnitude as a function of N and Ed, for different maximal addiction intensities. Each pixel in the heatmaps presents the average of 1000 simulations.

Similar articles

Cited by

References

    1. Volkow ND, Koob GF, McLellan AT. Neurobiologic advances from the brain disease model of addiction. N. Engl. J. Med. 2016;374:363–371. doi: 10.1056/NEJMra1511480. - DOI - PMC - PubMed
    1. Hedegaard, H., Miniño, A. M., Spencer, M. R. & Warner, M. Drug overdose deaths in the United States, 1999–2020. (2021). - PubMed
    1. Peacock A, et al. Global statistics on alcohol, tobacco and illicit drug use: 2017 status report. Addiction. 2018;113:1905–1926. doi: 10.1111/add.14234. - DOI - PubMed
    1. Sacks JJ, Gonzales KR, Bouchery EE, Tomedi LE, Brewer RD. 2010 national and state costs of excessive alcohol consumption. Am. J. Preventive Med. 2015;49:e73–e79. doi: 10.1016/j.amepre.2015.05.031. - DOI - PubMed
    1. Okunogbe A, et al. Economic impacts of overweight and obesity: current and future estimates for 161 countries. BMJ Glob. Health. 2022;7:e009773. doi: 10.1136/bmjgh-2022-009773. - DOI - PMC - PubMed

Publication types