. 2023 Jul 26;11(1):162.
doi: 10.1186/s40168-023-01587-x.

Darier's disease exhibits a unique cutaneous microbial dysbiosis associated with inflammation and body malodour

Affiliations

Darier's disease exhibits a unique cutaneous microbial dysbiosis associated with inflammation and body malodour

Yacine Amar et al. Microbiome. .

Erratum in

Abstract

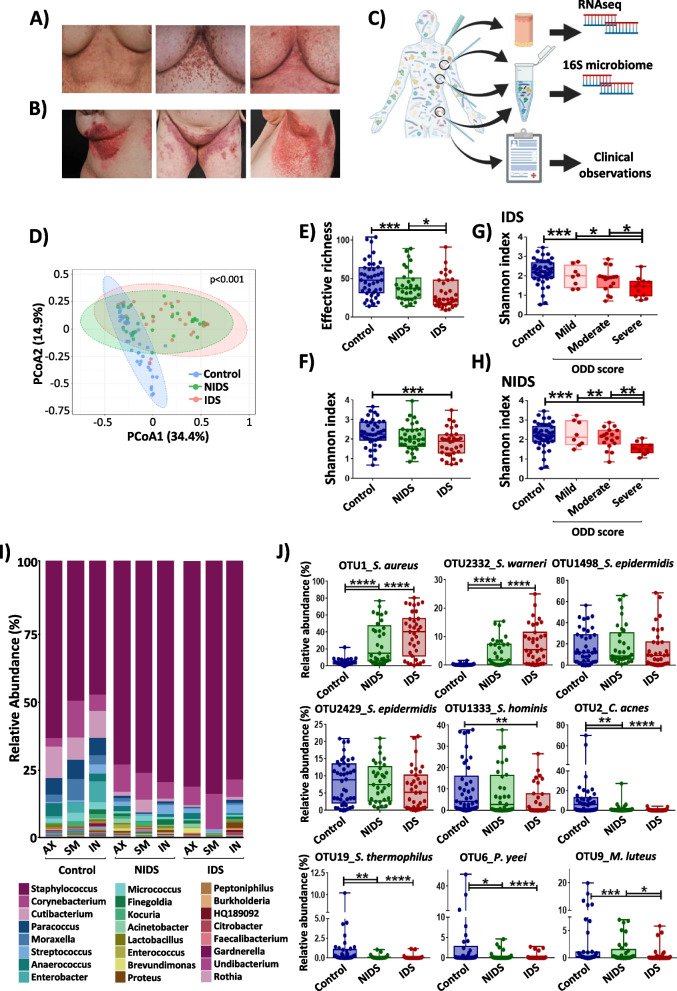
Background: Darier's disease (DD) is a genodermatosis caused by mutations of the ATP2A2 gene leading to disrupted keratinocyte adhesion. Recurrent episodes of skin inflammation and infections with a typical malodour in DD indicate a role for microbial dysbiosis. Here, for the first time, we investigated the DD skin microbiome using a metabarcoding approach of 115 skin swabs from 14 patients and 14 healthy volunteers. Furthermore, we analyzed its changes in the context of DD malodour and the cutaneous DD transcriptome.

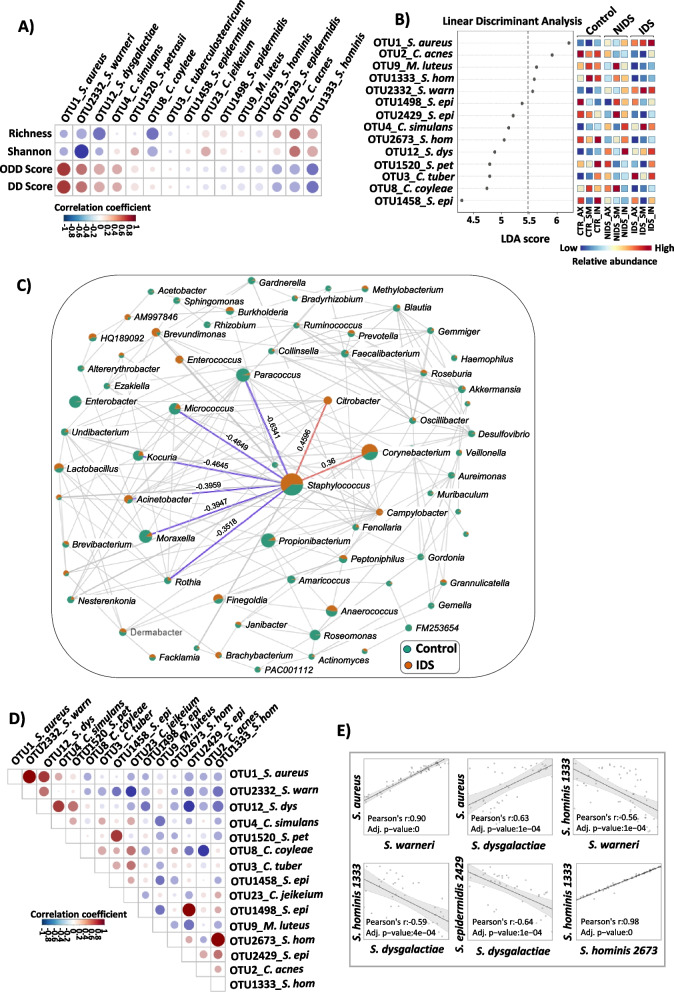
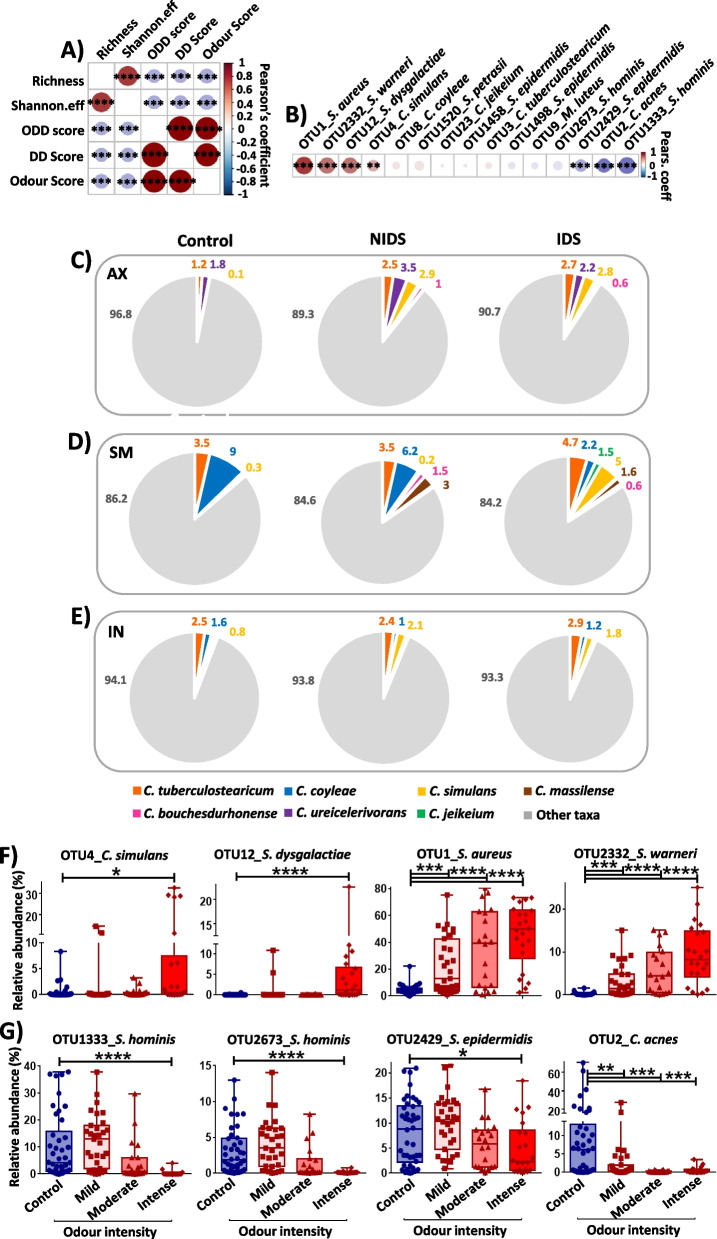
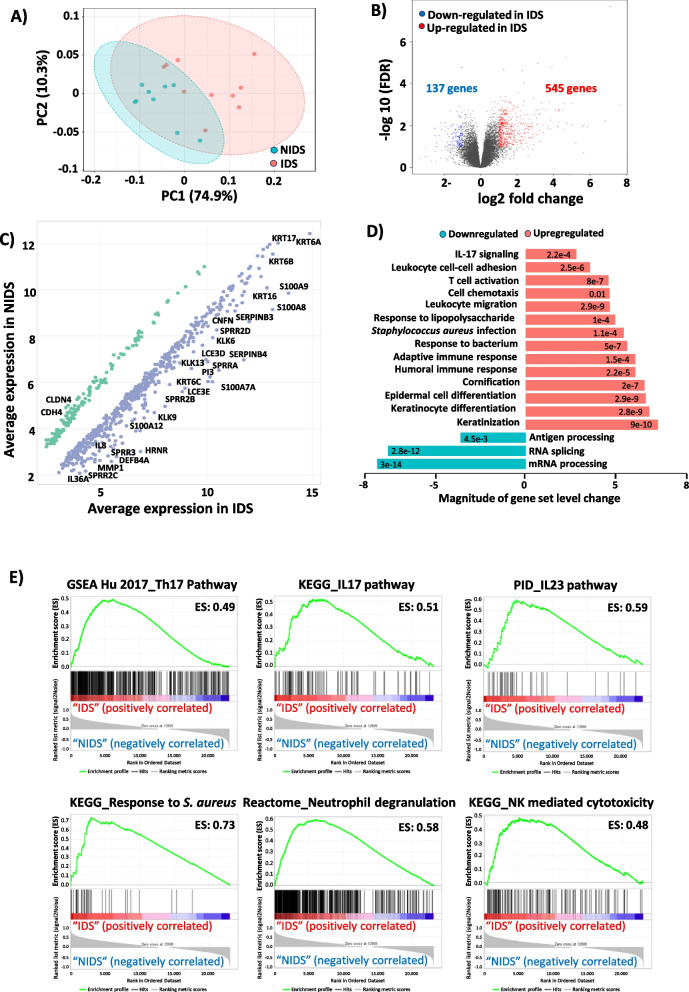
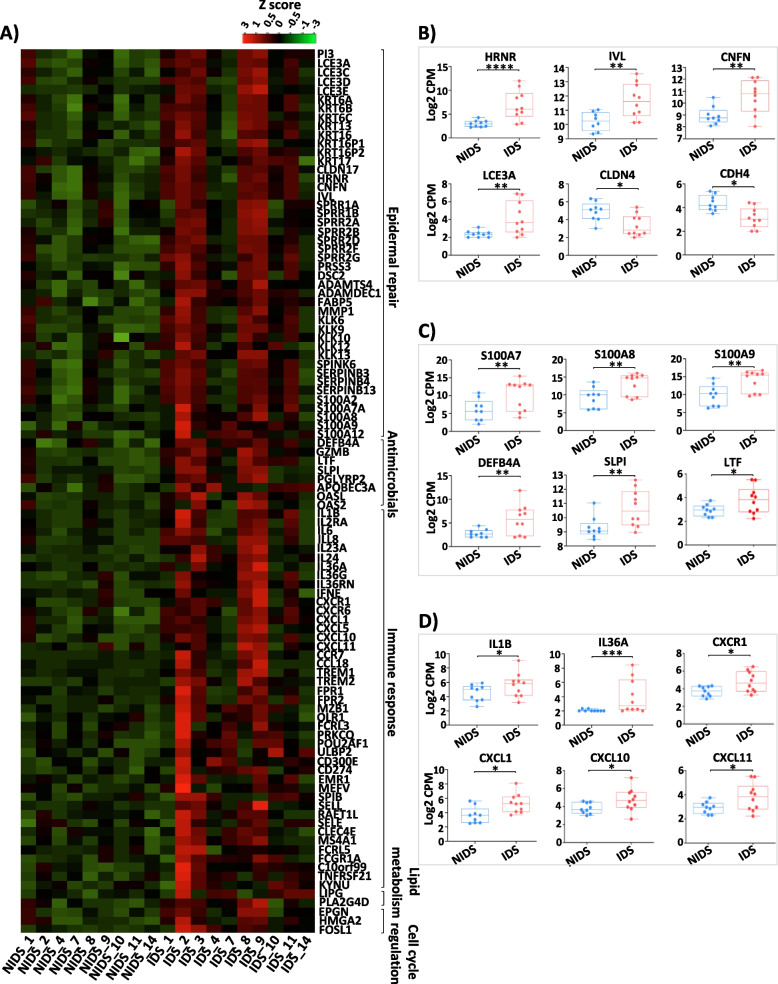
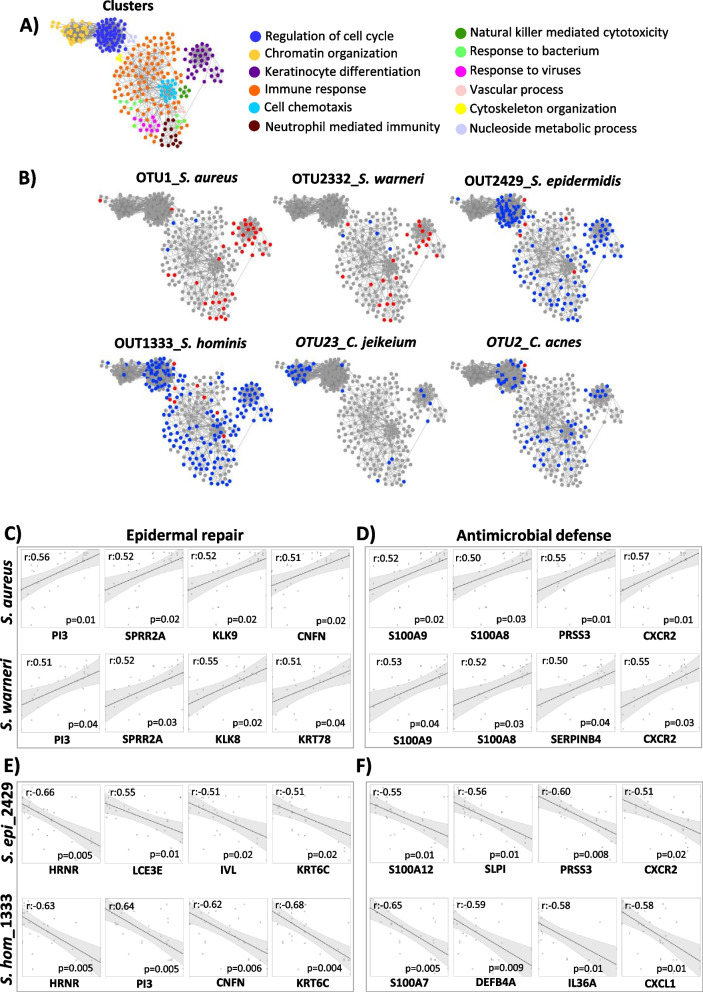
Results: We identified a disease-specific cutaneous microbiome with a loss of microbial diversity and of potentially beneficial commensals. Expansion of inflammation-associated microbes such as Staphylococcus aureus and Staphylococcus warneri strongly correlated with disease severity. DD dysbiosis was further characterized by abundant species belonging to Corynebacteria, Staphylococci and Streptococci groups displaying strong associations with malodour intensity. Transcriptome analyses showed marked upregulation of epidermal repair, inflammatory and immune defence pathways reflecting epithelial and immune response mechanisms to DD dysbiotic microbiome. In contrast, barrier genes including claudin-4 and cadherin-4 were downregulated.

Conclusions: These findings allow a better understanding of Darier exacerbations, highlighting the role of cutaneous dysbiosis in DD inflammation and associated malodour. Our data also suggest potential biomarkers and targets of intervention for DD. Video Abstract.

Keywords: Darier’s disease; Genodermatosis; Malodour; Microbiome; Skin barrier; Transcriptome.


Conflict of interest statement

The authors declare no competing interests.

Figures

Fig. 1
Fig. 1
Cutaneous microbiome in DD is characterized by a reduced α-diversity and strong dysbiotic shifts. A Representative pictures for submammary skin of Darier’ patients with mild (ODD: 16.5), moderate (ODD: 29) and severe (ODD: 50.5) objective DD scores (from left to right). B Erythematous and hyperkeratotic papules observed on DD predilection areas. C Workflow of microbiome and transcriptome sampling and analysis. Samples were collected from axillary (AX), submammary (SM) and inguinal (IN) areas. Created with BioRender.com. D Principal coordinate analysis (PcoA) plot of β-diversity of microbiota from healthy, non-inflamed (NIDS) and inflamed (IDS) DD skin microbiomes. The Bray–Curtis index was used to calculate the similarity between samples and PERMANOVA to test the statistical significance based on the distance matrix. E, F α-diversity expressed as effective richness (number of OTUs) and the Shannon index are shown for control healthy skin, NIDS and IDS. Shannon index displayed according to the objective DD score for G IDS and H NIDS skin compared to control samples. I Bar chart of taxonomy binning displayed at the genus level. The taxonomic composition was assessed by summing up OTUs relative abundances that share the same assignment at the genus level. The Bayesian classifier from the RDP database was used for OTUs classification. J Relative abundances plots of dominant taxa S. aureus, S. warneri, S. epidermidis, S. hominis, C. acnes, S. thermophilus, P. yeei and M. luteus. Each dot represents a swab sample. Multiple test corrections were performed with the Benjamini and Hochberg procedures. The statistical significance was calculated using Kruskal–Wallis and Wilcoxon-Mann–Whitney tests, respectively, for multiple group and pairwise comparisons. The asterisks indicate statistically significant differences and correspond to *p ≤ 0.05, **p ≤ 0.01, ***p ≤ 0.001, and ****p ≤ 0.0001
Fig. 2
Fig. 2
Key members of DD cutaneous microbiome correlate with disease severity and may serve as microbial disease markers. A Correlation analysis of key taxa with α-diversity (richness and Shannon index), DD score (global severity score) and ODD score (objective severity score). B Linear discriminant analysis effect size (LEFSe) of key taxa distribution over the different skin locations. LEFSe employs the Kruskal–Wallis rank sum test to detect OTUs with significant differential abundances between groups (control, NIDS and IDS), the pairwise Wilcoxon test between sub-groups, followed by a linear discriminant analysis (LDA) to evaluate the relevance or effect size of each differentially abundant taxon. The heatmap to the right shows in which group the taxa relative abundance is increased and the LDA score displays the potential marker taxa of the group. We considered in our analysis that the strongest associations between key taxa and skin phenotype are best delineated above the LDA cutoff of 5.5. Red and blue colors on the LDA plot indicate high and low taxa relative abundances, respectively. C Correlation network of microbiome communities in IDS and control groups displayed at the genus level. The SparCC (sparse correlations for compositional data) approach has been used to define network associations. This approach assumes a sparse network and performs iterations to identify taxa pairs that are outliers to background correlations. Each node represents a taxon and its size is proportional to the number of connections. The green and orange colors on the nodes indicate the taxa mean relative abundance in the control and IDS groups, respectively. Taxa are only connected if the correlation meets a p value cutoff of 0.05 and a correlation coefficient of 0.3. Key correlations with the Staphylococcus genus are highlighted in the figure with blue and red lines, representing negative and positive correlations, respectively. D Correlation analysis of key taxa relevant in DD pathology. E Linear correlation plots of representative taxa interactions. Pearson’s coefficient was used to calculate correlations among taxa or between taxa and metavariables. Red and blue colours on the correlation plots respectively indicate positive and negative correlations. Statistical significance was calculated using Kruskal–Wallis and Wilcoxon-Mann–Whitney tests, respectively, for multiple group and pairwise comparisons. The asterisks indicate statistically significant differences and correspond to *p ≤ 0.05, **p ≤ 0.01, and ***p ≤ 0.001
Fig. 3
Fig. 3
Skin dysbiosis is associated with malodour in DD. A Correlation plot of α-diversity, disease severity and malodour in Darier patients. B Association between key abundant taxa and DD malodour. Pearson’s coefficient was used to calculate correlations among metavariables or between taxa and odour intensity. Red and blue colors on the correlation plots indicate positive and negative correlations, respectively. C Pie charts of Corynebacterium taxa distribution on DD axillary D submammary and E inguinal locations. The Corynebacterium group shows a threefold increase of abundance on the axillary regions and higher diversity on DD submammary areas. An increase of C. simulans abundance is characteristic on DD skin. F Relative abundances of DD representative taxa proportionally increasing or G decreasing with odour intensity. The statistical significance was calculated using Kruskal–Wallis and Wilcoxon-Mann–Whitney tests, respectively, for multiple group and pairwise comparisons. The asterisks indicate statistically significant differences and correspond to *p ≤ 0.05, **p ≤ 0.01, ***p ≤ 0.001, and ****p ≤ 0.0001
Fig. 4
Fig. 4
Epidermal repair and Th17 inflammatory pathways are upregulated in response to DD dysbiosis. A Principal component analysis (PCA) shows an altered gene expression profile of inflamed (IDS) compared to non-inflamed (NIDS) DD skin. B Volcano plot of fold expression change (FCH) vs false discovery rate (FDR) of the 2000 most varying genes in IDS versus NIDS transcriptomes reveals a significant upregulation of 545 differentially expressed genes (DEGs) and downregulation of 137. This plot displays the significance versus fold-change on Y and X axes, respectively. C Scatter plot of IDS versus NIDS gene expression profiles highlighting representative regulated transcripts. D Gene Ontology (GO) analysis of DD skin shows an enrichment of epidermal repair pathways and immune responses to pathogens with strong Th17 signatures. E Gene set enrichment analysis (GSEA) plots displaying representative DD-enriched immune pathways. To the far left (red) the plot shows a correlation of the gene set with the IDS phenotype and to the far right a correlation with the NIDS. The vertical black lines indicate the position of each gene within the ranked gene list. Every time a gene from the gene set is detected a hit is plotted. The green curve represents the running sum of the enrichment score of the GSEA. ES (enrichment score), KEGG (Kyoto Encyclopedia of Genes and Genomes) and PID (pathway interaction database)
Fig. 5
Fig. 5
Cutaneous transcriptome reveals characteristic DD signatures. A Heat map plot of top 100 genes with high expression levels in DD skin lesions. B Normalized count per million (CPM) of selected gene representatives of the epidermal repair cluster C antimicrobial defence and D immune response clusters. DESeq2 package was used to identify the DEGs using a cutoff threshold of FDR < 0.05, adj. p < 0.05 and fold change (FCH) > 1.5. The asterisks indicate statistically significant differences and correspond to *p ≤ 0.05, **p ≤ 0.01, ***p ≤ 0.001, and ****p ≤ 0.0001
Fig. 6
Fig. 6
Pathogens and commensals signatures in Darier skin. A Network analysis of DD representative gene clusters. The gene network of differentially expressed DEGs between IDS and NIDS was designed on Cytoscape 3 and gene clusters were identified with ClusterViz using the molecular complex detection algorithm (MCODE). B Representative gene clusters with taxa-associated host signatures. Key bacterial species on DD skin show significantly positive (red) or negative correlations (blue) with genes from different functional clusters. Linear correlations between epidermal repair or antimicrobial defence clusters reveal significant correlations with C, D key pathogens and E, F skin commensals relative abundances. Correlations were calculated on R program and significance was adjusted for FDR

Similar articles

Cited by

References

    1. Darier J. Psorospermose folliculaire végétante. Ann Dermatol Syphiligr. 1889;10:597–612.
    1. White JC. A case of keratosis (icthyosis) follicularis. Cutan Genitourin Dis. 1889;7:201–209.
    1. Tavadia S, Mortimer E, Munro CS. Genetic epidemiology of Darier’s disease: a population study in the west of Scotland. Br J Dermatol. 2002;146(1):107–109. doi: 10.1046/j.1365-2133.2002.04559.x. - DOI - PubMed
    1. Svendsen IB, Albrectsen B. The prevalence of dyskeratosis follicularis (Darier’s disease) in Denmark: an investigation of the heredity in 22 families. Acta Derm Venereol. 1959;39:256–269. - PubMed
    1. Burge SM, Wilkinson JD. Darier-White disease: a review of the clinical features in 163 patients. J Am Acad Dermatol. 1992;27(1):40–50. doi: 10.1016/0190-9622(92)70154-8. - DOI - PubMed

Publication types

Substances

LinkOut - more resources