Whole slide imaging (WSI) scanner differences influence optical and computed properties of digitized prostate cancer histology
- PMID: 37496560
- PMCID: PMC10365953
- DOI: 10.1016/j.jpi.2023.100321
Whole slide imaging (WSI) scanner differences influence optical and computed properties of digitized prostate cancer histology
Abstract
Purpose: Digital pathology is becoming an increasingly popular area of advancement in both research and clinically. Pathologists are now able to manage and interpret slides digitally, as well as collaborate with external pathologists with digital copies of slides. Differences in slide scanners include variation in resolution, image contrast, and optical properties, which may influence downstream image processing. This study tested the hypothesis that varying slide scanners would result in differences in computed pathomic features on prostate cancer whole mount slides.
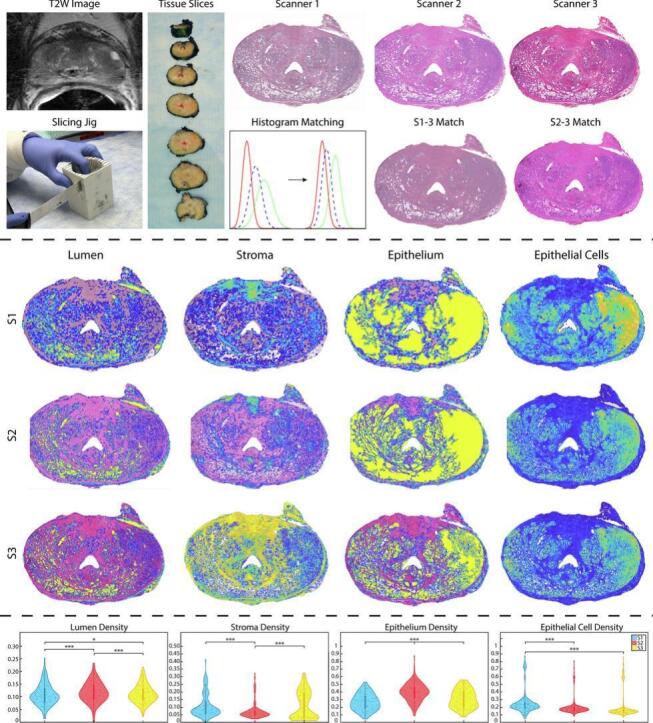
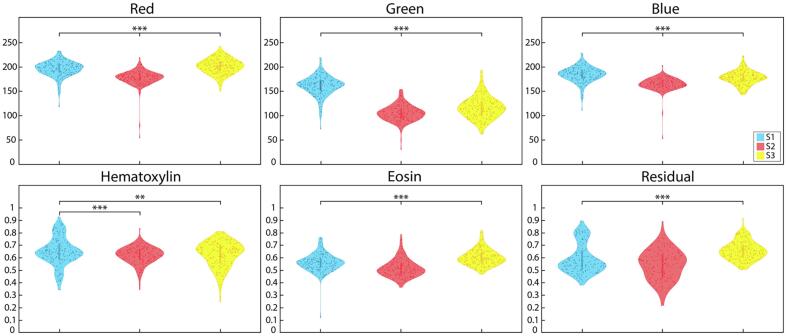
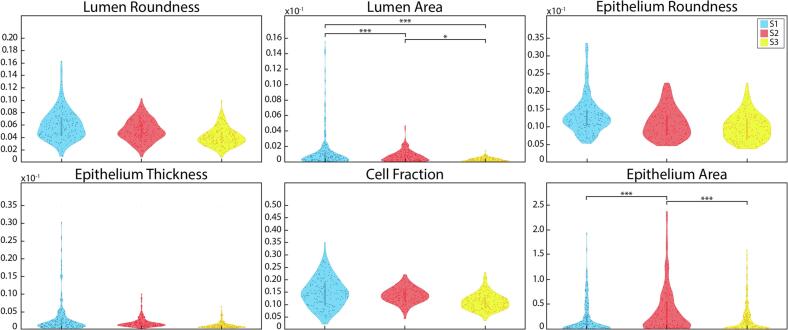
Design: This study collected 192 unique tissue slides from 30 patients following prostatectomy. Tissue samples were paraffin-embedded, stained for hematoxylin and eosin (H&E), and digitized using 3 different scanning microscopes at the highest available magnification rate, for a total of 3 digitized slides per tissue slide. These scanners included a (S1) Nikon microscope equipped with an automated sliding stage, an (S2) Olympus VS120 slide scanner, and a (S3) Huron TissueScope LE scanner. A color deconvolution algorithm was then used to optimize contrast by projecting the RGB image into color channels representing optical stain density. The resulting intensity standardized images were then computationally processed to segment tissue and calculate pathomic features including lumen, stroma, epithelium, and epithelial cell density, as well as second-order features including lumen area and roundness; epithelial area, roundness, and wall thickness; and cell fraction. For each tested feature, mean values of that feature per digitized slide were collected and compared across slide scanners using mixed effect models, fit to compare differences in the tested feature associated with all slide scanners for each slide, including a random effect of subject with a nested random effect of slide to account for repeated measures. Similar models were also computed for tissue densities to examine how differences in scanner impact downstream processing.
Results: Each mean color channel intensity (i.e., Red, Green, Blue) differed between slide scanners (all P<.001). Of the color deconvolved images, only the hematoxylin channel was similar in all 3 scanners (all P>.05). Lumen and stroma densities between S3 and S1 slides, and epithelial cell density between S3 and S2 (P>.05) were comparable but all other comparisons were significantly different (P<.05). The second-order features were found to be comparable for all scanner comparisons, except for lumen area and epithelium area.
Conclusion: This study demonstrates that both optical and computed properties of digitized histological samples are impacted by slide scanner differences. Future research is warranted to better understand which scanner properties influence the tissue segmentation process and to develop harmonization techniques for comparing data across multiple slide scanners.
Keywords: Digital pathology; Digital slide scanners; Histology; Histomorphometric features.
© 2023 The Authors. Published by Elsevier Inc. on behalf of Association for Pathology Informatics.
Conflict of interest statement
The authors declare that they have no known competing financial interests or personal relationships that could have appeared to influence the work reported in this paper.
Figures