. 2023 Jul 9;19(11):3526-3543.
doi: 10.7150/ijbs.84781. eCollection 2023.

Unraveling Colorectal Cancer and Pan-cancer Immune Heterogeneity and Synthetic Therapy Response Using Cuproptosis and Hypoxia Regulators by Multi-omic Analysis and Experimental Validation

Affiliations

Unraveling Colorectal Cancer and Pan-cancer Immune Heterogeneity and Synthetic Therapy Response Using Cuproptosis and Hypoxia Regulators by Multi-omic Analysis and Experimental Validation

Pei-Cheng Jiang et al. Int J Biol Sci. .

Abstract

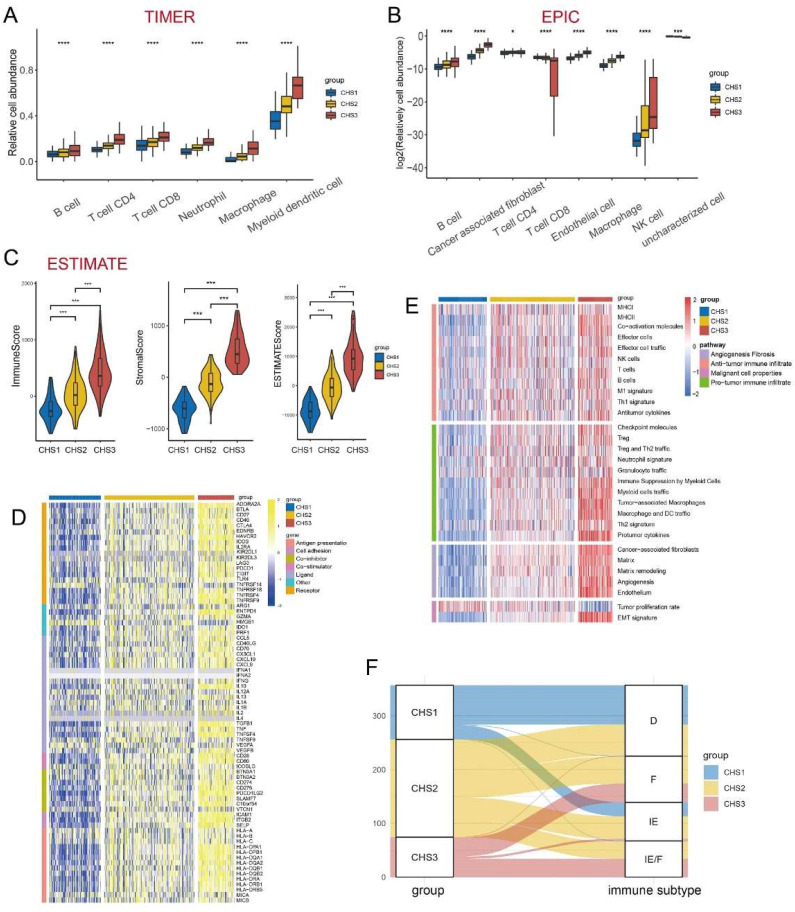
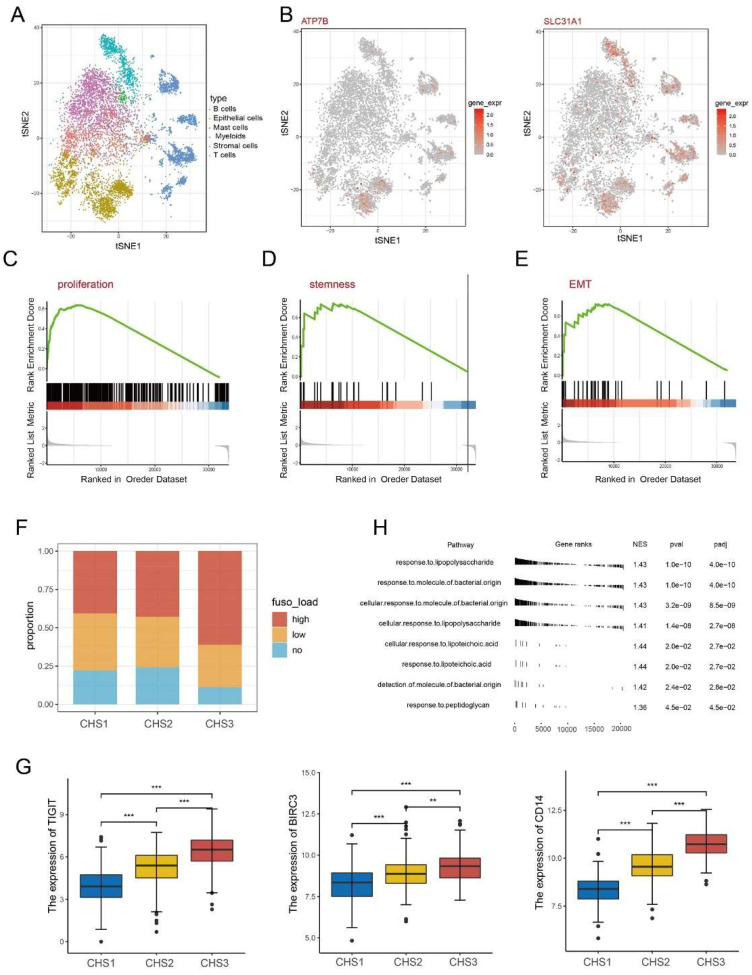
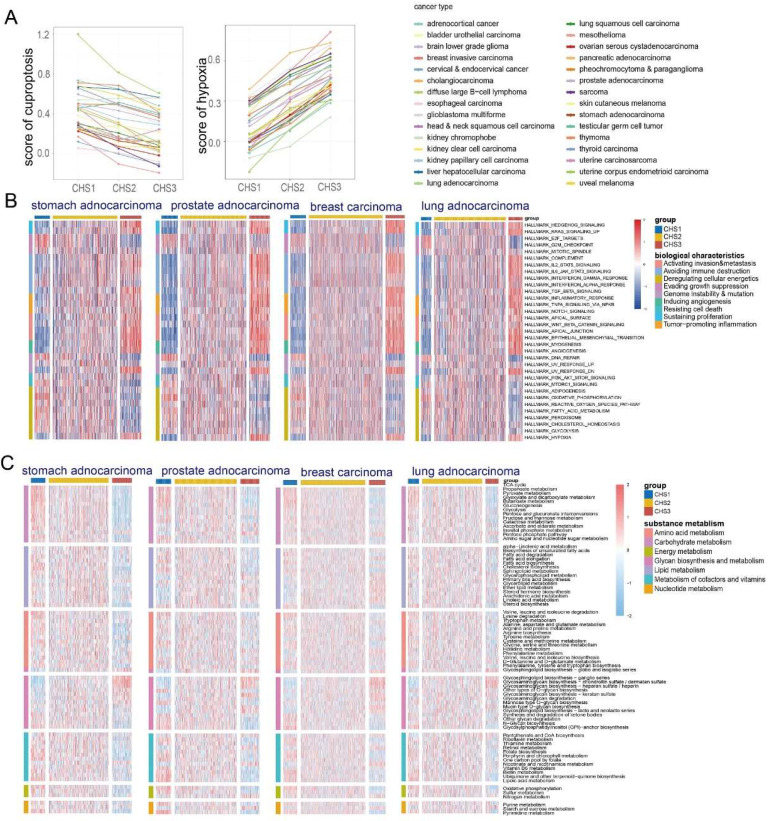
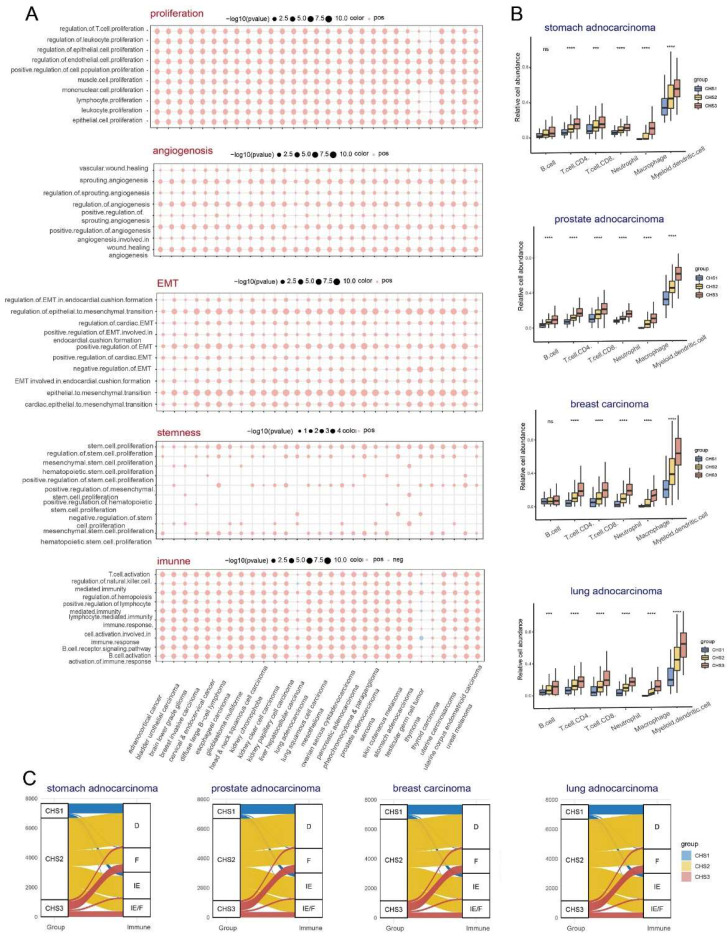
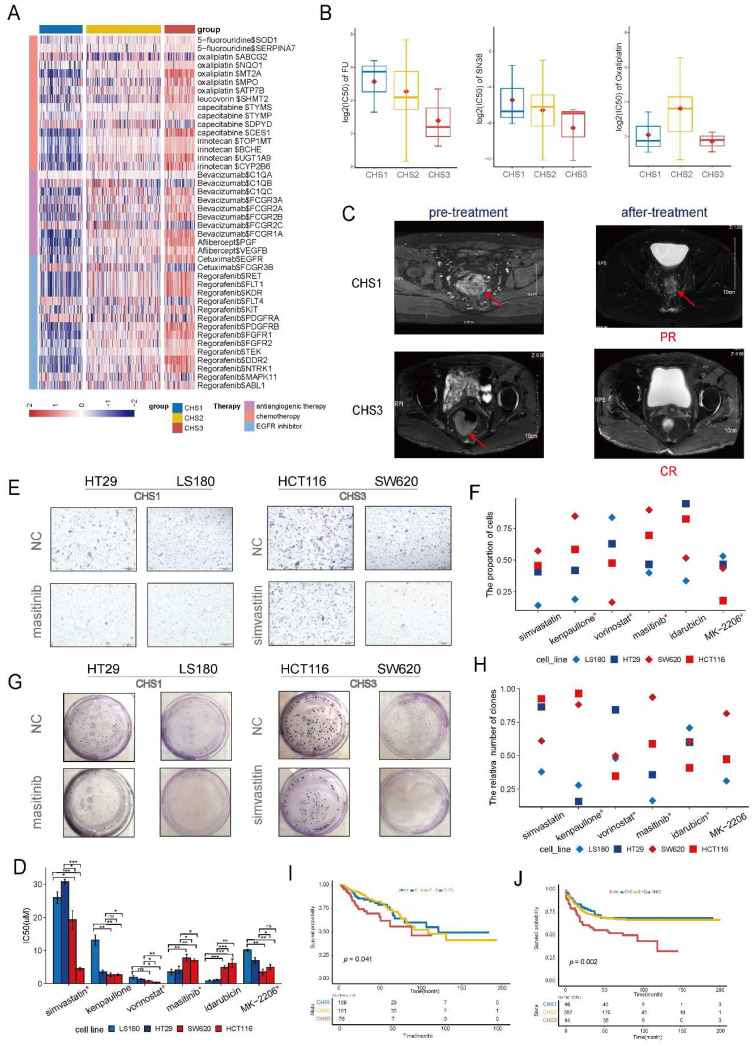
Cuproptosis, a new type of programmed cell death (PCD), is closely related to cellular tricarboxylic acid cycle and cellular respiration, while hypoxia can modulate PCD. However, their combined contribution to tumor subtyping remains unexplored. Here, we applied a multi-omics approach to classify TCGA_COADREAD based on cuproptosis and hypoxia. The classification was validated in three colorectal cancer (CRC) cohorts and extended to a pan-cancer analysis. The results demonstrated that pan-cancers, including CRC, could be divided into three distinct subgroups (cuproptosis-hypoxia subtypes, CHSs): CHS1 had active metabolism and poor immune infiltration but low fibrosis; CHS3 had contrasting characteristics with CHS1; CHS2 was intermediate. CHS1 may respond well to cuproptosis inducers, and CHS3 may benefit from a combination of immunotherapy and anti-fibrosis/anti-hypoxia therapies. In CRC, the CHSs also showed a significant difference in prognosis and sensitivity to classic drugs. Organoid-based drug sensitivity assays validated the results of transcriptomics. Cell-based assays indicated that masitinib and simvastatin had specific effects on CHS1 and CHS3, respectively. A user-friendly website based on the classifier was developed (https://fan-app.shinyapps.io/chs_classifier/) for accessibility. Overall, the classifier based on cuproptosis and hypoxia was applicable to most pan-cancers and could aid in personalized cancer therapy.

Keywords: clustering; colorectal cancer; cuproptosis; hypoxia; precision treatment.


Conflict of interest statement

Competing Interests: The authors have declared that no competing interest exists.

Figures

Figure 1
Figure 1
The flowchart of the study.
Figure 2
Figure 2
The genomic characteristics in CHSs. A. The characteristics of SNP in 3 CHSs. B,C. Kras and Braf mutation rate of CHSs in training set and GSE39582, respectively. D. The characteristics of CNV in CHS1, CHS2, CHS3. E-G. The result of GO analysis to loci with mutation in CHS1, CHS2, CHS3.
Figure 3
Figure 3
Representative biological characteristics in CHSs. A. The features of hallmarks of each subtype. B. The key biological traits of each subtype. C. The results of GO enrichment analysis on DEGs. D. The results of GSEA analysis on proliferation, angiogenesis. E. The correspondence between CHS and CMS. F. The metabolic profile among 3 CHSs. G. GSEA analysis of TCA cycle and lipoic acid metabolism.
Figure 4
Figure 4
The immune landscape among 3 CHSs. A,B. The abundance of immune cells by TIMER, EPIC. C. The scores of Estimate. ∗, p<0.05; ∗∗, p<0.01; ∗∗∗, p<0.001. D. The expression of ICB in each subtype. ICB, immune checkpoint blockade. E. The evaluation of Fges for immune. Fges, functional gene expression signatures. F. The correspondence between CHS and Fges classification. D, immune-depleted; F, fibrotic; IE, immune-enriched, non-fibrotic; IE/F, immune-enriched, fibrotic.
Figure 5
Figure 5
Single cell and Fusobacterium nucleatum analysis. A. The distribution of cell type in GSE144735. B. The expression of ATP7B and SLC31A1 in single cells. C-E. The GSEA analysis on proliferation, stemness, invasion of cancer cells. F. The abundance of F.n among 3 subtypes. H. The result of GSEA analysis on bacteria-related pathways. G. The expression of TIGIT, BIRC3, CD14 among 3 subtypes. ∗, p<0.05; ∗∗, p<0.01; ∗∗∗, p<0.001.
Figure 6
Figure 6
Classic biological characteristics of CHSs in pan-cancer. A. The characteristic of cuproptosis and hypoxia among CHSs in pan-cancer. B. The features of hallmarks of each subtype in representative cancer. C. The metabolic profile among CHSs in representative cancer.
Figure 7
Figure 7
The immune landscape among 3 CHSs in pan-cancer. A. The results of GSEA analysis on proliferation, angiogenesis, invasion, stemness, and immune in pan-cancer. B. The abundance of immune cells by TIMER in representative cancer. ∗, p<0.05; ∗∗, p<0.01; ∗∗∗, p<0.001. C. The correspondence between CHS and Fges classification in representative cancer.
Figure 8
Figure 8
Clinical application of the clustering. A. The expression of targeted molecules of chemotherapeutic drugs. B. The IC50 of fluorine, SN38 and oxaliplatin in organoids. C. The MRI images of patients belonged to CHS1 and CHS3. MRI, magnetic resonance imaging; PR, partial response; CR, complete response. D. The IC50 of the drugs for colorectal cells. *, the assay results were consistent with the prediction of the cMap database. #, the unit is nm. E. The representative images of transwell assay. NC, normal control. F. The result of transwell assay for CRC cell lines with screened drugs. NC, normal control. G. The representative images of colony-formation. NC, normal control. H. The results of colony-formation for CRC cell lines with screened drugs. NC, normal control. I.J. Kaplan-Meier plot for 3 CHSs in training set and GSE39582, respectively.

References

    1. Grubman A, White AR. Copper as a key regulator of cell signalling pathways. Expert Rev Mol Med. 2014;16:e11. - PubMed
    1. Gaetke LM, Chow-Johnson HS, Chow CK. Copper: toxicological relevance and mechanisms. Arch Toxicol. 2014;88:1929–1938. - PMC - PubMed
    1. Gupte A, Mumper RJ. Elevated copper and oxidative stress in cancer cells as a target for cancer treatment. Cancer Treat Rev. 2009;35:32–46. - PubMed
    1. Li Y. Copper homeostasis: Emerging target for cancer treatment. Iubmb Life. 2020;72:1900–1908. - PubMed
    1. Tsvetkov P, Coy S, Petrova B. et al. Copper induces cell death by targeting lipoylated TCA cycle proteins. Science (American Association for the Advancement of Science) 2022;375:1254–1261. - PMC - PubMed

Publication types