. 2023 Jul 3;19(11):3395-3411.
doi: 10.7150/ijbs.83141. eCollection 2023.

Keratin 17 covalently binds to alpha-enolase and exacerbates proliferation of keratinocytes in psoriasis

Affiliations

Keratin 17 covalently binds to alpha-enolase and exacerbates proliferation of keratinocytes in psoriasis

Yixin Luo et al. Int J Biol Sci. .

Abstract

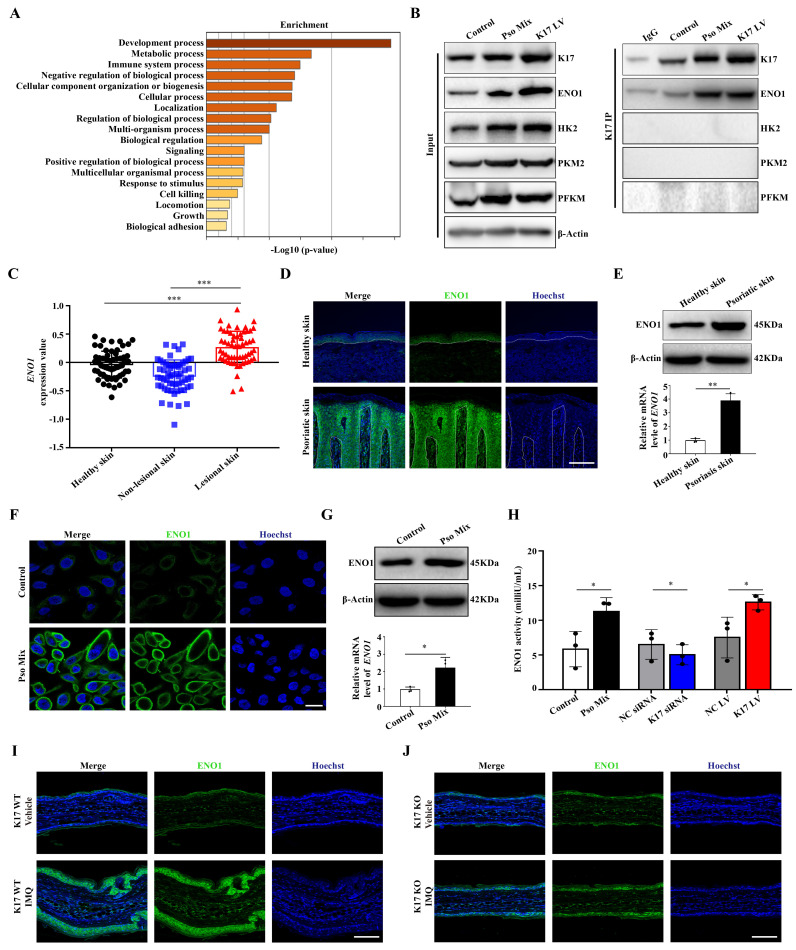
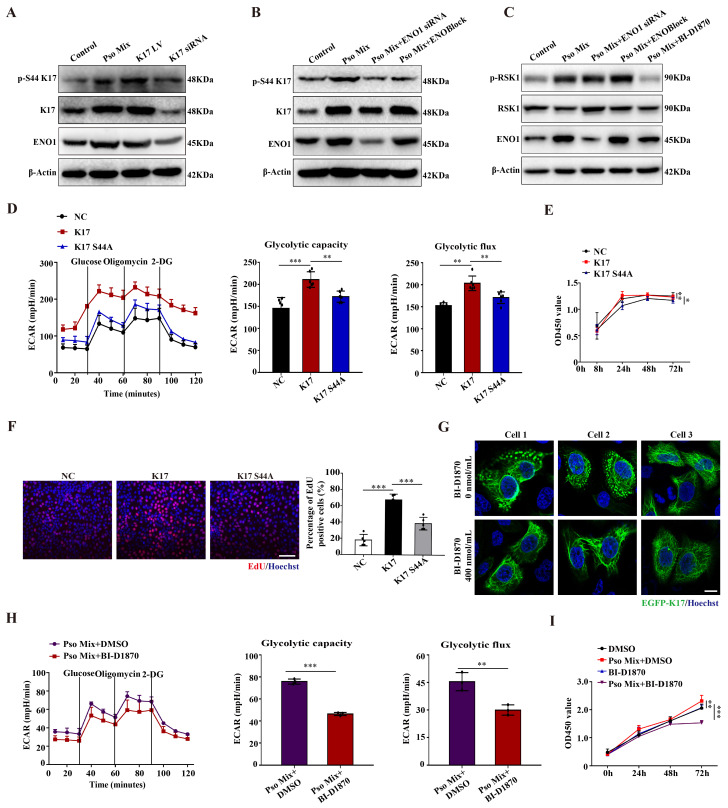
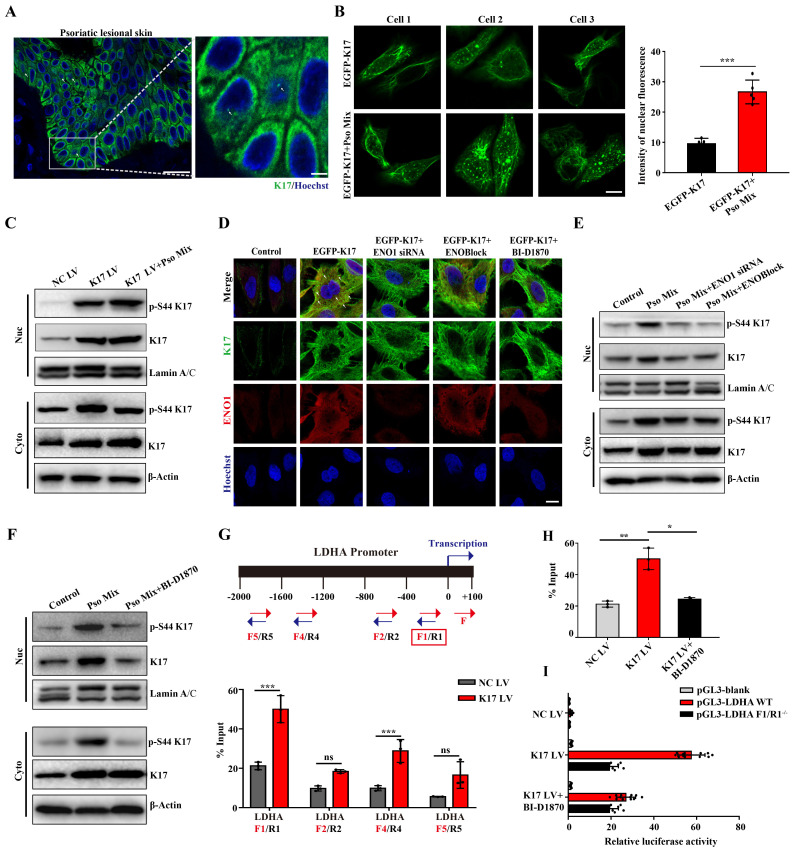
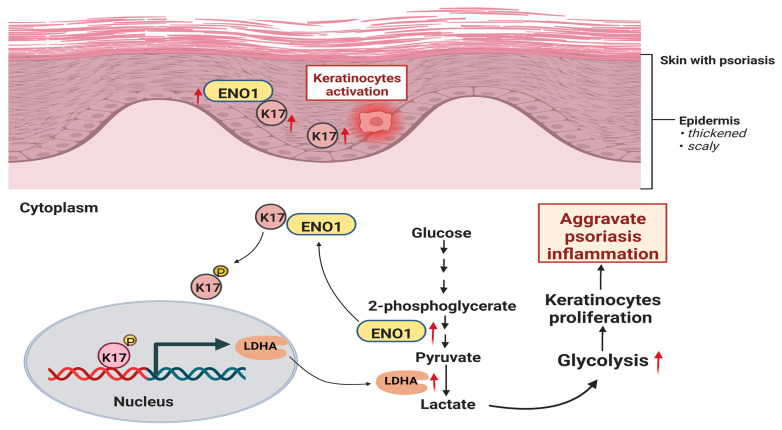
Dysregulated glucose metabolism is an important characteristic of psoriasis. Cytoskeletal protein keratin 17 (K17) is highly expressed in the psoriatic epidermis and contributes to psoriasis pathogenesis. However, whether K17 is involved in the dysregulated glucose metabolism of keratinocytes (KCs) in psoriasis remains unclear. In the present study, loss- and gain-of-function studies showed that elevated K17 expression was critically involved in glycolytic pathway activation in psoriatic KCs. The level of α-enolase (ENO1), a novel potent interaction partner of K17, was also elevated in psoriatic KCs. Knockdown of ENO1 by siRNA or inhibition of ENO1 activity by the inhibitor ENOBlock remarkably suppressed KCs glycolysis and proliferation. Moreover, ENO1 directly interacted with K17 and maintained K17-Ser44 phosphorylation to promote the nuclear translocation of K17, which promoted the transcription of the key glycolysis enzyme lactic dehydrogenase A (LDHA) and resulted in enhanced KCs glycolysis and proliferation in vitro. Finally, either inhibiting the expression and activation of ENO1 or repressing K17-Ser44 phosphorylation significantly alleviated the IMQ-induced psoriasis-like phenotype in vivo. These findings provide new insights into the metabolic profile of psoriatic KCs and suggest that modulation of the ENO1-K17-LDHA axis is a potentially innovative therapeutic approach to psoriasis.

Keywords: Alpha-enolase; Glycolysis; Keratin 17; Keratinocyte proliferation; Psoriasis.


Conflict of interest statement

Competing Interests: The authors have declared that no competing interest exists.

Figures

Figure 1
Figure 1
Elevated K17 expression facilitated glycolysis in psoriatic KCs. (A) Graphs demonstrate the most highly enriched Gene Ontology categories in the single-cell sequencing data from keratinocytes (KCs) of psoriasis patients versus those of healthy controls (n = 3). Enriched pathways are listed by their gene count and p value. (B) Gene set enrichment analysis of single-cell sequencing data from KCs of 3 patients with psoriasis versus those of 5 healthy controls. (C) mRNA expression of the key genes associated with glycolysis in Pso Mix-treated KCs (n = 3). (D, E) The extracellular acid ratio (ECAR), (F) extracellular lactate production, (G) intracellular ATP levels and (H) the uptake of glucose were analyzed in Pso Mix-treated KCs. (n = 3 for each group). (I) The ECAR of K17-overexpressing KCs and K17 siRNA-transfected KCs was measured using Seahorse XF. 2-DG, 2-deoxyglucose. (J, K) mRNA expression of the key genes associated with glycolysis in K17-overexpressing KCs and K17 siRNA-transfected KCs (n = 3). Data are presented as the mean ± SEM (n = 3-5). *p<0.05, **p<0.01, ***p<0.001, ns, not significant. p values were calculated by unpaired Student's t test. All experiments were repeated at least three times.
Figure 2
Figure 2
K17 enhances glycolysis by upregulating the expression and enzyme activity of ENO1. (A) The graphs demonstrate the most highly enriched Gene Ontology categories in the proteomic data of K17-overexpressing keratinocytes (KCs). (B) Co-IP assay of K17-binding protein in Pso Mix-treated KCs and K17-overexpressing KCs (n = 3 experiments). (C) Gene expression profile in the GEO dataset (GDS4602) was analyzed for the mRNA expression of ENO1 in psoriatic lesional skin (n = 57), psoriatic nonlesional skin (n = 56) and healthy controls (n = 63). (D) Immunofluorescence staining of ENO1 in the lesional skin of psoriasis patients (n = 3) and skin of healthy controls (n = 3). ENO1 (green) and Hoechst (blue). Scale bar, 50 μm. (E) ENO1 protein and mRNA levels in psoriatic lesional skin (n = 3) vs. healthy skin (n = 3). (F) Immunofluorescence staining of ENO1 in KCs treated with Pso Mix. ENO1 (green) and Hoechst (blue). Scale bar, 10 μm. (G) ENO1 protein and mRNA levels in KCs treated with Pso Mix. (H) Relative activity of ENO1 in KCs treated with Pso Mix, K17 siRNA-transfected KCs and K17-overexpressing KCs. (I, J) Immunofluorescence staining of ENO1 in IMQ-induced psoriasis-like mouse lesional skin of K17 WT and K17 knockout mice (n = 5). ENO1 (green) and Hoechst (blue). Scale bar, 50 μm. Data are presented as the mean ± SEM (n = 3-5). *p<0.05, **p<0.01, ***p<0.001, ns, not significant. p values were calculated by unpaired Student's t test. All experiments were repeated at least three times.
Figure 3
Figure 3
Loss of ENO1 inhibits glycolysis and proliferation of psoriatic KCs. (A) Relative ENO1 activity in keratinocytes (KCs) treated with the ENO1 inhibitor ENOBlock (n = 3). (B) The extracellular acid ratio (ECAR), (C) intracellular ATP levels, (D) extracellular lactate production and (E) the uptake of glucose were analyzed in KCs treated with the ENO1 inhibitor ENOBlock. (n = 3). (F) Cell proliferation was analyzed by Cell Counting Kit-8 (CCK8) assay, (G) EdU assay, the percentage of EdU positive cells and (H) PCNA protein levels in KCs treated with the ENO1 inhibitor ENOBlock. (I) Ear phenotype and H&E staining of lesional skin sections. Scale bar, 10 μm. (J) Epidermal thickness and (K) immunofluorescence staining of Ki67 in lesional skin from ENO1 inhibitor ENOBlock-treated IMQ-induced psoriasis-like mice; DMSO was used as a control (n = 3-5). Ki67 (red) and Hoechst (blue). Scale bar, 50 μm. Data are presented as the mean ± SEM (n = 3-5). *p<0.05, **p<0.01, ***p<0.001. p values were calculated by unpaired Student's t test. All experiments were repeated at least three times.
Figure 4
Figure 4
ENO1 promotes cell glycolysis and proliferation by regulating the phosphorylation of K17. (A) Protein expression of phosphorylated K17, K17 and ENO1 in keratinocytes (KCs) treated with Pso Mix, K17-overexpressing KCs and K17 siRNA-transfected KCs. (B) Phosphorylation of K17 in KCs treated with Pso Mix and ENO1 siRNA-transfected or ENOBlock-treated KCs. (C) RSK1 kinase activity in Pso Mix and ENO1 siRNA-transfected, ENOBlock-treated and BI-D1870-treated KCs. (D) The extracellular acid ratio (ECAR) of K17 S44A mutant-transfected KCs. (E) Cell proliferation was analyzed using the CCK8 assay, (F) EdU assay and the percentage of EdU positive cells in mutant K17 S44A-transfected KCs. (G) Immunofluorescence staining for the punctate form of EGFP-K17 in BI-D1870-treated EGFP-K17-transfected KCs (n = 3). K17 (green) and Hoechst (blue). Scale bar, 10 μm. (H) The ECAR of Pso Mix and BI-D1870-treated KCs. (I) Cell proliferation was analyzed by a CCK8 assay in BI-D1870-treated KCs. Data are presented as the mean ± SEM (n = 3-5). *p<0.05, **p<0.01, ***p<0.001. p values were calculated by unpaired Student's t test. All experiments were repeated at least three times.
Figure 5
Figure 5
Phosphorylation of K17-Ser44 promotes its translocation to the nucleus. (A) Immunofluorescence staining for K17 in the nucleus of keratinocytes (KCs) of lesional skin from psoriasis patients (n = 3). K17 (green) and Hoechst (blue). Scale bar, 10 μm. (B) Immunofluorescence staining of K17 distributed in the nuclei of KCs transfected with EGFP-K17 and treated with Pso Mix and the intensity of nuclear fluorescence per unit area. Scale bar, 10 μm. (C) K17 and phosphorylated K17-Ser44 protein levels in the nucleus and cytoplasm of K17-overexpressing and Pso Mix-treated KCs. (D) Immunofluorescence staining for the punctate form of EGFP-K17 in ENO1 siRNA-transfected, ENOBlock- or BI-D1870-treated EGFP-K17-transfected KCs (n = 3). K17 (green), ENO1 (red) and Hoechst (blue). White arrows: the punctate and diffuse forms of EGFP-K17. Scale bar, 10 μm. (E) K17 and phosphorylated K17-Ser44 protein levels in the nucleus and cytoplasm of Pso Mix and ENO1 siRNA-transfected or ENOBlock-treated KCs. (F) K17 and phosphorylation of K17-Ser44 protein levels in the nucleus and cytoplasm of Pso Mix and RSK kinase inhibitor BI-D1870-treated KCs. Data are presented as the mean ± SEM (n = 3-5). ChIP assays of K17 binding to the LDHA promoter in (G) K17-overexpressing KCs and (H) BI-D1870-treated K17-overexpressing KCs. (I) Luciferase reporter assays in HEK293T cells to test the LDHA WT and mutants. *p<0.05, **p<0.01, ***p<0.001, ns, not significant. p values were calculated by unpaired Student's t test. All experiments were repeated at least three times.
Figure 6
Figure 6
Inhibiting the phosphorylation of K17 significantly alleviated skin inflammation in IMQ-induced psoriasis-like mice. (A) Schematic of the animal experimental protocol for IMQ-induced psoriasis-like inflammation in K17 KO and K17 WT mice and examination of Δear thickness. (B) Psoriatic phenotype and hematoxylin and eosin (H&E) staining, Scale bar, 10 μm. (C) Epidermal thickness and (D) immunofluorescence staining of Ki67 and the percentage of Ki67+ cells. Ki67 (red) and Hoechst (blue). Scale bar, 50 μm. (E) Relative mRNA expression of GLUT1, PFKM, LDHA, HK2, PKM2, ENO1 and PGK1 in IMQ-induced psoriasis-like inflammation in K17 KO and K17 WT mice. (F) Schematic of the animal experimental protocol in mice with depression of K17 phosphorylation and examination of Δear thickness, n = 3 per group. (G) Ear phenotype and H&E staining. Scale bar, 10 μm. (H) Epidermal thickness and (I) immunofluorescence staining of Ki67 and the percentage of Ki67+ cells. Ki67 (red) and Hoechst (blue). Scale bar, 50 μm. (J) Relative mRNA expression of GLUT1, PFKM, LDHA, HK2, PKM2, ENO1 and PGK1. The study involved 3-5 mice per group. Data are presented as the mean ± SEM (n = 3-5). *p<0.05, **p<0.01, ***p<0.001, ns, not significant. p values were calculated by unpaired Student's t test or one-way ANOVA. All experiments were repeated at least three times.
Figure 7
Figure 7
Graphical summary of K17 in dysregulated proliferation in psoriasis. In psoriatic lesional skin, keratinocytes (KCs) are activated, and K17 is excessively elevated and interacts with ENO1, which maintains the phosphorylation of K17-Ser44 to promote K17 nuclear translocation and further regulates the transcription of the key glycolysis enzyme lactic dehydrogenase A (LDHA) to contribute to glycolysis and the proliferation of KCs, thereby exacerbating psoriatic inflammation (Figure was created with Biorender.com).

References

    1. Boehncke WH, Schon MP. Psoriasis. Lancet. 2015;386:983–94. - PubMed
    1. Greb JE, Goldminz AM, Elder JT, Lebwohl MG, Gladman DD, Wu JJ. et al. Psoriasis. Nat Rev Dis Primers. 2016;2:16082. - PubMed
    1. Hawkes JE, Chan TC, Krueger JG. Psoriasis pathogenesis and the development of novel targeted immune therapies. J Allergy Clin Immunol. 2017;140:645–653. - PMC - PubMed
    1. Yu J, Zhao Q, Wang X, Zhou H, Hu J, Gu L. et al. Pathogenesis, multiomics research, and clinical treatment of psoriasis. J Autoimmun. 2022;133:102916. - PubMed
    1. Fu M, Wang G. Keratin 17 as a therapeutic target for the treatment of psoriasis. J Dermatol Sci. 2012;67:161–5. - PubMed

Publication types