. 2023 Jul 25;2(7):pgad223.
doi: 10.1093/pnasnexus/pgad223. eCollection 2023 Jul.

Evidence for positive long- and short-term effects of vaccinations against COVID-19 in wearable sensor metrics

Affiliations

Evidence for positive long- and short-term effects of vaccinations against COVID-19 in wearable sensor metrics

Marc Wiedermann et al. PNAS Nexus. .

Abstract

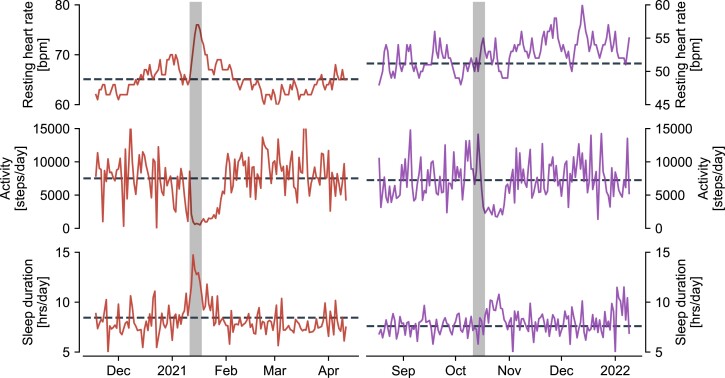
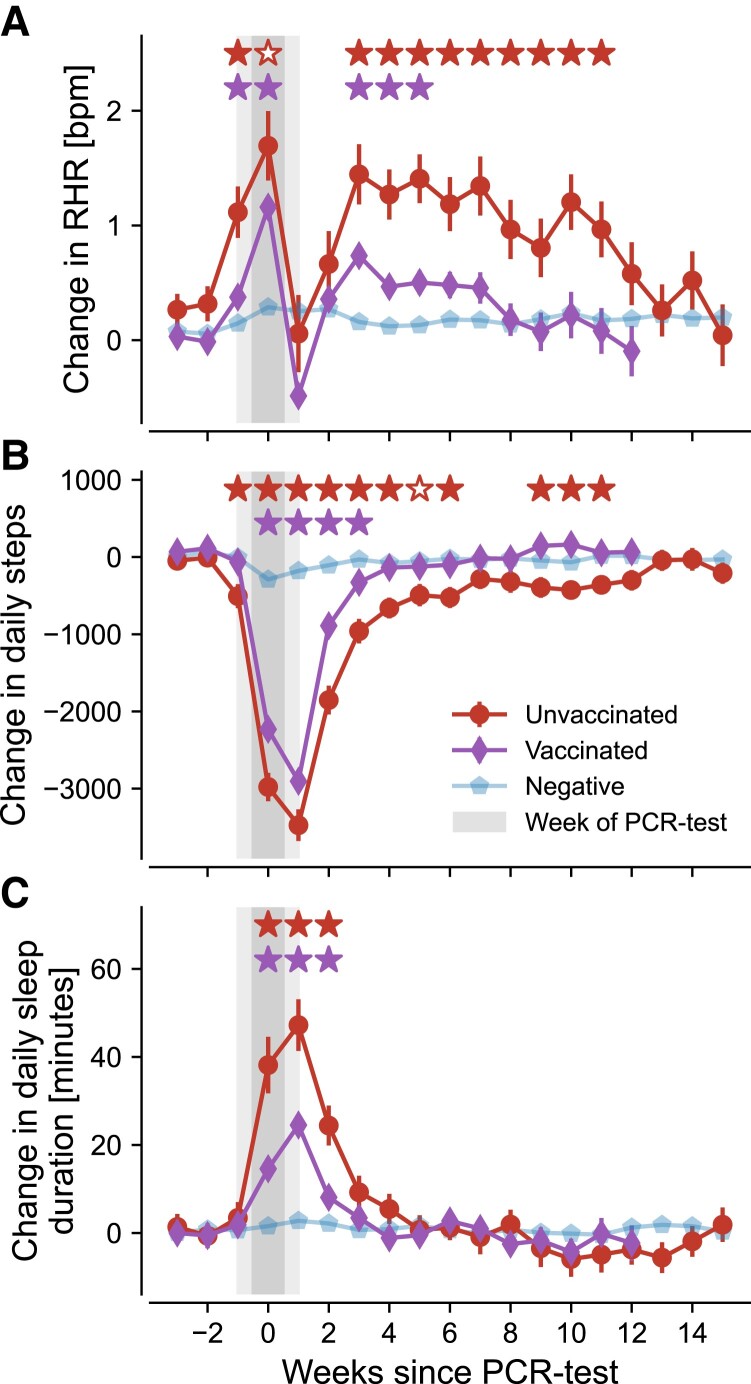
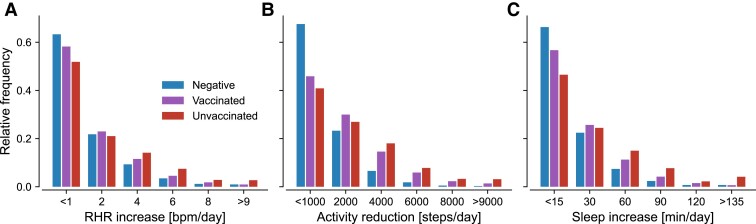
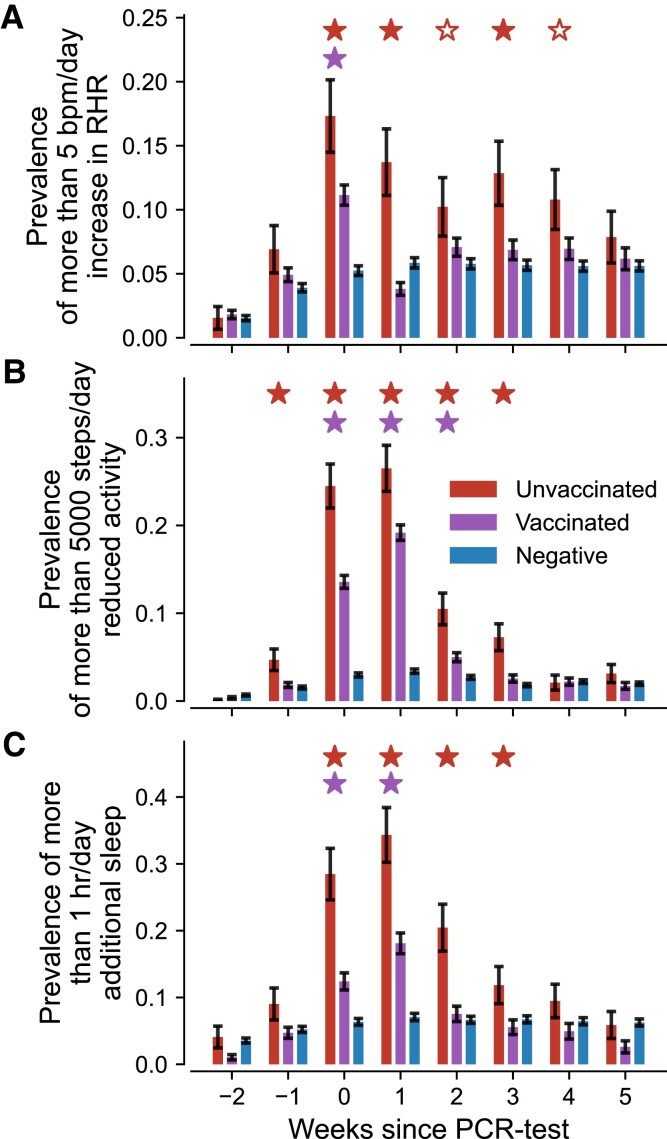
Vaccines are among the most powerful tools to combat the COVID-19 pandemic. They are highly effective against infection and substantially reduce the risk of severe disease, hospitalization, ICU admission, and death. However, their potential for attenuating long-term changes in personal health and health-related wellbeing after a SARS-CoV-2 infection remains a subject of debate. Such effects can be effectively monitored at the individual level by analyzing physiological data collected by consumer-grade wearable sensors. Here, we investigate changes in resting heart rate, daily physical activity, and sleep duration around a SARS-CoV-2 infection stratified by vaccination status. Data were collected over a period of 2 years in the context of the German Corona Data Donation Project with around 190,000 monthly active participants. Compared to their unvaccinated counterparts, we find that vaccinated individuals, on average, experience smaller changes in their vital data that also return to normal levels more quickly. Likewise, extreme changes in vitals during the acute phase of the disease occur less frequently in vaccinated individuals. Our results solidify evidence that vaccines can mitigate long-term detrimental effects of SARS-CoV-2 infections both in terms of duration and magnitude. Furthermore, they demonstrate the value of large-scale, high-resolution wearable sensor data in public health research.

Keywords: COVID-19; digital health; vaccination; wearable sensors.


Figures

Fig. 1.
Fig. 1.
Exemplary time series of daily resting heart rate (top), physical activity (middle), and sleep duration (bottom) for a time window of 150 days in two representative individuals who were unvaccinated (left) and vaccinated (right) at the time of taking a PCR test that returned positive (grey shading). Dashed lines denote the user’s baseline, i.e. the average of the 54 days prior to the test. We observe a strong peak in resting heart rate, a drop in physical activity and increased sleep duration for the unvaccinated individual around the time of the test. Similar patterns are observed for the vaccinated individual with respect to physical activity and sleep duration, the latter change being considerably less pronounced. A visible change of resting heart rate is absent for the vaccinated individual around the week of the test.
Fig. 2.
Fig. 2.
Changes in resting heart rate (RHR), activity, and sleep duration in unvaccinated infected (red circles) and vaccinated infected (purple diamonds) as well as negative controls (blue pentagons). Changes are measured relative to the 2 months preceding the test. Errors bars indicate standard error. Filled red stars (upper row of significance indicators in each panel) indicate that average vital changes of unvaccinated individuals were significantly stronger than for both vaccinated and negative individuals. Hollow red stars indicate that average vital changes of unvaccinated participants were only stronger compared to negative individuals but not compared to the vaccinated cohort. Purple stars (lower row of significance indicators in each panel) indicate significant differences between vaccinated and COVID-19 negative individuals. All three assessments use a one-sided Welch t-test with a significance level of α=0.01. Grey shading indicates the uncertainty in estimating the precise timing of a PCR test, since users only submit this information in terms of the respective calendar week. Results for the vaccinated infected cohort (purple diamonds) are only shown for the first 12 weeks after a positive PCR test due to insufficient data for later time periods. Individuals are considered part of the vaccinated cohort when they received at least two doses of mRNA vaccine.
Fig. 3.
Fig. 3.
Relative frequency of average vital changes in weeks 0 to 4 following a PCR test for vaccinated and unvaccinated COVID-19 positive as well as COVID-19 negative individuals. Numbers on the vertical axis indicate the center of each bin, except for the left- and right-most bins that include all data smaller or larger than the given values, respectively. Individuals are considered part of the vaccinated cohort when they received at least two doses of mRNA vaccine.
Fig. 4.
Fig. 4.
Share of individuals in each cohort whose weekly average vital changes exceeded a specified threshold. A) Share of individuals with more than 5 bpm/day RHR increase. B) Share of individuals with an activity reduction of more than 5,000 steps/day. C) Share of individuals with an increased sleep duration of more than 1 h/day. Red (left), purple (center), and blue (right) bars indicate weekly prevalences for the unvaccinated, vaccinated, and COVID-19 negative cohort, respectively. Error bars indicate the standard error of a binomial distribution. Filled red stars (upper row of significance indicators in each panel) indicate periods where the prevalences in unvaccinated individuals were stronger than for both vaccinated and negative individuals. Hollow red stars indicate periods where the prevalences in unvaccinated individuals were only stronger than that of negative individuals but not of the vaccinated cohort. Purple stars (lower row of significance indicators in each panel) indicate significant differences between vaccinated and COVID-19 negative individuals. All three assessments use a one-sided two proportion z-test with a significance level of α=0.01. Individuals are considered part of the vaccinated cohort when they received at least two doses of mRNA vaccine.

References

    1. Singhal T. 2020. A review of coronavirus disease-2019 (COVID-19). Indian J Pediatr. 87:281–286. - PMC - PubMed
    1. Nalbandian A, et al. 2021. Post-acute COVID-19 syndrome. Nat Med. 27:601–615. - PMC - PubMed
    1. Wynberg E, et al. 2021. Evolution of coronavirus disease 2019 (COVID-19) symptoms during the first 12 months after illness onset. Clin Infect Dis. 75:ciab759. - PMC - PubMed
    1. Michelen M, et al. 2021. Characterising long COVID: a living systematic review. BMJ Global Health. 6:e005427. - PMC - PubMed
    1. Soriano JB, Murthy S, Marshall JC, Relan P, Diaz JV. 2021. A clinical case definition of post-COVID-19 condition by a Delphi consensus. Lancet Infect Dis. 22:e102–e107. - PMC - PubMed