. 2023 Jul 25;3(7):1335-1349.
doi: 10.1158/2767-9764.CRC-23-0036. eCollection 2023 Jul.

Validation of Immunotherapy Response Score as Predictive of Pan-solid Tumor Anti-PD-1/PD-L1 Benefit

Affiliations

Validation of Immunotherapy Response Score as Predictive of Pan-solid Tumor Anti-PD-1/PD-L1 Benefit

Benjamin J Bulen et al. Cancer Res Commun. .

Abstract

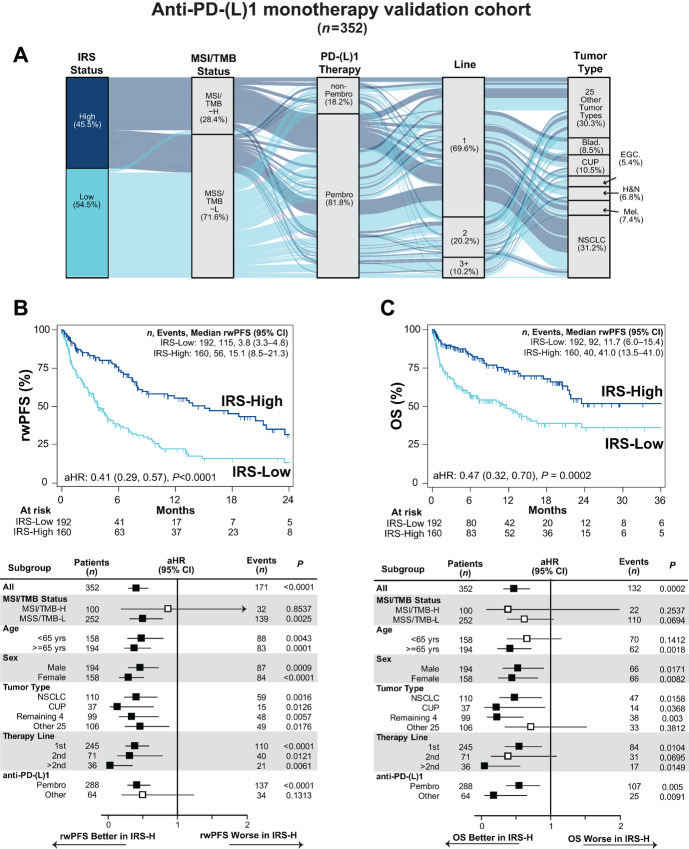
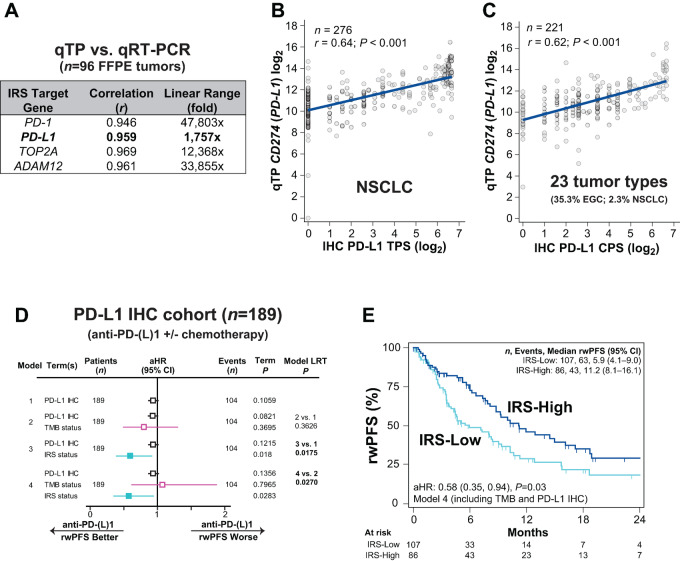
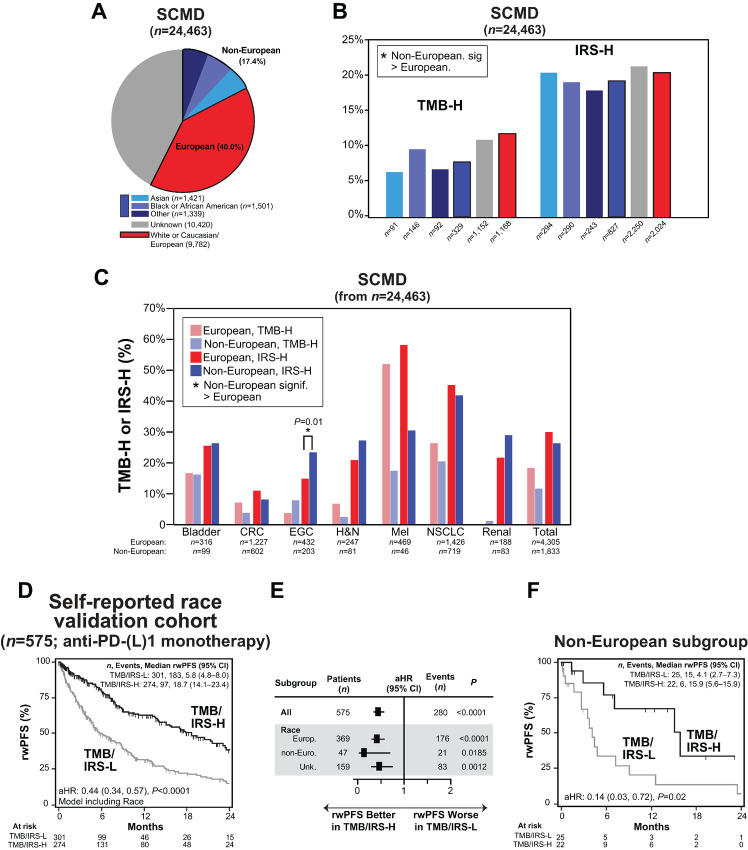
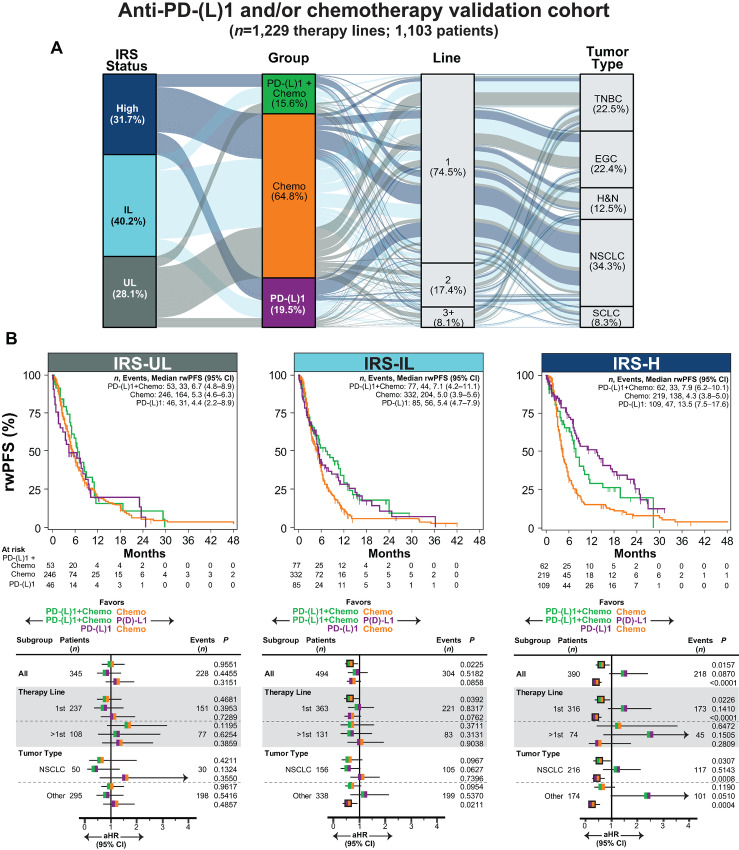
Immunotherapy response score (IRS) integrates tumor mutation burden (TMB) and quantitative expression biomarkers to predict anti-PD-1/PD-L1 [PD-(L)1] monotherapy benefit. Here, we evaluated IRS in additional cohorts. Patients from an observational trial (NCT03061305) treated with anti-PD-(L)1 monotherapy were included and assigned to IRS-High (-H) versus -Low (-L) groups. Associations with real-world progression-free survival (rwPFS) and overall survival (OS) were determined by Cox proportional hazards (CPH) modeling. Those with available PD-L1 IHC treated with anti-PD-(L)1 with or without chemotherapy were separately assessed. Patients treated with PD-(L)1 and/or chemotherapy (five relevant tumor types) were assigned to three IRS groups [IRS-L divided into IRS-Ultra-Low (-UL) and Intermediate-Low (-IL), and similarly assessed]. In the 352 patient anti-PD-(L)1 monotherapy validation cohort (31 tumor types), IRS-H versus IRS-L patients had significantly longer rwPFS and OS. IRS significantly improved CPH associations with rwPFS and OS beyond microsatellite instability (MSI)/TMB alone. In a 189 patient (10 tumor types) PD-L1 IHC comparison cohort, IRS, but not PD-L1 IHC nor TMB, was significantly associated with anti-PD-L1 rwPFS. In a 1,103-patient cohort (from five relevant tumor types), rwPFS did not significantly differ in IRS-UL patients treated with chemotherapy versus chemotherapy plus anti-PD-(L)1, nor in IRS-H patients treated with anti-PD-(L)1 versus anti-PD-(L)1 + chemotherapy. IRS associations were consistent across subgroups, including both Europeans and non-Europeans. These results confirm the utility of IRS utility for predicting pan-solid tumor PD-(L)1 monotherapy benefit beyond available biomarkers and demonstrate utility for informing on anti-PD-(L)1 and/or chemotherapy treatment.

Significance: This study confirms the utility of the integrative IRS biomarker for predicting anti-PD-L1/PD-1 benefit. IRS significantly improved upon currently available biomarkers, including PD-L1 IHC, TMB, and MSI status. Additional utility for informing on chemotherapy, anti-PD-L1/PD-1, and anti-PD-L1/PD-1 plus chemotherapy treatments decisions is shown.


Figures

FIGURE 1
FIGURE 1
Validation of IRS to stratify anti-PD-(L)1 monotherapy benefit in patients with advanced solid tumors. A, Clinical characteristics of the anti-PD-(L)1 monotherapy validation cohort are shown in an alluvial diagram. All patients with available clinical molecular profiling data necessary for IRS (TMB and normalized expression of PD-1, PD-L1, ADAM12, and TOP2A from in-parallel qTP) from FFPE tumor tissue enrolled in the Strata Trial (NCT03061305) and treated with systemic anti-PD-(L)1 monotherapy were considered. Patients in previous IRS discovery or validation were excluded. The locked IRS model and thresholds were used to assign IRS-L (light blue) or IRS-H (increased benefit; dark blue) status. For the 352 eligible patients, IRS status, MSI/TMB status (MSI-H or TMB-H as MSI/TMB-H), type of anti-PD-(L)1 therapy [pembrolizumab (pembro) vs. other anti-PD-(L)1], systemic line of anti-PD-(L)1 therapy, and tumor type [all tumor types with >15 samples considered individually: NSCLC, cancer of unknown primary (CUP), bladder cancer (Blad.), melanoma (Mel.), head and neck cancer (H&N), and EGC; remaining 25 other tumor types considered together] are shown. Stratum are colored by IRS status. IRS stratifies anti-PD-(L)1 monotherapy clinical benefit by rwPFS (by time to next therapy; B) and OS (C). B, Anti-PD-(L)1 monotherapy rwPFS stratified by IRS group is shown by unadjusted Kaplan–Meier analysis, with the aHR [adjusted for age, sex assigned at birth, line of therapy, tumor type and anti-PD-(L)1 therapy type], 95% CI and P value for IRS status (IRS-H vs. IRS-L) shown. The number (n) of patients, events, and median rwPFS (with 95% CI) for each group are shown. Forest plot analyses of rwPFS by IRS status in key subgroups are shown below (Remaining 4 = Blad., Mel., H&N, and EGC). Significant associations are shown by filled in aHR estimates. C, As in B, except assessing OS.
FIGURE 2
FIGURE 2
Confirmation of the added utility of the IRS versus clinical PD-L1 IHC and TMB alone. A, Normalized PD-L1 (CD274) expression (and the other IRS expression components) by the qTP platform used to generate IRS were validated versus qRT-PCR in a validation cohort of 96 FFPE tumor tissue samples tested by clinical CGP and in parallel qTP. The Pearson correlation and linear range of each component is shown (Supplementary Fig. S1). B and C, The Pearson correlation of normalized PD-L1 expression by qTP [log2 normalized reads per million (nRPM) units] versus clinical PD-L1 IHC score (in submitted pathology reports) was determined in two cohorts of clinical FFPE tumor tissues [regardless of TMB availability and anti-PD-(L)1 treatment]. B, PD-L1 expression by qTP (log2 normalized units) versus PD-L1 IHC by TPS [using the 22C3 antibody clone (log2 TPS) in 276 clinically tested FFPE NSCLC tumors with available TPS is plotted]. The linear fit, Pearson correlation (r), and P value are shown. C, PD-L1 expression by qTP versus PD-L1 IHC by CPS using the 22C3 antibody clone (log2 CPS) in 221 clinically tested FFPE tumors (23 tumor types; most frequently EGC) with available TPS is plotted. The linear fit, Pearson correlation (r), and P value are shown. D, Using B and C, we identified a cohort of all 189 eligible NCT03061305 patients with IRS and PD-(L)1 IHC in accompanying pathology reports who were treated with anti-PD-(L)1 therapy (± chemotherapy). The association of biomarkers with anti-PD-(L)1 rwPFS was determined by Cox proportional hazards modeling [adjusting for age, sex assigned at birth, line of therapy, tumor type, therapy type (monotherapy vs. chemotherapy combination), and inclusion in IRS discovery status]. PD-L1 IHC score (continuous; log2) was included in the baseline model (Model 1), with the aHR, 95% CI, number (n) of patients and events, and P value shown for the biomarker term by forest plot. TMB status (-H vs. -L; pink) and IRS status (-H vs. -L; light blue) were separately added to this model (Models 2 and 3, respectively). The significance of each biomarker term is shown and the P value of the LRT comparing the full (Model 2 or 3) versus reduced (Model 1) model is shown. Model 4 includes PD-L1 IHC, TMB, and IRS. Significant biomarker terms are shown by filled in aHR estimates. E, Anti-PD-(L)1 rwPFS stratified by IRS group is shown by unadjusted Kaplan–Meier analysis, with the aHR from Model 4 in D shown. See Supplementary Table S7 for full subgroup analysis.
FIGURE 3
FIGURE 3
IRS is robust to self-reported race. A, Pie chart of self-reported race for all 24,463 patients in the SCMD with informative TMB and gene expression data needed to generate IRS regardless of treatment history (SCMD lock at the time of IRS development). The total number of patients in each racial group is shown. B, The percentage of TMB-H and IRS-H patients from the SCMD (n = 24,463 as in A stratified by self-reported race is plotted). Fisher exact test was used to test the differences in IRS-H (or TMB-H) between the White or Caucasian/European group and all other groups; groups where IRS-H (or TMB-H) was significantly greater (P < 0.05) versus the White or Caucasian group (potentially as a consequence of inappropriate filtering of germline variants in TMB determination for non-White or Caucasian groups) are indicated by *. Asian, Black or African American and Other groups were also considered together as non-European (blue). C, Further breakdown by TMB and IRS status and relevant tumor types. The percentage of IRS-H (bold hue) and TMB-H (light hue) stratified by White or Caucasian/European (red) and non-European (blue) self-reported race is plotted for the n = 6,138 total patients from A and B with one of the seven indicated primary tumor types (CRC = colorectal, EGC = esophagogastric, H&N = head and neck, Mel = melanoma, NSCLC = non–small cell lung carcinoma). The total number of European and non-European patients with each tumor type are indicated. D, Across eligible NCT03061305 patients treated with anti-PD-(L)1 monotherapy, we identified a validation cohort of all 575 patients not included in IRS discovery to assess the robustness of IRS (and the TMB component) to self-reported race. Anti-PD-(L)1 monotherapy rwPFS stratified by combined TMB and IRS status [TMB-H or IRS-H (TMB/IRS-H; black) vs. TMB-L and IRS-L (TMB/IRS-L; gray)] is shown (left) by unadjusted Kaplan–Meier analysis with the aHR [adjusted for age, sex assigned at birth, line of therapy, tumor type, anti-PD-(L)1 therapy type, inclusion in previous validation cohort, and self-reported race (non-European, unknown, or European)], 95% CI and P value for TMB/IRS status (TMB/IRS-H vs. TMB/IRS-L) shown. The number (n) of patients, events, and median rwPFS (with 95% CI) for each group are shown. E, Forest plot of rwPFS by IRS status in the cohort (all) and each self-reported racial group is shown. Significant associations are shown by filled in aHR estimates. F, Anti-PD-(L)1 monotherapy rwPFS stratified by TMB/IRS status is shown by unadjusted Kaplan–Meier analysis for the non-European subgroup (as in the overall cohort).
FIGURE 4
FIGURE 4
Validation of IRS to stratify anti-PD-(L)1, chemotherapy and anti-PD-(L)1 + chemotherapy benefit in relevant tumor types. A, Clinical characteristics of the anti-PD-(L)1 and/or chemotherapy (chemo) validation cohort are shown in an alluvial diagram. Across all eligible NCT03061305 patients treated with anti-PD-(L)1 monotherapy, chemotherapy, or anti-PD-(L)1 + chemotherapy, we identified a validation cohort of 1,229 total eligible therapy lines (from 1,103 patients) in five relevant tumor types with anti-PD-(L)1 and/or chemotherapy treatment decisions: NSCLC, TNBC, EGC, H&N, and SCLC. Anti-PD-(L)1 ± chemotherapy lines used in IRS training were excluded. The IRS model and three-group classification thresholds were used to assign IRS-UL (gray), IRS-IL (light blue), and IRS-H (dark blue) status. For all 1,229 eligible therapy lines, IRS status, treatment group [PD-(L)1: purple; chemo: orange; PD-(L)1+chemo green], the systemic line of treatment, and tumor types are shown. Stratum are colored by IRS status. B, rwPFS by treatment group is shown separately for each IRS group by unadjusted Kaplan–Meier analysis. The number (n) of patients, events, and median rwPFS (with 95% CI) are shown. Treatment group outcomes were compared in each IRS group by Cox proportional hazards modeling (adjusting for age, gender, treatment group, line of therapy, tumor type, and PD-L1 RNA expression). Forest plots were used to visualize the aHR for each treatment group comparison, with the 95% CI, number of patients and events, and P value for each comparison shown. aHR estimates are colored by the treatment group comparison and significant associations are shown by outlined aHR estimates. In addition to the entire cohort (All), key subgroups are shown. See Supplementary Fig. S6 for covariate adjusted plots, Supplementary Fig. S7 for overlap weighting propensity score analysis, and Supplementary Table S12 for full subgroup analysis.

References

    1. Sharma P, Siddiqui BA, Anandhan S, Yadav SS, Subudhi SK, Gao J, et al. The next decade of immune checkpoint therapy. Cancer Discov 2021;11:838–57. - PubMed
    1. Chamoto K, Hatae R, Honjo T. Current issues and perspectives in PD-1 blockade cancer immunotherapy. Int J Clin Oncol 2020;25:790–800. - PMC - PubMed
    1. Ribas A, Wolchok JD. Cancer immunotherapy using checkpoint blockade. Science 2018;359:1350–5. - PMC - PubMed
    1. Marabelle A, Fakih M, Lopez J, Shah M, Shapira-Frommer R, Nakagawa K, et al. Association of tumour mutational burden with outcomes in patients with advanced solid tumours treated with pembrolizumab: prospective biomarker analysis of the multicohort, open-label, phase 2 KEYNOTE-158 study. Lancet Oncol 2020;21:1353–65. - PubMed
    1. Cristescu R, Aurora-Garg D, Albright A, Xu L, Liu XQ, Loboda A, et al. Tumor mutational burden predicts the efficacy of pembrolizumab monotherapy: a pan-tumor retrospective analysis of participants with advanced solid tumors. J Immunother Cancer 2022;10:e003091. - PMC - PubMed

Publication types

Substances