. 2023 Jul 11:11:1167762.
doi: 10.3389/fcell.2023.1167762. eCollection 2023.

Expression of SRP-9001 dystrophin and stabilization of motor function up to 2 years post-treatment with delandistrogene moxeparvovec gene therapy in individuals with Duchenne muscular dystrophy

Affiliations

Expression of SRP-9001 dystrophin and stabilization of motor function up to 2 years post-treatment with delandistrogene moxeparvovec gene therapy in individuals with Duchenne muscular dystrophy

Jerry R Mendell et al. Front Cell Dev Biol. .

Abstract

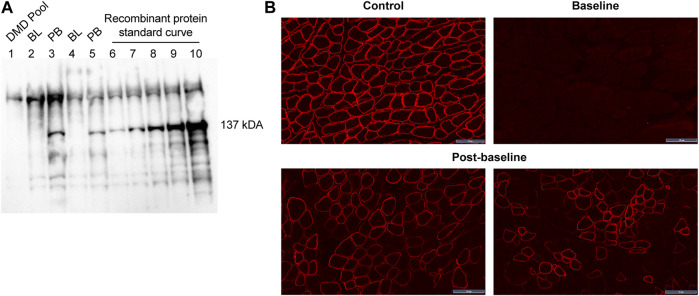
Introduction: Delandistrogene moxeparvovec (SRP-9001) is an investigational gene transfer therapy designed for targeted expression of SRP-9001 dystrophin protein, a shortened dystrophin retaining key functional domains of the wild-type protein. Methods: This Phase 2, double-blind, two-part (48 weeks per part) crossover study (SRP-9001-102 [Study 102]; NCT03769116) evaluated delandistrogene moxeparvovec in patients, aged ≥4 to <8 years with Duchenne muscular dystrophy. Primary endpoints (Part 1) were change from baseline (CFBL) in SRP-9001 dystrophin expression (Week 12), by Western blot, and in North Star Ambulatory Assessment (NSAA) score (Week 48). Safety assessments included treatment-related adverse events (TRAEs). Patients were randomized and stratified by age to placebo (n = 21) or delandistrogene moxeparvovec (n = 20) and crossed over for Part 2. Results: SRP-9001 dystrophin expression was achieved in all patients: mean CFBL to Week 12 was 23.82% and 39.64% normal in Parts 1 and 2, respectively. In Part 1, CFBL to Week 48 in NSAA score (least-squares mean, LSM [standard error]) was +1.7 (0.6) with treatment versus +0.9 (0.6) for placebo; p = 0.37. Disparity in baseline motor function between groups likely confounded these results. In 4- to 5-year-olds with matched baseline motor function, CFBL to Week 48 in NSAA scores was significantly different (+2.5 points; p = 0.0172), but not significantly different in 6-to-7-year-olds with imbalanced baseline motor function (-0.7 points; p = 0.5384). For patients treated with delandistrogene moxeparvovec in Part 2, CFBL to Week 48 in NSAA score was +1.3 (2.7), whereas for those treated in Part 1, NSAA scores were maintained. As all patients in Part 2 were exposed to treatment, results were compared with a propensity-score-weighted external control (EC) cohort. The LSM difference in NSAA score between the Part 2 treated group and EC cohort was statistically significant (+2.0 points; p = 0.0009). The most common TRAEs were vomiting, decreased appetite, and nausea. Most occurred within the first 90 days and all resolved. Discussion: Results indicate robust expression of SRP-9001 dystrophin and overall stabilization in NSAA up to 2 years post-treatment. Differences in NSAA between groups in Part 1 were not significant for the overall population, likely because cohorts were stratified only by age, and other critical prognostic factors were not well matched at baseline.

Keywords: AAVrh74; Duchenne muscular dystrophy; SRP-9001; dystrophin; gene therapy.


Conflict of interest statement

DG, SL, SW, RP, TS, LRR-K are empolyed by Sarepta Therapeutics Inc. The remaining authors declare that the research was conducted in the absence of any commercial or financial relationships that could be construed as a potential conflict of interest.

Figures

FIGURE 1
FIGURE 1
Study design. All patients in Part 1 received 2.0 × 10¹⁴ vg/kg, as determined by the supercoiled standard qPCR method specified in the protocol at the time. The 2.0 × 10¹⁴ vg/kg dose was estimated by supercoiled qPCR and is equivalent to 1.33 × 10¹⁴ vg/kg using the linear qPCR method. Retrospective analysis of the treatment lots by linear qPCR, the method utilized in Part 2 and subsequent studies of delandistrogene moxeparvovec, found variability in the doses administered in Part 1, such that: 30% (6/20) of patients received 8.94 × 10¹³ vg/kg, 30% (6/20) of patients received 6.29 × 10¹³ vg/kg, 40% (8/20) of patients received the correct linear equivalent of 2.0 × 10¹⁴ vg/kg delandistrogene moxeparvovec, 1.33 × 10¹⁴ vg/kg, and 100% (21/21) of patients treated in Part 2 received 1.33 × 10¹⁴ vg/kg. IV, intravenous; NSAA, North Star Ambulatory Assessment; OLE, open-label extension; qPCR, quantitative polymerase chain reaction.
FIGURE 2
FIGURE 2
Patient disposition. *Two patients did not receive placebo in Part 2: one patient had to be tapered off of steroids due to a steroid-related AE and one patient required elective surgery for a femur fracture that required significant recovery time; both patients continue to be followed for efficacy and safety. AE, adverse event.
FIGURE 3
FIGURE 3
Primary functional endpoint: Change in NSAA score from baseline to Week 48 (Part 1) (A) depicts the CFBL to Week 48 in NSAA total score in the intent-to-treat population; (B) depicts the analysis of the 4- to 5-year-old subgroup; (C) depicts the analysis of the 6- to 7-year-old subgroup. *Patients who received placebo in Part 1 and delandistrogene moxeparvovec in Part 2. Patients who received delandistrogene moxeparvovec in Part 1 and placebo in Part 2. Two patients did not receive placebo in Part 2: one patient had to be tapered off of steroids due to a steroid-related AE and one patient required elective surgery for a femur fracture that required significant recovery time; both patients continue to be followed for efficacy and safety. AE, adverse event; BL, baseline; CFBL, change from baseline; LSM, least-squares mean; NSAA, North Star Ambulatory Assessment; SE, standard error.
FIGURE 4
FIGURE 4
NSAA score change from baseline after treatment with delandistrogene moxeparvovec (Parts 1 and 2). Part 2 baseline values are given as this is when patients who were treated in Part 2 received delandistrogene moxeparvovec. BL, baseline; LSM, least-squares mean; NSAA, North Star Ambulatory Assessment; SE, standard error.
FIGURE 5
FIGURE 5
Patients treated with delandistrogene moxeparvovec in Part 1 versus EC cohort: NSAA analyses (A) shows the LSM* CFBL to Week 96 in NSAA total score for the delandistrogene moxeparvovec overall cohort treated in Part 1 versus EC cohort; (B) shows the median CFBL to Week 96 in NSAA total score for the delandistrogene moxeparvovec overall cohort treated in Part 1 versus EC; boxes represent interquartile range and bars represent the minimum and maximum range. *LSM from weighted linear regression. †For the 96-week (2-year) comparator group, EC data were only available for 51 participants. 1. Clinicaltrials.gov, 2012; Clinicaltrials.gov, 2013; Clinicaltrials.gov, 2016. CFBL, change from baseline; EC, external control; LSM, least-squares mean; NSAA, North Star Ambulatory Assessment; SE, standard error.
FIGURE 6
FIGURE 6
Patients treated with delandistrogene moxeparvovec in Part 2 versus EC cohort: NSAA analyses. The mean CFBL to Week 48 in NSAA total score was +1.3 points for patients treated in Part 2 versus −0.7 points for the EC cohort. *For the 48-week (1-year) comparator group, EC data were only available for 103 participants. †The p-value was calculated based on weighted ANCOVA adjusted for age and baseline NSAA (Clinicaltrials.gov, 2012; Clinicaltrials.gov, 2013; Clinicaltrials.gov, 2016). ANCOVA, analysis of covariance; CFBL, change from baseline; EC, external control; LSM, least-squares mean; NSAA, North Star Ambulatory Assessment; SE, standard error.
FIGURE 7
FIGURE 7
SRP-9001 dystrophin protein expression at 12 weeks post-infusion (A) shows a representative Western blot for SRP-9001 dystrophin. Lanes 1–5 indicate: DMD pool (negative control), BL, PB, BL, PB; Lanes 6–10: Recombinant micro-dystrophin protein standard curve (21.85, 43.70, 87.39, 174.79, 349.58 fmol/mg). The 137 kDa band denotes the presence of SRP-9001 dystrophin; (B) shows representative IF images of biopsied sections of gastrocnemius muscle stained with dystrophin antibody. Top panel: L to R: normal expression in control tissue, pre-treatment BL expression; Lower panel: select images of Week 12 post-baseline expression. Scale bar, 50 µm. BL, baseline; DMD, Duchenne muscular dystrophy; IF, immunofluorescence; PB, post-baseline.

References

    1. Birnkrant D. J., Bushby K., Bann C. M., Apkon S. D., Blackwell A., Brumbaugh D., et al. (2018). Diagnosis and management of Duchenne muscular dystrophy, part 1: Diagnosis, and neuromuscular, rehabilitation, endocrine, and gastrointestinal and nutritional management. Lancet Neurol. 17, 251–267. 10.1016/S1474-4422(18)30024-3 - DOI - PMC - PubMed
    1. Charleston J. S., Schnell F. J., Dworzak J., Donoghue C., Lewis S., Chen L., et al. (2018). Eteplirsen treatment for Duchenne muscular dystrophy: Exon skipping and dystrophin production. Neurology 90, 2146–2154. 10.1212/WNL.0000000000005680 - DOI - PubMed
    1. Clinicaltrials.gov (2012). NCT01603407: Finding the optimum regimen for Duchenne muscular dystrophy (FOR-DMD). Available: https://www.clinicaltrials.gov/ct2/show/NCT01603407 (Accessed February 3, 2023).
    1. Clinicaltrials.gov (2013). NCT01865084: A study of tadalafil for Duchenne muscular dystrophy. Available At: https://clinicaltrials.gov/ct2/show/NCT01865084 (Accessed February 3, 2023).
    1. Clinicaltrials.gov (2016). NCT00468832: Longitudinal study of the natural history of Duchenne muscular dystrophy (DMD). Available: https://clinicaltrials.gov/ct2/show/NCT00468832 (Accessed February 3, 2023).