. 2023 Jun 26:11:1204160.
doi: 10.3389/fcell.2023.1204160. eCollection 2023.

PU.1 is required to restrain myelopoiesis during chronic inflammatory stress

Affiliations

PU.1 is required to restrain myelopoiesis during chronic inflammatory stress

James S Chavez et al. Front Cell Dev Biol. .

Abstract

Chronic inflammation is a common feature of aging and numerous diseases such as diabetes, obesity, and autoimmune syndromes and has been linked to the development of hematological malignancy. Blood-forming hematopoietic stem cells (HSC) can contribute to these diseases via the production of tissue-damaging myeloid cells and/or the acquisition of mutations in epigenetic and transcriptional regulators that initiate evolution toward leukemogenesis. We previously showed that the myeloid "master regulator" transcription factor PU.1 is robustly induced in HSC by pro-inflammatory cytokines such as interleukin (IL)-1β and limits their proliferative activity. Here, we used a PU.1-deficient mouse model to investigate the broader role of PU.1 in regulating hematopoietic activity in response to chronic inflammatory challenges. We found that PU.1 is critical in restraining inflammatory myelopoiesis via suppression of cell cycle and self-renewal gene programs in myeloid-biased multipotent progenitor (MPP) cells. Our data show that while PU.1 functions as a key driver of myeloid differentiation, it plays an equally critical role in tailoring hematopoietic responses to inflammatory stimuli while limiting expansion and self-renewal gene expression in MPPs. These data identify PU.1 as a key regulator of "emergency" myelopoiesis relevant to inflammatory disease and leukemogenesis.

Keywords: PU.1; hematopoiesis; hematopoietic progenitor cell; hematopoietic stem cell; inflammation; myelopoiesis.


Conflict of interest statement

The authors declare that the research was conducted in the absence of any commercial or financial relationships that could be construed as a potential conflict of interest.

Figures

FIGURE 1
FIGURE 1
Chronic IL-1 triggers myeloid cell overproduction in PU.1-deficient mice. (A) Study design. PU.1 +/+ and PU.1 KI/KI mice were treated for 20d ± IL-1β. (B) Complete blood count (CBC) analysis of myeloid cells in peripheral blood (n = 8–10/grp); box represents upper and lower quartiles with line representing median value. Whiskers represent minimum and maximum values. (C) Quantification of splenic granulocytes (Gr) and (D) representative FACS plots of splenic myeloid populations; individual values are shown with bars representing means. Error bars represent S.D. Data are compiled from two independent experiments. (E) Abundance of granulocytes, pre-granulocytes (Pre Gr) and monocytes (Mon) in the bone marrow (BM) (n = 4–6/grp). Individual values are shown with bars representing means. Error bars represent S.D. Data are compiled from two independent experiments. Statistical analysis for datasets in B-E was performed using ANOVA with Tukey’s test; *p < 0.05; **p < 0.01; ***p < 0.001.
FIGURE 2
FIGURE 2
Chronic IL-1 induces aberrant expansion of PU.1-deficient MPPGM. (A) Study design. PU.1 +/+ and PU.1 KI/KI mice were treated for 20d ± IL-1β. (B) Representative flow cytometry plots and (C) number of granulocyte macrophage progenitors (GMP) in the four long bones of mice (n = 10–14/grp); individual values are shown with bars representing means. Error bars represent S.D. Data are compiled from three independent experiments. (D) Representative flow cytometry plots and (E) number of defined HSPC populations in the four long bones of mice (n = 10–14/grp); individual values are shown with bars representing means. Error bars represent S.D. Data are compiled from three independent experiments. MPPMkE: MkE-primed MPP; MPPGM: GM-primed MPP; MPPLy: Lymphoid-primed MPP. Statistical analysis for datasets in B-D was performed using ANOVA with Tukey’s test; *p < 0.05; **p < 0.01; ***p < 0.001.
FIGURE 3
FIGURE 3
Chronic IL-1 triggers aberrant cell cycle activity in PU.1-deficient MPPGM. (A) experiments. PU.1 +/+ and PU.1 KI/KI mice were treated for 20d ± IL-1β. (B) Quantification of cell cycle distribution in MPPGM (n = 4–5/grp). Stacked bars show means for each cell cycle phase measured. Error bars represent S.D. Data are compiled from two independent experiments. (C) Cell cycle gene expression in MPPGM (n = 8/group). Data are expressed as log10 fold expression versus -IL-1β. Box represents upper and lower quartiles with line representing median value. Whiskers represent minimum and maximum values. Data represent two independent experiments. Statistical analysis for datasets in B-C was performed using ANOVA with Tukey’s test; *p < 0.05; **p < 0.01; ***p < 0.001.
FIGURE 4
FIGURE 4
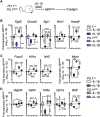
PU.1-deficient MPPGM retain expression of self-renewal genes under inflammatory stress. (A) Study design for Fluidigm qRT-PCR array studies. PU.1 +/+ and PU.1 KI/KI mice were treated for 20d ± IL-1β. (B) Quantification of genes associated with HSC function in MPPGM (n = 8/group). Quantification of (C) self-renewal-associated transcription factors and (D) target genes in MPPGM (n = 8/group). Data are expressed as log10 fold expression versus -IL-1β. Box represents upper and lower quartiles with line representing median value. Whiskers represent minimum and maximum values. Data are representative of two independent experiments. Statistical analysis for datasets in B-D was performed using ANOVA with Tukey’s test; *p < 0.05; **p < 0.01; ***p < 0.001.
FIGURE 5
FIGURE 5
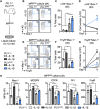
PU.1-deficient MPPGM exhibit aberrant expansion and impaired myeloid differentiation during IL-1 stimulation in vitro. (A) Study design for culture experiments. FACS-purified MPPGM were cultured in serum-free medium for 4 days ± IL-1β in myeloid growth conditions (n = 3/grp). (B) Representative FACS plots, (C) frequency and (D) number of phenotypically immature (c-Kit+/Sca-1+) cells after 4d culture. (E) Representative FACS plots, (F) frequency and (G) number of phenotypically myeloid-committed (FcγR+/Mac-1+) cells after 4d culture. (H) Surface expression of myeloid lineage markers. Data are expressed as mean fluorescence intensity (MFI). For bar graphs, individual values are shown with bars representing means. For line graphs, mean values are shown. Error bars represent S.D. Data are representative of two individual experiments. Statistical analysis for datasets in C-H was performed using ANOVA with Tukey’s test; *p < 0.05; **p < 0.01; ***p < 0.001.

References

    1. Ahmed N., Etzrodt M., Dettinger P., Kull T., Loeffler D., Hoppe P. S., et al. (2022). Blood stem cell PU.1 upregulation is a consequence of differentiation without fast autoregulation. J. Exp. Med. 219, e20202490. 10.1084/jem.20202490 - DOI - PMC - PubMed
    1. Aivalioti M. M., Bartholdy B. A., Pradhan K., Bhagat T. D., Zintiridou A., Jeong J. J., et al. (2022). PU.1-Dependent enhancer inhibition separates tet2-deficient hematopoiesis from malignant transformation. Blood Cancer Discov. 3, 444–467. 10.1158/2643-3230.BCD-21-0226 - DOI - PMC - PubMed
    1. Algeciras-Schimnich A., Pietras E. M., Barnhart B. C., Legembre P., Vijayan S., Holbeck S. L., et al. (2003). Two CD95 tumor classes with different sensitivities to antitumor drugs. Proc. Natl. Acad. Sci. U. S. A. 100, 11445–11450. 10.1073/pnas.2034995100 - DOI - PMC - PubMed
    1. Barreyro L., Chlon T. M., Starczynowski D. T. (2018). Chronic immune response dysregulation in MDS pathogenesis. Blood 132, 1553–1560. 10.1182/blood-2018-03-784116 - DOI - PMC - PubMed
    1. Barreyro L., Will B., Bartholdy B., Zhou L., Todorova T. I., Stanley R. F., et al. (2012). Overexpression of IL-1 receptor accessory protein in stem and progenitor cells and outcome correlation in AML and MDS. Blood 120, 1290–1298. 10.1182/blood-2012-01-404699 - DOI - PMC - PubMed

LinkOut - more resources