

Two-layered blood-lipid phantom and method to determine absorption and oxygenation employing changes in moments of DTOFs
- PMID: 37497481
- PMCID: PMC10368065
- DOI: 10.1364/BOE.492168
Two-layered blood-lipid phantom and method to determine absorption and oxygenation employing changes in moments of DTOFs
Abstract
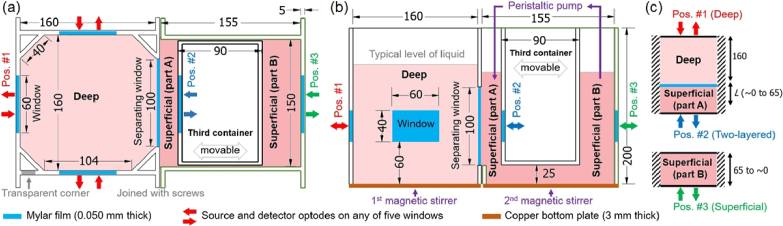
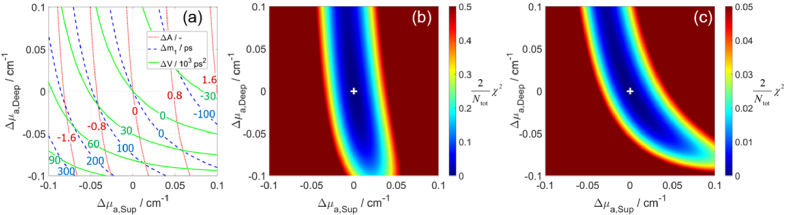
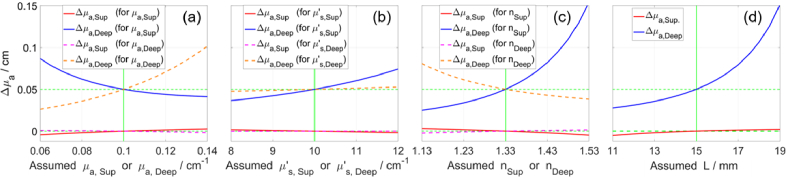
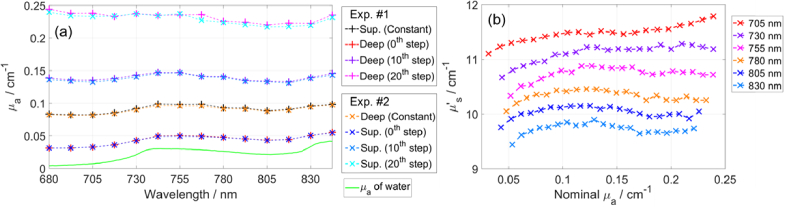
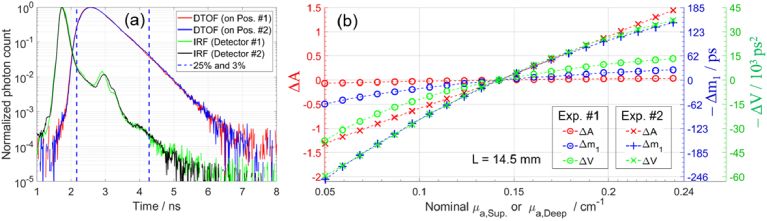
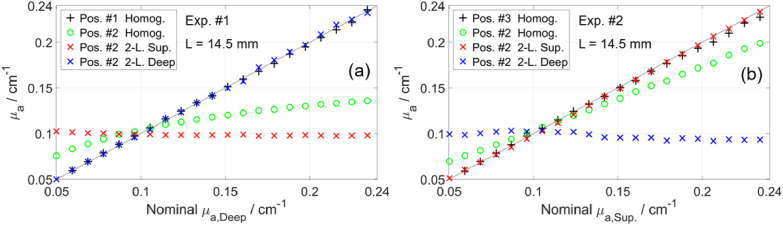
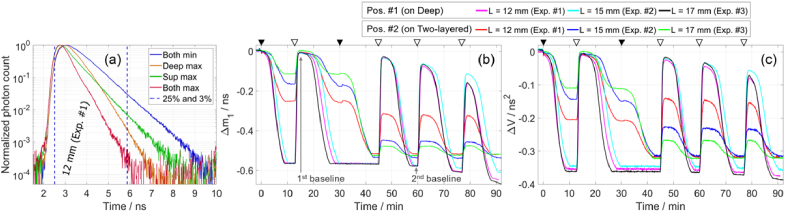
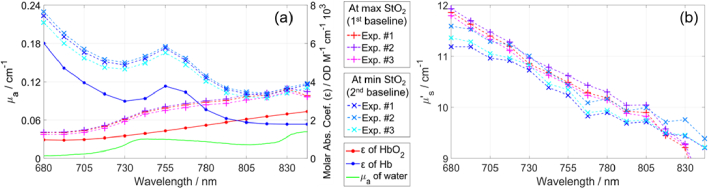
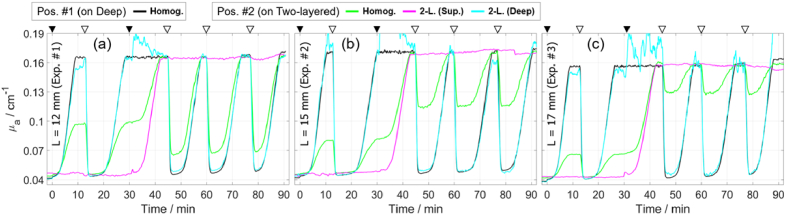
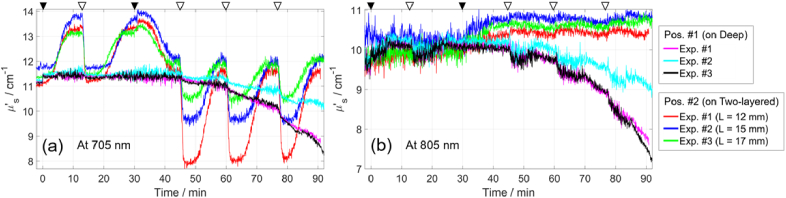
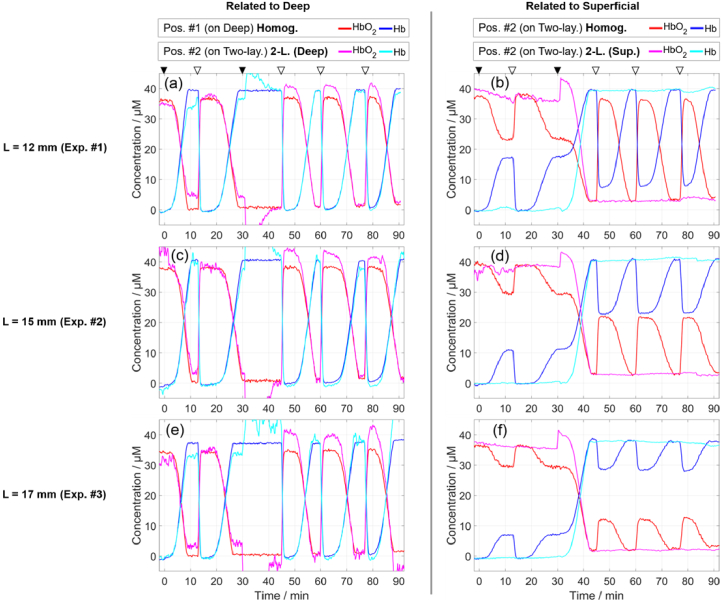
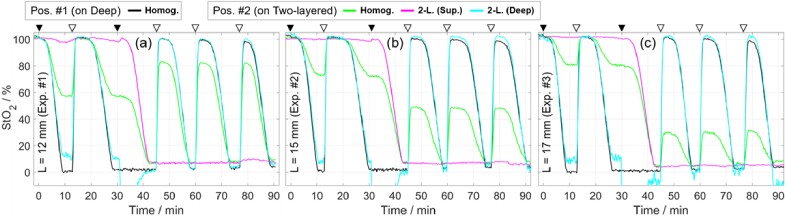
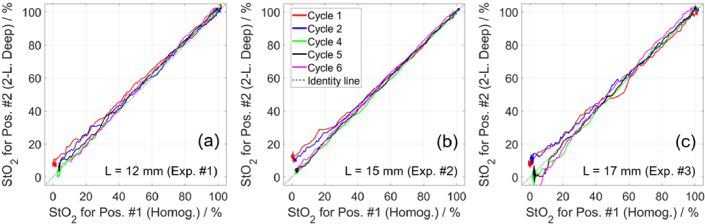
Near-infrared spectroscopy (NIRS) is an established technique for measuring tissue oxygen saturation (StO2), which is of high clinical value. For tissues that have layered structures, it is challenging but clinically relevant to obtain StO2 of the different layers, e.g. brain and scalp. For this aim, we present a new method of data analysis for time-domain NIRS (TD-NIRS) and a new two-layered blood-lipid phantom. The new analysis method enables accurate determination of even large changes of the absorption coefficient (Δµa) in multiple layers. By adding Δµa to the baseline µa, this method provides absolute µa and hence StO2 in multiple layers. The method utilizes (i) changes in statistical moments of the distributions of times of flight of photons (DTOFs), (ii) an analytical solution of the diffusion equation for an N-layered medium, (iii) and the Levenberg-Marquardt algorithm (LMA) to determine Δµa in multiple layers from the changes in moments. The method is suitable for NIRS tissue oximetry (relying on µa) as well as functional NIRS (fNIRS) applications (relying on Δµa). Experiments were conducted on a new phantom, which enabled us to simulate dynamic StO2 changes in two layers for the first time. Two separate compartments, which mimic superficial and deep layers, hold blood-lipid mixtures that can be deoxygenated (using yeast) and oxygenated (by bubbling oxygen) independently. Simultaneous NIRS measurements can be performed on the two-layered medium (variable superficial layer thickness, L), the deep (homogeneous), and/or the superficial (homogeneous). In two experiments involving ink, we increased the nominal µa in one of two compartments from 0.05 to 0.25 cm-1, L set to 14.5 mm. In three experiments involving blood (L set to 12, 15, or 17 mm), we used a protocol consisting of six deoxygenation cycles. A state-of-the-art multi-wavelength TD-NIRS system measured simultaneously on the two-layered medium, as well as on the deep compartment for a reference. The new method accurately determined µa (and hence StO2) in both compartments. The method is a significant progress in overcoming the contamination from the superficial layer, which is beneficial for NIRS and fNIRS applications, and may improve the determination of StO2 in the brain from measurements on the head. The advanced phantom may assist in the ongoing effort towards more realistic standardized performance tests in NIRS tissue oximetry. Data and MATLAB codes used in this study were made publicly available.
Published by Optica Publishing Group under the terms of the Creative Commons Attribution 4.0 License. Further distribution of this work must maintain attribution to the author(s) and the published article’s title, journal citation, and DOI.
Conflict of interest statement
The authors declare no conflicts of interest. MW declares that he is president of the board and founder of OxyPrem AG. AL declares that he is shareholder of Brain Optics.
Figures
Similar articles
-
Absolute quantification of cerebral tissue oxygen saturation with multidistance broadband NIRS in newborn brain.Biomed Opt Express. 2021 Jan 15;12(2):907-925. doi: 10.1364/BOE.412088. eCollection 2021 Feb 1. Biomed Opt Express. 2021. PMID: 33680549 Free PMC article.
-
Optical characterization of two-layered turbid media for non-invasive, absolute oximetry in cerebral and extracerebral tissue.PLoS One. 2013 May 21;8(5):e64095. doi: 10.1371/journal.pone.0064095. Print 2013. PLoS One. 2013. PMID: 23724023 Free PMC article.
-
Liquid Blood Phantoms to Validate NIRS Oximeters: Yeast Versus Nitrogen for Deoxygenation.Adv Exp Med Biol. 2018;1072:381-385. doi: 10.1007/978-3-319-91287-5_61. Adv Exp Med Biol. 2018. PMID: 30178375
-
The Various Oximetric Techniques Used for the Evaluation of Blood Oxygenation.Sensors (Basel). 2020 Aug 27;20(17):4844. doi: 10.3390/s20174844. Sensors (Basel). 2020. PMID: 32867184 Free PMC article. Review.
-
Effects of Different Optical Properties of Head Tissues on Near-Infrared Spectroscopy Using Monte Carlo Simulations.Adv Exp Med Biol. 2022;1395:39-43. doi: 10.1007/978-3-031-14190-4_7. Adv Exp Med Biol. 2022. PMID: 36527611 Review.
Cited by
-
Muscle Oximetry in Sports Science: An Updated Systematic Review.Sports Med. 2024 Apr;54(4):975-996. doi: 10.1007/s40279-023-01987-x. Epub 2024 Feb 12. Sports Med. 2024. PMID: 38345731 Free PMC article.
-
Leveraging 3D convolutional neural network and 3D visible-near-infrared multimodal imaging for enhanced contactless oximetry.J Biomed Opt. 2024 Jun;29(Suppl 3):S33309. doi: 10.1117/1.JBO.29.S3.S33309. Epub 2024 Aug 21. J Biomed Opt. 2024. PMID: 39170819 Free PMC article.
-
Noninvasive monitoring of fetal tissue oxygenation level using time-domain NIRS.J Biomed Opt. 2025 Aug;30(8):087001. doi: 10.1117/1.JBO.30.8.087001. Epub 2025 Aug 23. J Biomed Opt. 2025. PMID: 40861499 Free PMC article.
-
How the heterogeneity of the severely injured brain affects hybrid diffuse optical signals: case examples and guidelines.Neurophotonics. 2024 Oct;11(4):045005. doi: 10.1117/1.NPh.11.4.045005. Epub 2024 Oct 18. Neurophotonics. 2024. PMID: 39430435 Free PMC article.
-
Tissue mimicking materials and finger phantom design for pulse oximetry.Biomed Opt Express. 2024 Mar 12;15(4):2308-2327. doi: 10.1364/BOE.518967. eCollection 2024 Apr 1. Biomed Opt Express. 2024. PMID: 38633081 Free PMC article.
References
-
- Wong Z. Z., Chiong X. H., Chaw S. H., Hashim N. H. B. M., Abidin M. F. B. Z., Yunus S. N. B., Subramaniam T., Ng K. T., “The Use of Cerebral Oximetry in Surgery: A Systematic Review and Meta-analysis of Randomized Controlled Trials,” J. Cardiothorac. Vasc. Anesth. 36(7), 2002–2011 (2022).10.1053/j.jvca.2021.09.046 - DOI - PubMed
-
- Sanfilippo F., Murabito P., Messina A., Dezio V., Busalacchi D., Ristagno G., Cecconi M., Astuto M., “Cerebral regional oxygen saturation during cardiopulmonary resuscitation and return of spontaneous circulation: A systematic review and meta-analysis,” Resuscitation 159, 19–27 (2021).10.1016/j.resuscitation.2020.12.002 - DOI - PubMed
-
- Chen W.-L., Wagner J., Heugel N., Sugar J., Lee Y.-W., Conant L., Malloy M., Heffernan J., Quirk B., Zinos A., Beardsley S. A., Prost R., Whelan H. T., “Functional Near-Infrared Spectroscopy and Its Clinical Application in the Field of Neuroscience: Advances and Future Directions,” Front. Neurosci. 14, 724 (2020).10.3389/fnins.2020.00724 - DOI - PMC - PubMed
LinkOut - more resources
Full Text Sources