. 2023 Jun 16;14(7):3413-3432.
doi: 10.1364/BOE.489271. eCollection 2023 Jul 1.

A machine learning framework for the quantification of experimental uveitis in murine OCT

Affiliations

A machine learning framework for the quantification of experimental uveitis in murine OCT

Youness Mellak et al. Biomed Opt Express. .

Abstract

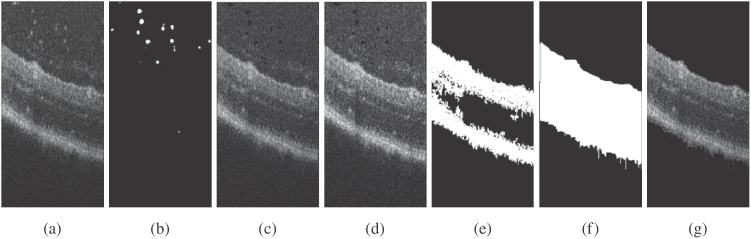
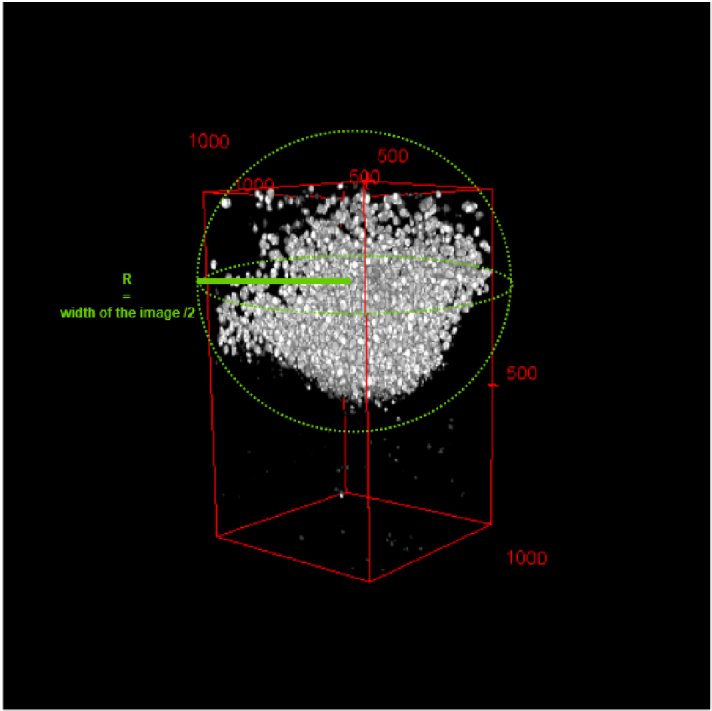
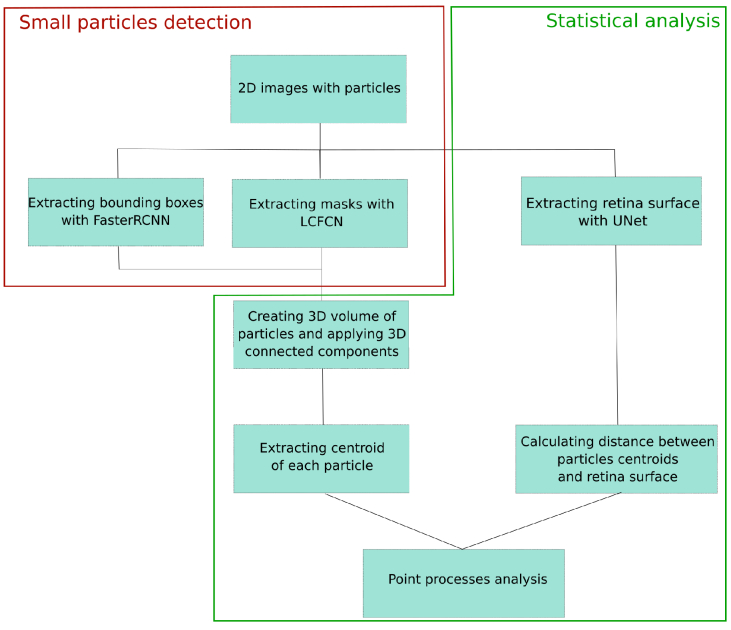
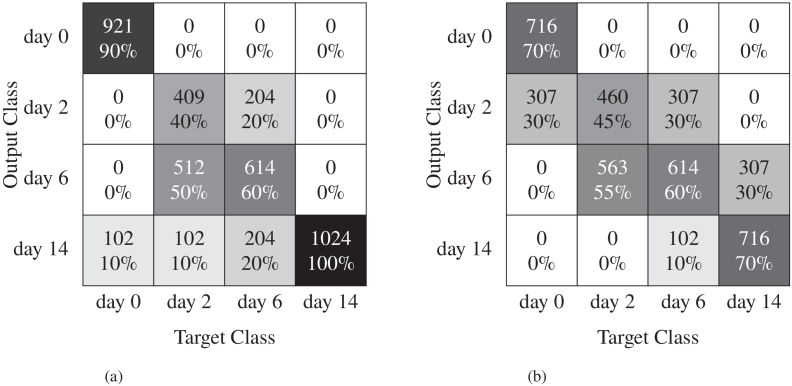
This paper presents methods for the detection and assessment of non-infectious uveitis, a leading cause of vision loss in working age adults. In the first part, we propose a classification model that can accurately predict the presence of uveitis and differentiate between different stages of the disease using optical coherence tomography (OCT) images. We utilize the Grad-CAM visualization technique to elucidate the decision-making process of the classifier and gain deeper insights into the results obtained. In the second part, we apply and compare three methods for the detection of detached particles in the retina that are indicative of uveitis. The first is a fully supervised detection method, the second is a marked point process (MPP) technique, and the third is a weakly supervised segmentation that produces per-pixel masks as output. The segmentation model is used as a backbone for a fully automated pipeline that can segment small particles of uveitis in two-dimensional (2-D) slices of the retina, reconstruct the volume, and produce centroids as points distribution in space. The number of particles in retinas is used to grade the disease, and point process analysis on centroids in three-dimensional (3-D) shows clustering patterns in the distribution of the particles on the retina.


Conflict of interest statement

The authors declare no conflicts of interest related to this article.

Figures

Fig. 1.
Fig. 1.
The pipeline of gradient-weighted class activation mapping (Grad-CAM). The input image is fed to a trained neural network (EfficientNET-B7) in order to obtain the classification result. Back propagation is performed with ill retina = 1 and healthy retina = 0. GAP of the gradient is calculated for each channel and used as weights for the network. The weights are then multiplied with the feature map, summed and passed to the ReLU to obtain the heatmap.
Fig. 2.
Fig. 2.
Faster R-CNN to predict bounding boxes around the particles.
Fig. 3.
Fig. 3.
Weakly supervised segmentation with LC-FCN. 2-D OCT images are used as input. The FCN8 architecture is used to generate probability maps. These represent the probability of each pixel being part of a particle. The output of FCN8 is thresholded by 0.5 and then passed to a 2-D connected components algorithm to obtain the masks and corresponding number of particles.
Fig. 4.
Fig. 4.
A multi-step image processing approach for extracting the retina surface from an OCT image. (a) Original image, (b) Extracted masks of particles, (c) Image without particles, (d) Normalization of grayscale on small columns (of 10 pixels) of the image, (e) Binarization with a threshold, Application of connected components algorithm in 2-D and removing small regions, then smoothing image with Gaussian filter, (f) Extracted retina mask, (g) Extracted retina surface.
Fig. 5.
Fig. 5.
Deep Learning-Based Retina Surface Extraction using U-Net.
Fig. 6.
Fig. 6.
Pipeline to generate 3-D distribution of particles. Generating 3-D volume step include gathering 2D slices in a unique volume, followed by application of 3-D connected components algorithm and shape Filtering to enhance particle detection.
Fig. 7.
Fig. 7.
The image of segmented particles in 3-D is in white, the volume of the entire retina is in red, and the studied area where the K-Ripley function is calculated is the sphere in green.
Fig. 8.
Fig. 8.
Flowchart illustrating the sequential stages and processing steps employed in the study.
Fig. 9.
Fig. 9.
OCT images and their corresponding Grad-CAM outputs. (a) and (b) show the first image and its corresponding Grad-CAM output, while (c) and (d) show the second image and its Grad-CAM output.
Fig. 10.
Fig. 10.
Original OCT images (a), (c), (e) and the extracted surface of the retina corresponding to each image (b), (d), (f).
Fig. 11.
Fig. 11.
Confusion matrices for multi-day classification of original images. (b) Using a dataset of original images; (b) Using a dataset of images with retina surface only.
Fig. 12.
Fig. 12.
Different particle detection methods. (a) Original OCT images. (b) MPP method. (c) weakly supervised method. (d) supervised method. Green points on images represents annotation points or the ground truth. In red we have predictions (bounding boxes or masks).
Fig. 13.
Fig. 13.
Box plot analysis of number of particles in retinas by days.
Fig. 14.
Fig. 14.
Measuring distance between particles and the surface of the retina. Images from left to right represent: the original image, extracted retina mask, negative values of the mask, and heat-map of the distance between each point and the retina surface.
Fig. 15.
Fig. 15.
Box plot summarizing results comparing the distribution of different days in terms of the number of particles in each slice of distance from the retina surface.
Fig. 16.
Fig. 16.
3D K-Ripley function for 8 different retinas of different days of evolution of the disease.
Fig. 17.
Fig. 17.
Heatmaps display the distribution of particles across different days, with the first row corresponding to day 2 (Images from (a) to (e)), the second row to day 6 (Images from (f) to (j)), and the third row to day 14 (Images from (k) to (o)).

Update of

  • doi: 10.1364/opticaopen.22222147.

References

    1. Ran A. R., Tham C. C., Chan P. P., Cheng C.-Y., Tham Y.-C., Rim T. H., Cheung C. Y., “Deep learning in glaucoma with optical coherence tomography: a review,” Eye 35(1), 188–201 (2021).10.1038/s41433-020-01191-5 - DOI - PMC - PubMed
    1. Mirzania D., Thompson A. C., Muir K. W., “Applications of deep learning in detection of glaucoma: a systematic review,” Eur. J. Ophthalmol. 31(4), 1618–1642 (2021).10.1177/1120672120977346 - DOI - PubMed
    1. Kazemian P., Lavieri M. S., Van Oyen M. P., Andrews C., Stein J. D., “Personalized prediction of glaucoma progression under different target intraocular pressure levels using filtered forecasting methods,” Ophthalmology 125(4), 569–577 (2018).10.1016/j.ophtha.2017.10.033 - DOI - PMC - PubMed
    1. Asaoka R., Murata H., Hirasawa K., Fujino Y., Matsuura M., Miki A., Kanamoto T., Ikeda Y., Mori K., Iwase A., Shoji N., Inoue K., Yamagami J., Araie M., “Using deep learning and transfer learning to accurately diagnose early-onset glaucoma from macular optical coherence tomography images,” Am. J. Ophthalmol. 198, 136–145 (2019).10.1016/j.ajo.2018.10.007 - DOI - PubMed
    1. Lee C. S., Baughman D. M., Lee A. Y., “Deep learning is effective for classifying normal versus age-related macular degeneration oct images,” Ophthalmol. Retin. 1(4), 322–327 (2017).10.1016/j.oret.2016.12.009 - DOI - PMC - PubMed

LinkOut - more resources