

Branched-chain amino acid synthesis is coupled to TOR activation early in the cell cycle in yeast
- PMID: 37497662
- PMCID: PMC10481666
- DOI: 10.15252/embr.202357372
Branched-chain amino acid synthesis is coupled to TOR activation early in the cell cycle in yeast
Abstract
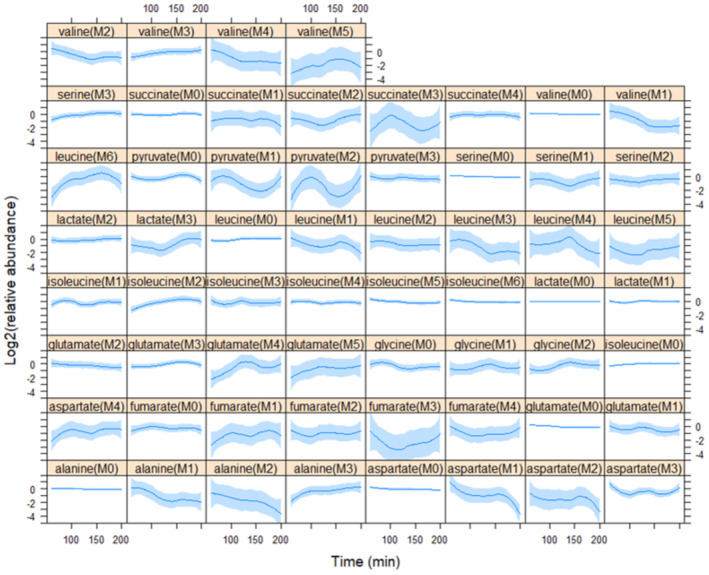
How cells coordinate their metabolism with division determines the rate of cell proliferation. Dynamic patterns of metabolite synthesis during the cell cycle are unexplored. We report the first isotope tracing analysis in synchronous, growing budding yeast cells. Synthesis of leucine, a branched-chain amino acid (BCAA), increases through the G1 phase of the cell cycle, peaking later during DNA replication. Cells lacking Bat1, a mitochondrial aminotransferase that synthesizes BCAAs, grow slower, are smaller, and are delayed in the G1 phase, phenocopying cells in which the growth-promoting kinase complex TORC1 is moderately inhibited. Loss of Bat1 lowers the levels of BCAAs and reduces TORC1 activity. Exogenous provision of valine and, to a lesser extent, leucine to cells lacking Bat1 promotes cell division. Valine addition also increases TORC1 activity. In wild-type cells, TORC1 activity is dynamic in the cell cycle, starting low in early G1 but increasing later in the cell cycle. These results suggest a link between BCAA synthesis from glucose to TORC1 activation in the G1 phase of the cell cycle.
Keywords: BCAA; BCAT; TORC1; cell size; isotope tracing.
© 2023 The Authors. Published under the terms of the CC BY NC ND 4.0 license.
Conflict of interest statement
The authors declare that they have no conflict of interest.
Figures
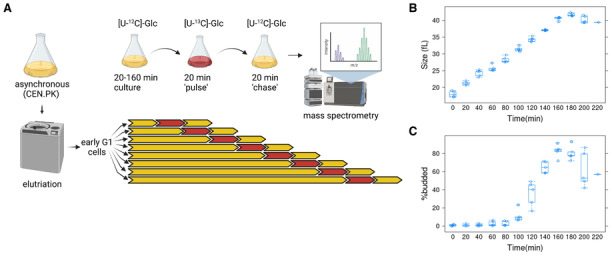
- A
For each experiment, early G1 daughter cells of a prototrophic strain (CEN.PK; see Materials and Methods) were obtained by centrifugal elutriation. The elutriated culture was split into eight aliquots and cultured for a varying amount of time, from 20 to 160 min, in minimal, [U‐12C]‐glucose medium. They were then transferred to a medium with [U‐13C]‐glucose for 20 min (pulse) and then incubated for another 20 min in [U‐12C]‐glucose medium (chase). Metabolite extracts from these cells were analyzed by mass spectrometry. Five such independent experiments were performed. The figure was generated with
Biorender.com . - B
Boxplots showing the cell size (y‐axis) over time (x‐axis) of all the samples as they progressed in the cell cycle.
- C
Boxplots showing the percentage of budded cells (y‐axis) from the same samples shown in (B). The boxplot graphs were generated with R language functions. Each box is drawn from the first to the third quartile, with a horizontal line drawn in the middle to denote the median. The whiskers show the interquartile range (IQR), and they were drawn at 1.5xIQR. The replicates were all biological ones.


- A
Diagram of the reactions leading to BCAAs from the corresponding alpha‐keto (α‐k) acids, catalyzed by Bat1,2p. A more detailed diagram leading to the of valine (M5) and leucine (M6) isotopomers is in Fig EV1.
- B
The indicated strains (all in the prototrophic CEN.PK background; see Materials and Methods) were spotted at 10‐fold serial dilutions on solid Synthetic Minimal Medium (SMM) agar plates. Exogenous amino acids were added at 1 mM final concentration, as indicated in each case. The plates were incubated at 30°C and photographed after 3‐days.
- C
DNA content profiles of BAT1 and bat1Δ cells from asynchronous cultures, in SMM medium. Where indicated, exogenous amino acids were added at 1 mM final concentration. On the x‐axis of the histograms is fluorescence per cell, while on the y‐axis is the cell number. Peaks corresponding to cells in G1 with unreplicated (1 N) and cells in G2 and M phases with fully replicated (2 N) DNA are indicated. The percentage of cells with G1 DNA content (%G1) from 3 independent measurements is shown in each case (mean and sd).


- A
Boxplots showing the size of the cells (in fL). The measurements were taken from asynchronous cultures in synthetic minimal media (SMM) without amino acid supplementation. The boxplot graphs were generated with R language functions. Each box is drawn from the first to the third quartile, with a horizontal line drawn in the middle to denote the median. The whiskers show the interquartile range (IQR), and they were drawn at 1.5xIQR. The replicates were all biological ones.
- B
Plots of the percentage of budded cells (y‐axis) as a function of size (x‐axis). The measurements were from daughter cells of the indicated strains, obtained by centrifugal elutriation, progressing in the cell cycle in SMM medium. Loess curves and the std errors at a 0.95 level are shown.
- C
From the same experiments as in (B), the specific rate of the increase in size (k) was calculated, from the slope of the regression lines plotting the Ln‐transformed cell size values (y‐axis) against time (x‐axis).

- A
The indicated strains were spotted at 10‐fold serial dilutions on solid Synthetic Minimal Medium (SMM) agar plates. Rapamycin was added at 30 ng/ml, as shown in each case. The plates were incubated at 30°C and photographed after 5 and 7 days, as indicated.
- B
Immunoblots of total cell extracts from asynchronous BAT1 and bat1Δ cells, from four independent experiments. The signal from Pgk1 (α‐Pgk1) is shown on the blot at the bottom, and from phosphorylated Rps6 (α‐Rps6‐P) is on the blot above, indicated for two exposures (2 min, top; 20 s, middle).
- C
On the left are immunoblots from wild‐type (CEN.PK) cells treated (+), or not (−), with rapamycin (Rapa) at 200 ng/ml for 1 h before cell extract preparation. On the right are immunoblots of wild‐type (CEN.PK) cell extracts. The extracts were treated (+), or not (−), with λ‐phosphatase for 1 h (see Materials and Methods). The levels of phosphorylated Rps6 (α‐Rps6‐P) and Pgk1 (α‐Pgk1) are shown in each case.
- D
Exogenous addition of valine leads to sustained activation of TORC1 and phosphorylation of Rps6 in cells lacking Bat1. Wild type (BAT1 +) and bat1∆ (two independent isolates, #4, and #5) strains were grown overnight in minimal (SMM) medium, diluted to 1E+06 cells/ml in fresh SMM media containing the indicated amino acid (at 1 mM), and harvested when they reached 5E+06 cells/ml. The levels of phosphorylated Rps6 (α‐Rps6‐P) and Pgk1 (α‐Pgk1) are shown in immunoblots from total cell extracts in each case. The relative levels of Rps6‐P/Pgk1 are shown in each case at the bottom. The boxplot graphs were generated with R language functions. Each box is drawn from the first to the third quartile, with a horizontal line drawn in the middle to denote the median. The whiskers show the interquartile range (IQR), and they were drawn at 1.5xIQR. The replicates were all biological ones.

Immunoblots of total cell extracts from synchronous, elutriated wild‐type (CEN.PK) cells in minimal (SMM) medium with exogenous Leu or Val added at 1 mM immediately after elutriation. At the top, the percent of budded cells (%B), cell size (in fL), and time (in min) are indicated. The levels of phosphorylated Rps6 (α‐Rps6‐P) and Pgk1 (α‐Pgk1) are shown in each case.
Quantification of the levels of phosphorylated Rps6 and Pgk1 from independent experiments done as in A. The relative levels of each protein across the cell cycle is shown on the y‐axis, as a function of cell size (x‐axis). Loess curves and the std errors at a 0.95 level are shown.
Schematic of a possible model to explain our findings, linking BCAA synthesis to TORC1 activation early in the cell cycle.
References
-
- Albers MW, Williams RT, Brown EJ, Tanaka A, Hall FL, Schreiber SL (1993) FKBP‐rapamycin inhibits a cyclin‐dependent kinase activity and a cyclin D1‐Cdk association in early G1 of an osteosarcoma cell line. J Biol Chem 268: 22825–22829 - PubMed
Publication types
MeSH terms
Substances
Grants and funding
LinkOut - more resources
Full Text Sources
Molecular Biology Databases
Miscellaneous
