. 2023 Sep 1;16(9):dmm050266.
doi: 10.1242/dmm.050266. Epub 2023 Sep 20.

OPA1 deficiency impairs oxidative metabolism in cycling cells, underlining a translational approach for degenerative diseases

Affiliations

OPA1 deficiency impairs oxidative metabolism in cycling cells, underlining a translational approach for degenerative diseases

Aurélie M C Millet et al. Dis Model Mech. .

Erratum in

Abstract

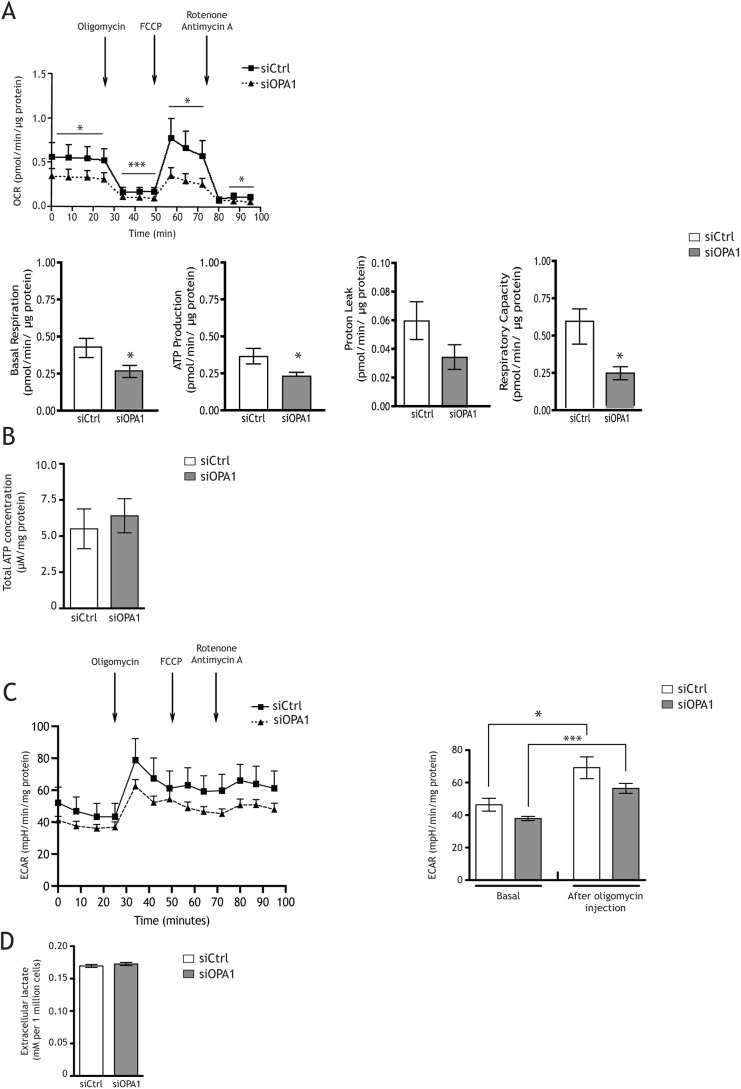
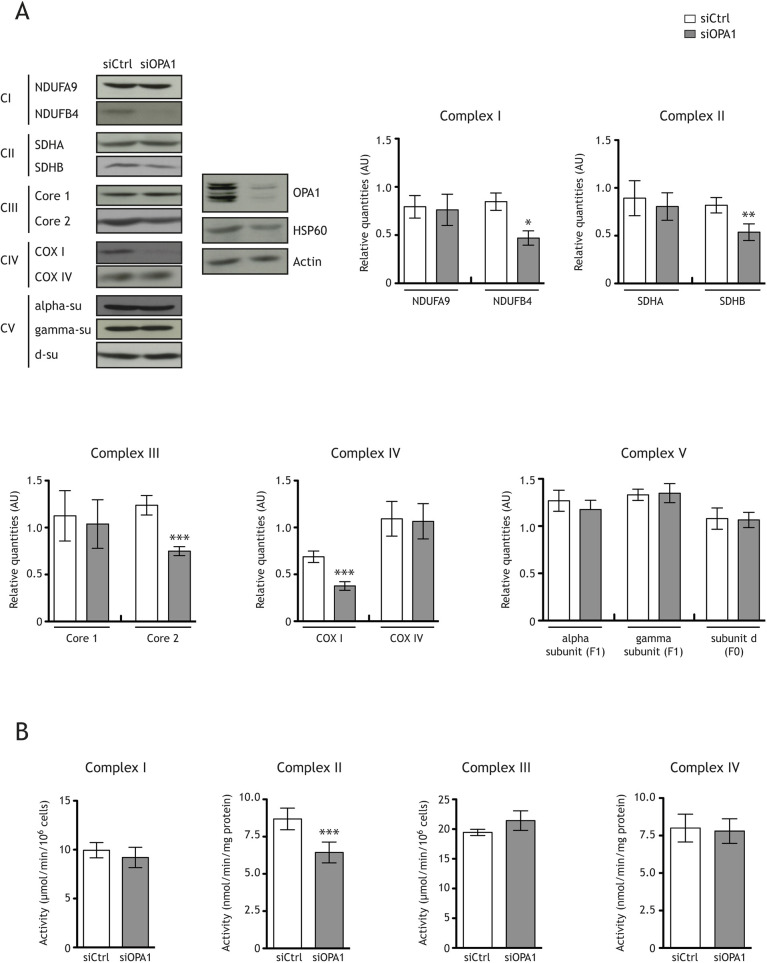
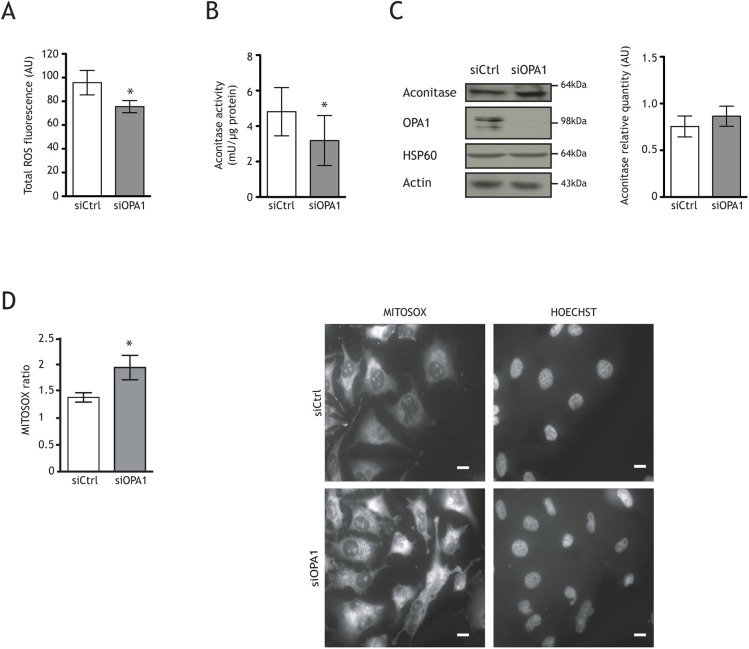
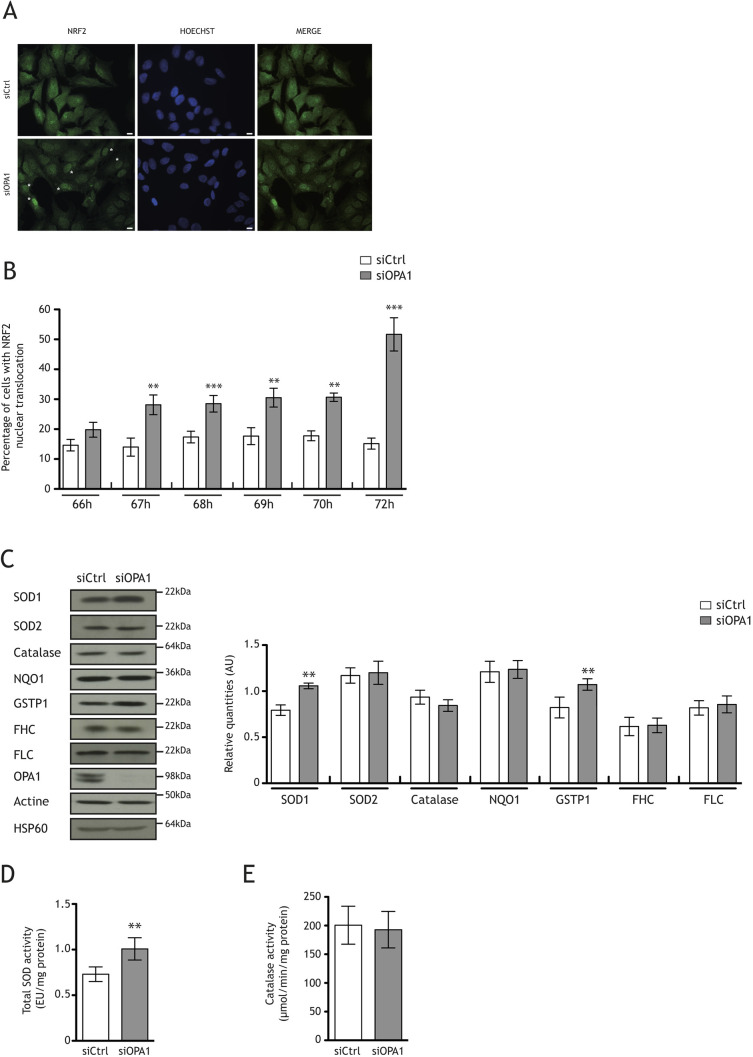
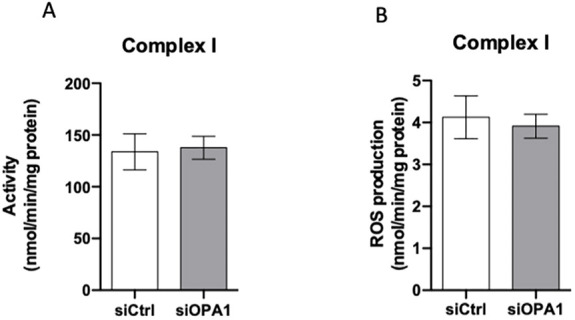
Dominant optic atrophy is an optic neuropathy with varying clinical symptoms and progression. A severe disorder is associated with certain OPA1 mutations and includes additional symptoms for >20% of patients. This underscores the consequences of OPA1 mutations in different cellular populations, not only retinal ganglionic cells. We assessed the effects of OPA1 loss of function on oxidative metabolism and antioxidant defences using an RNA-silencing strategy in a human epithelial cell line. We observed a decrease in the mitochondrial respiratory chain complexes, associated with a reduction in aconitase activity related to an increase in reactive oxygen species (ROS) production. In response, the NRF2 (also known as NFE2L2) transcription factor was translocated into the nucleus and upregulated SOD1 and GSTP1. This study highlights the effects of OPA1 deficiency on oxidative metabolism in replicative cells, as already shown in neurons. It underlines a translational process to use cycling cells to circumvent and describe oxidative metabolism. Moreover, it paves the way to predict the evolution of dominant optic atrophy using mathematical models that consider mitochondrial ROS production and their detoxifying pathways.

Keywords: Mathematical model; Mitochondria; Neurodegenerative disease; Oxidative metabolism.


Conflict of interest statement

Competing interests The authors declare no competing or financial interests.

Figures

Fig. 1.
Fig. 1.
OPA1 downregulation decreases mitochondrial respiration without changing mitochondrial biomass. (A) Oxygen consumption rates (OCRs) were measured in siOPA1- and siCtrl-transfected HeLa cells. Spontaneous mitochondrial respiration was significantly lower in siOPA1-transfected cells (0.33±0.02 pmol/min/µg protein) than in control cells (0.53±0.04 pmol/min/µg protein). After oligomycin (1 µM) injection, cell respiration was also significantly lower in siOPA1-transfected cells (0.11±0.01 pmol/min/µg protein) than in control cells (0.17±0.02 pmol/min/µg protein). After FCCP (1 µM) injection, maximal respiratory was significantly lower in siOPA1-transfected cells (0.30±0.04 pmol/min/µg protein) than in control cells (0.67±0.10 pmol/min/µg protein). Finally, rotenone (1 µM) plus antimycin A (1 µM) injection inhibited mitochondrial respiration. Results are expressed as the mean±s.e.m. (n=3). Unpaired two-tailed Student's t-test (*P<0.05 and ***P<0.001). (B) ATP concentration was unchanged in siOPA1 HeLa cells (grey bar) relative to that in siCtrl-treated (white bar) cells. Results are expressed as the mean±s.e.m. (n=3). Paired two-tailed Student's t-test. (C) Extracellular acidification rates (ECARs) were unchanged in OPA1-treated cells (basal, 37.93±1.33 pmol/min/µg protein; oligomycin, 56.42±3.08 pmol/min/mg protein) relative to those in siCtrl-treated cells (basal, 46.40±3.93 pmol/min/mg protein; oligomycin, 69.14±6.72 pmol/min/mg protein) under basal conditions and after 1 µM oligomycin injection. As expected, ECAR increased in siCtrl- and siOPA1-transfected cells after oligomycin injection. Results are expressed as the mean±s.e.m. (n=3). Unpaired two-tailed Student's t-test (*P<0.05 and ***P<0.001). (D) Extracellular lactate was measured by colorimetric analysis in HeLa cells with (grey bar) or without (white bar) siOPA1 (mean±s.e.m., n=2). Paired two-tailed Student's t-test.
Fig. 2.
Fig. 2.
OPA1 downregulation decreases the level of mitochondrial respiration complex I to IV subunits and complex II activity. (A) Representative immunoblots and histograms showing the effects of OPA1 downregulation in HeLa cells on the levels of two subunits of the mitochondrial respiratory chain (MRC) complexes [complex I-IV (CI-CIV)] and three subunits (su) of ATP synthase [complex V (CV)] relative to actin. The quantity of NDUFB4 (n=10) was significantly lower in siOPA1-transfected HeLa cells [0.47±0.07 arbitrary units (AU)] than in siCtrl-transfected cells (0.85±0.09 AU). The quantity of SDHB (n=10) was significantly lower in siOPA1-treated cells (0.68±0.16 AU) than in control cells (0.96±0.16 AU). The level of Core 2 (n=10) was significantly lower in siOPA1-treated cells (0.75±0.05 AU) than in control cells (1.238±0.10 AU). The level of COX I (n=10) was lower in siOPA1-treated cells (0.37±0.05 AU) than in control cells (0.69±0.06 AU). Paired two-tailed Student's t-test (*P<0.05, **P<0.01 and ***P<0.001). (B) Activity of complex I (n=3), II (n=16), III (n=3) and IV (n=16) measured in vitro in siOPA1- and siCtrl-treated HeLa cells. Succinate dehydrogenase (complex II) activity was lower in siOPA1-treated cells (6.438±0.701 nmol/min/mg protein) than in control cells (8.688±0.7229 nmol/min/mg protein). Results are expressed as the mean±s.e.m. Paired two-tailed Student's (***P<0.001).
Fig. 3.
Fig. 3.
Imbalanced redox state in OPA1-downregulated cells. (A) Total reactive oxygen species (ROS) measured by the H2-DCFDA probe in siOPA1-transfected HeLa cells (72.63±4.6 AU) was lower than that in siCtrl-treated cells (95.48±9.1 AU). (B) Aconitase activity was lower in siOPA1-treated cells (3.185±1.41 mU/µg protein) than in siCtrl-treated cells (4.811±1.361 mU/µg protein). (C) Representative immunoblots and histograms showing that OPA1 downregulation in HeLa cells has no effect on the expression of aconitase relative to actin. (D) Mitochondrial superoxide production was measured using MitoSOX Red (mitochondria-targeted superoxide indication) with fluorescence microscopy (40×). MitoSOX measurement was performed after 72 h siCtrl (white) or siOPA1 (grey) transfection. Representative histogram of quantitative fluorescence intensity was generated using ImageJ software. The ROS level was higher in siOPA1-tranfected cells (1.9444±0.2278) than in control cells (1.386±0.08754). Representative micrographs of mitochondrial MitoSOX immunocytofluorescence and DNA Hoechst staining in siCtrl- or siOPA1-treated HeLa cells 72 h after transfection. Scale bars: 10 µm. Results are expressed as the mean±s.e.m. [n=8 (A), n=6 (B), n=8 (C) and n=3 (D), with more than 200 cells per condition]. Nonparametric test (Mann–Whitney) (A,D) or paired two-tailed Student's t-test (B) (*P<0.05).
Fig. 4.
Fig. 4.
OPA1 downregulation induces the nuclear translocation of NRF2 and increases the quantity of the NRF2 target proteins SOD1 and GSTP1. (A) Representative micrographs of NRF2 (green) immunocytofluorescence and DNA Hoechst staining (blue) or merge (green+blue) in siOPA1- or siCtrl-treated HeLa cells 72 h after transfection. Scale bars: 10 μm. (B) Representative histogram showing the percentage of cells with NRF2 nuclear translocation 66, 67, 68, 69, 70 and 72 h after siOPA1 (grey) or siCtrl (white) transfection. Nuclear immunostaining of NRF2 was observed in 15.18±1.86% of control HeLa cells and 51.68±5.57% of siOPA1-treated cells 72 h after transfection. Results are expressed as the mean±s.e.m. [n=4-14 (400 cells per condition)]. Nonparametric test (Mann–Whitney test) (**P<0.01 and ***P<0.001). (C) Representative immunoblots and relative quantities of SOD1, SOD2, catalase, NQO1, GSTP1, FHC and FLC protein in siCtrl- and siOPA1-treated HeLa cells. The quantity of SOD1 was higher in siOPA1-treated cells (1.05±0.03 AU) than in control cells (0.79±0.05 AU). The quantity of GSTP1 was higher in siOPA1-treated cells (1.07±0.06 AU) than in control cells (0.82±0.11 AU). Paired two-tailed Student's t-test (**P<0.01). (D) Total SOD activity (SOD1 and SOD2) was higher in siOPA1-treated cells (1.01±0.12 EU/mg protein) than in control cells (0.73±0.08 EU/mg protein). Paired two-tailed Student's t-test (**P<0.01). (E) Catalase activity was the same in siOPA1- and siCtrl-treated cells. Results are expressed as the mean±s.e.m. [n=8 (A), n=5 (B) n=7 (C) n=5 (D) and n=7 (E)].
Fig. 5.
Fig. 5.
Our mathematical model simulates complex I activity and ROS production by complex I in the context of siOPA1- or siCtrl-treated cells. (A) Simulations of complex I activity with the mathematical model in the context of siOPA1 or siCtrl-treated cells. (B) Simulations of ROS production by complex I with the mathematical model in the context of siOPA1- or siCtrl-treated cells.

References

    1. Agier, V., Oliviero, P., Lainé, J., L'Hermitte-Stead, C., Girard, S., Fillaut, S., Jardel, C., Bouillaud, F., Bulteau, A. L. and Lombès, A. (2012). Defective mitochondrial fusion, altered respiratory function, and distorted cristae structure in skin fibroblasts with heterozygous OPA1 mutations. Biochim. Biophys. Acta 1822, 1570-1580. 10.1016/j.bbadis.2012.07.002 - DOI - PubMed
    1. Alavi, M. V., Fuhrmann, N., Nguyen, H. P., Yu-Wai-Man, P., Heiduschka, P., Chinnery, P. F. and Wissinger, B. (2009). Subtle neurological and metabolic abnormalities in an Opa1 mouse model of autosomal dominant optic atrophy. Exp. Neurol. 220, 404-409. 10.1016/j.expneurol.2009.09.026 - DOI - PubMed
    1. Amati-Bonneau, P., Valentino, M. L., Reynier, P., Gallardo, M. E., Bornstein, B., Boissiere, A., Campos, Y., Rivera, H., de la Aleja, J. G., Carroccia, R.et al. (2008). OPA1 mutations induce mitochondrial DNA instability and optic atrophy ‘plus’ phenotypes. Brain 131, 338-351. 10.1093/brain/awm298 - DOI - PubMed
    1. Amati-Bonneau, P., Milea, D., Bonneau, D., Chevrollier, A., Ferré, M., Guillet, V., Gueguen, N., Loiseau, D., De Crescenzo, M.-A. P., Verny, C.et al. (2009). OPA1-associated disorders: phenotypes and pathophysiology. Int. J. Biochem. Cell Biol. 41, 1855-1865. 10.1016/j.biocel.2009.04.012 - DOI - PubMed
    1. Barboni, P., Valentino, M. L., La Morgia, C., Carbonelli, M., Savini, G., De Negri, A., Simonelli, F., Sadun, F., Caporali, L., Maresca, A.et al. (2013). Idebenone treatment in patients with OPA1-mutant dominant optic atrophy. Brain 136, e231. 10.1093/brain/aws280 - DOI - PubMed

Publication types

MeSH terms

LinkOut - more resources