. 2023 Nov;46(11):3644-3658.
doi: 10.1111/pce.14674. Epub 2023 Jul 27.

OnGuard3e: A predictive, ecophysiology-ready tool for gas exchange and photosynthesis research

Affiliations

OnGuard3e: A predictive, ecophysiology-ready tool for gas exchange and photosynthesis research

Thanh-Hao Nguyen et al. Plant Cell Environ. 2023 Nov.

Abstract

Gas exchange across the stomatal pores of leaves is a focal point in studies of plant-environmental relations. Stomata regulate atmospheric exchange with the inner air spaces of the leaf. They open to allow CO2 entry for photosynthesis and close to minimize water loss. Models that focus on the phenomenology of stomatal conductance generally omit the mechanics of the guard cells that regulate the pore aperture. The OnGuard platform fills this gap and offers a truly mechanistic approach with which to analyse stomatal gas exchange, whole-plant carbon assimilation and water-use efficiency. Previously, OnGuard required specialist knowledge of membrane transport, signalling and metabolism. Here we introduce OnGuard3e, a software package accessible to ecophysiologists and membrane biologists alike. We provide a brief guide to its use and illustrate how the package can be applied to explore and analyse stomatal conductance, assimilation and water use efficiencies, addressing a range of experimental questions with truly predictive outputs.

Keywords: CO2; guard cell; humidity; quantitative systems model; stomata; transpiration.


Figures

Figure 1
Figure 1
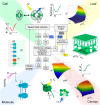
OnGuard3e gives access to a wide range of outputs from the temporal kinetics of the cell to whole‐plant gas exchange and photosynthesis. The computational cycle (center) of the OnGuard3e platform is shown surrounded by the range of output groupings that the platform makes available to the user. These groupings cross scales from the activities of single ion channels to assimilation (A), transpiration (E) and stomatal conductance (g s) of the whole plant. OnGuard3e computes the changes in solute gas and metabolic flux, clockwise over the cycle, with small increments in time (Δt) as indicated by the black arrows within the cycle. Environmental inputs comprise light (), the relative water feed (RWF) that subsumes water flux and its availability to the leaf, and the atmospheric partial pressures of water vapour (w air) and CO2 (pCO2), each indicated by the coloured boxes and grey arrows. Model outputs evolve with each increment in time and distribute between the molecular, cellular, leaf and canopy. Molecular and cellular outputs, indicated within Molecule and Cell quadrants, include the activities of transport and metabolic reactions, here illustrated with current–voltage curves; the cytosolic and vacuolar solute contents ([X]); the compartmental metabolic and solute fluxes (Φ X); and the voltages (ΔΨ) across the plasma membrane and tonoplast. The guard cell osmotic potential, volume and turgor, and hence stomatal aperture and conductance of Cell and Leaf quadrants, are derived from these outputs. Foliar outputs and the steady‐state surface plots of Leaf and Canopy quadrants are determined by the cellular outputs together with the environmental inputs of RWF, light, w air and pCO2, and the intermediates internal to the leaf, namely the partial pressures of water vapour (w p) and CO2 (pCi). Phenomenological models address only the Leaf and Canopy characteristics and lack mechanistic connection to the Molecule and Cell processes of the left side of the figure.
Figure 2
Figure 2
OnGuard3e working modes and model parameter access. (a) OnGuard3e provides three working modes, Ecology, Phyiology and Biophysics, with increasing access rights to the parameters defining a model. Each mode is designed to fit the respective user expertise. To choose the appropriate working mode, go to Options, Preferences from the dropdown menu or press Ctrl + Alt + P (1). From the Settings window, click on the Operation Mode button (2) on the left side, and select the appropriate mode in the Interface Level field (3). The information about the features provided by each mode is presented in the Specific Features field (4). Users cannot add or remove these features unless the Custom mode (black arrow) is chosen in the Interface Level field. (b) OnGuard3e includes optional cartoon displays that are updated during simulations when run in the Begin Simulation mode. Shown here are the transport (left) and gas exchange (right) displays. The transport display shows the ion fluxes across each of the two membranes, both as total flux for each ionic species and as the flux through the individual transporters. The gas exchange display shows the net water vapour (blue) and CO2 (green) fluxes through the stomatal pore (center) and within the leaf (corners, left and right). Also shown is the current relative humidity and CO2 partial pressure within the leaf air space. Arrows in every case are scaled logarithmically so that a twofold change in length indicates a 10‐fold change in flux. (c) Model parameters are divided between eight property pages in the Edit Model window, accessed by going to Modelling, Edit Model Parameters from the dropdown menue or pressing Ctrl + E. In the Edit Model window, the icons representing the eight property pages are shown on the left (upper panel). The information and adjustable parameters relating to each property are shown in each of the main windows (upper panel right and below). The Water‐Use Efficiency page with changes to the CO2 cycle are shown (below, left) as an example of modifying cycle‐based model parameters. The Ext. CO2 Protocol pop‐up window, which is accessed by following steps (1) and (2), provides the adjustable CO2 cycle (3), the option to set a constant external CO2 value with the Set Flat button (4) of a given value (5). Protocols with CO2 changes during the day can be achieved by repositioning nodes (blue arrows) and steps (black arrows) or by double‐clicking and entering the precise time point and CO2 value (6). Nodes can be added at the cursor location or selected and removed from the protocol by clicking New Corner or Delete Hook, respectively. OnGuard3e allows users to control the daily cycle of four environmental inputs, atmospheric CO2 and relative humidity (RH), blue and red light. Light is accessed through the Light Cycles page and can be modified similarly. The Solute Concentrations (1) page (bottom, right) gives the user access to parameters relevant to guard cell solute flux. In the Physiology and Biophysics modes, the concentration of each solute in each compartment is accessible by clicking directly on the value and typing a desired number (2). In the Biophysics mode, new solutes can be added to the model by clicking the Add Solute button (3) and subsequently entering all required information into the pop‐up window (4). Users can also change the information of a solute via Edit Solute and remove a solute by clicking Del Solute. It is advisable, when adding and deleting solutes—as when altering solute concentrations—to ensure any changes are balanced in charge. Note that adding a new solute will not impact on model outputs unless an appropriate set of transporters at each membrane are also added to the model. Likewise, entirely removing a solute from a model without also removing the associated transporters is guaranteed to cause computational failure. In the Ecology mode, access is restricted to the concentrations of extant solutes in the apoplast.
Figure 3
Figure 3
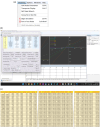
Running and logging an OnGuard simulation. OnGuard simulations are run from the Modelling dropdown menu (a) using either the Begin Simulation (1) or the Run in Fast Mode (2) command. The Begin Simulation command opens a flux window (b) that also gives the user options for time autoincrements and CSV file logging, as well as readouts for the fluxes across the plasma membrane and tonoplast and contents of the major compartments of the guard cell. CSV files (c) can be selected to log both net fluxes as well as the individual ion and solute fluxes along with a full range of intermediate and macroscopic variables with each time increment.
Figure 4
Figure 4
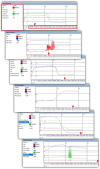
Real‐time tracking of a simulation using the Chart Recorder. The Chart Recorder tool of Onguard3e provides real‐time visualization of a selection of commonly sought outputs during the simulation. The simulation mode (Begin Simulation or Run Fast mode) determines how the user interacts with Chart Recorder. In Begin Simulation mode, the user can switch freely between Chart Recorder tabs (red box and ticks) during simulation to observe the changes of different parameters, adjust the time base for all tabs, and adjust the scaling within each tab. In Run Fast mode, the time base and scaling are not accessible during simulation and switching between tabs must be done using the drop‐down list within the Run Fast mode box. The appearance of the chart recorder can be customized by modifying the parameters in the chart properties table when a simulation is not running, or is paused. Adding a new solute generates a new chart recorder tab once the model is saved and reopened.
Figure 5
Figure 5
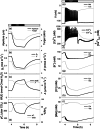
ABA‐evoked stomatal characteristics using the ‘hard‐wired’ OnGuard3e model. Selected outputs plotted from the data logged on running the ARAB‐wt‐ABA.ogb model with 1 μM ABA added over the period of 4–6 h in the light with 70% RH and 400 μbar CO2 in the atmosphere. Shown are (a) the stomatal aperture and guard cell turgor, (b) stomatal conductance, g s, and transpiration, E, (c) water‐use efficiency, and carbon assimilation, A, (d) the partial pressure of CO2, pCi, and %RH, in the leaf air space, (e) the plasma membrane and tonoplast voltages, (f) the cytosolic‐free Ca2+ concentration, [Ca2+]i, and total vacuolar Ca2+ concentration, and the cytosolic and vacuolar concentrations of K+ (g), Cl (h), and total Mal (i). ABA, abscisic acid; Mal, malate; RH, relative humidity.

References

    1. Acharya, B.R. , Jeon, B.W. , Zhang, W. & Assmann, S.M. (2013) Open stomata 1 (OST1) is limiting in abscisic acid responses of Arabidopsis guard cells. New Phytologist, 200(4), 1049–1063. Available from: 10.1111/nph.12469 - DOI - PubMed
    1. Alvim, F.S.L. (2022) Potassium channels of C3 and C4 plants (PhD Thesis, University of Glasgow).
    1. Assmann, S.M. & Jegla, T. (2016) Guard cell sensory systems: recent insights on stomatal responses to light, abscisic acid, and CO2 . Current Opinion in Plant Biology, 33, 157–167. Available from: 10.1016/j.pbi.2016.07.003 - DOI - PubMed
    1. Beljaars, A.C.M. , Viterbo, P. , Miller, M.J. & Betts, A.K. (1996) The anomalous rainfall over the United States during July 1993: sensitivity to land surface parameterization and soil moisture. Monthly Weather Review, 124(3), 362–383. Available from: 10.1175/1520-0493(1996)124<0362:tarotu>2.0.co;2 - DOI
    1. Berry, J.A. , Beerling, D.J. & Franks, P.J. (2010) Stomata: key players in the earth system, past and present. Current Opinion in Plant Biology, 13(3), 232–239. - PubMed

Publication types