. 2023 Dec;14(1):2240139.
doi: 10.1080/19491034.2023.2240139.

A survey of the specificity and mechanism of 1,6 hexanediol-induced disruption of nuclear transport

Affiliations

A survey of the specificity and mechanism of 1,6 hexanediol-induced disruption of nuclear transport

Elizabeth C Riquelme Barrientos et al. Nucleus. 2023 Dec.

Abstract

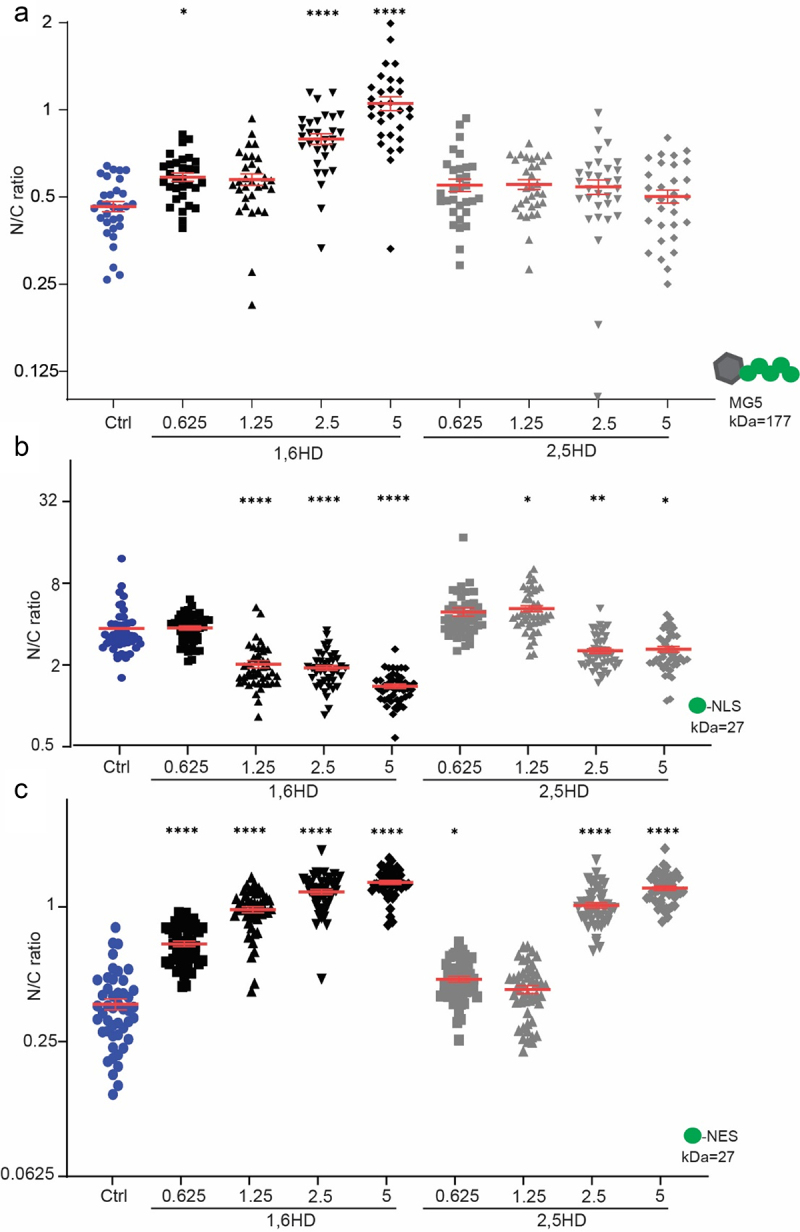
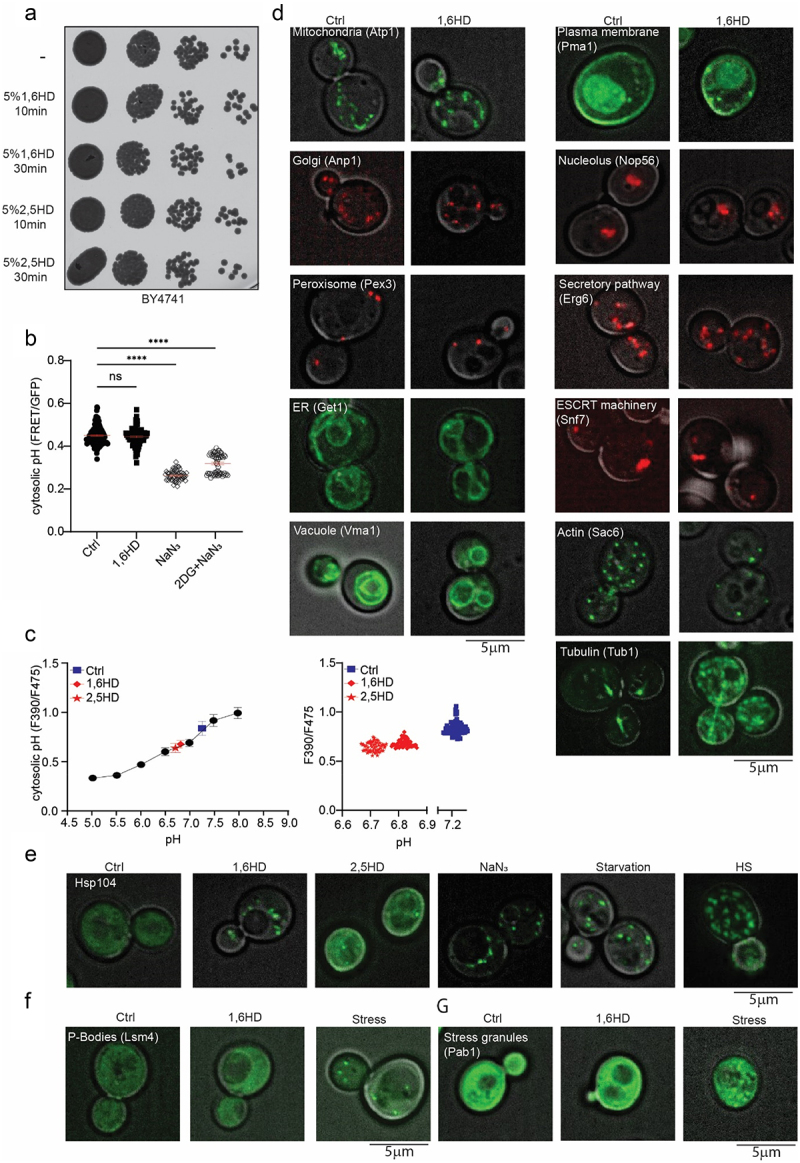
Selective transport through the nuclear pore complex (NPC) depends on the dynamic binding of FG-repeat containing nucleoporins, the FG-nups, with each other and with Karyopherins (Kaps). Here, we assessed the specificity and mechanism by which the aliphatic alcohol 1,6-hexanediol (1,6HD) disrupts the permeability barrier of NPCs in live baker's yeast cells. After a 10-minute exposure to 5% 1,6HD, no notable changes were observed in cell growth, cytosolic pH and ATP levels, or the appearance of organelles. However, effects on the cytoskeleton and Hsp104 were noted. 1,6HD clearly affected the NPC permeability barrier, allowing passive nuclear entry of a 177kDa reporter protein that is normally confined to the cytosol. Moreover, multiple Kaps were displaced from NPCs, and the displacement of Kap122-GFP correlated with the observed passive permeability changes. 1,6HD thus temporarily permeates NPCs, and in line with Kap-centric models, the mechanism includes the release of numerous Kaps from the NPCs.

Keywords: 1,6-hexanediol; Karyopherin; Nuclear pore complex; Nuclear transport receptors; aliphatic alcohol; baker’s yeast; liquid-liquid phase separation; nuclear transport.


Conflict of interest statement

No potential conflict of interest was reported by the author(s). The authors declare no competing interests.

Figures

Figure 1.
Figure 1.
Disruption of NPC permeability barrier by 1,6HD. (a-c) Nuclear compartmentalization of GFP-based reporter proteins (MG5, GFP-NES, GFP-NLS) in yeast cells exposed for 10 min with the indicated concentrations of 1,6HD or 2,5HD. MG5 is a fusion of Maltose Binding Protein and 5 GFPs; GFP-NLS features the classical Simian Virus 40 NLS and GFP-NES the Stress-Seventy subfamily B1 NES. The N/C ratio is the ratio of the average fluorescence in the nucleus (N) over that in the cytoplasm (c). One-way ANOVA with Dunnett’s multiple comparison test comparing treatment to control was used to calculate the statistical significance in panel a and C and the non-parametrical Kruskal-Wallis with Dunn’s multiple comparison test in B. Error bars reflect the Standard Error of the Mean (SEM) of three independent experiments and a total of at least 30 cells per condition. P-values*<0,05 **<0,01 ****<0,0001.
Figure 2.
Figure 2.
Impact of 1,6HD on growth, physiology and subcellular structures. (a) Growth assay showing serial dilutions of cultures exposed to 5% 1,6HD or 2,5HD for the indicated times. (b) Free ATP levels in cells measured using a FRET-based ATP-sensor; lower FRET/GFP ratio indicates lower free ATP. Cells were untreated (ctrl), exposed to 5% 1,6HD for 10 min, or exposed for 30 min to metabolic poisons azide (NaN3) or to NaN3 plus deoxyglucose (NaN3 +2DG). The error bar of the scatter plot reflects the SEM of three independent experiments. At least 60 cells per condition were analyzed. One-way ANOVA with Dunnett’s multiple comparison test was used to calculate the statistical significance of the difference in FRET/GFP ratios when comparing treatment to control. (c) Calibration curve for cytosolic pH values of the pH sensor pHluorin (F390/F475) in cells (black circles). The pH before (ctrl, blue squares) and after 10 min exposure to 1,6HD (red diamonds) or 2,5 HD (red stars) are indicated. Each point represents the mean and SEM from 60 cells (left graph), individual measurements are shown (right graph). (d) Fluorescence images of different cellular structures endogenously tagged with either GFP or mCherry, before and after 10 min exposure to 5% 1,6HD. (e) Fluorescence images showing localization of endogenously tagged Hsp104-GFP after 10 min exposure to 5% 1,6HD or 5% 2,5HD and under indicated stress conditions. (f,g) Fluorescence images showing localization of endogenously tagged Lsm4 (P-bodies, F) or Pab1 (Stress granules, G) with GFP after 10 min exposure with 5% 1,6HD and after induction of stress. Representative images of three independent replicates. The scales bars are 5 μm.
Figure 3.
Figure 3.
Impact of 1,6HD on the abundance and NE-localization of nups. (a) Cartoon representation of NPC indicating the position of the nups analyzed in B. (b) Endogenous Nup-GFP protein levels in whole cells lysates as determined by western blot before and after 10 min exposure to 5% 1,6HD; quantification gives mean, SEM and P values from unpaired t-test from at least three independent replicates. Fluorescence images of endogenously GFP-tagged nups before and after 10 min exposure with 5% 1,6HD. Representative images of three independent replicates. Shown are maximum projections of the 4 z-stacks around the z-stack that most clearly showed the NE. Supplementary Figure S2 shows maximum projections of the whole cell. The scale bar is 5 μm.
Figure 4.
Figure 4.
Impact of 1,6HD on NTRs. (a) Fluorescence images of endogenously GFP-tagged NTRs after 10 min exposure with 5% 1,6HD. Representative images of three independent replicates. The scale bar is 10 μm. Box indicates the zoomed-in single cell. (b) Nuclear accumulation of Kap122-GFP in yeast cells exposed for 10 min with the indicated concentrations of 1,6HD. Mean and SEM of three independent experiments; 90 cells per condition were analyzed; P-values from One-way ANOVA with Dunnett’s multiple comparison test ***<0,0005 ****<0,0001. (c) Average transport function measured with MG5 (dark red), GFP-NLS (pink) and GFP-NES (red) (from Fig1ABC but normalized on a scale from 0 to 1), as a function of Kap122-GFP location at the NE and nucleus (from Fig 4b) under control conditions and increasing concentrations of 1,6HD. Symbols as in 4B: 0% circles; 0,625% squares; 1,25% triangles up; 2,5% triangles down; 5% diamonds.

References

    1. Dultz E, Wojtynek M, Medalia O, et al. The nuclear pore complex: birth, life, and death of a cellular behemoth. Cells. 2022;11(9):1–17. doi: 10.3390/cells11091456. - DOI - PMC - PubMed
    1. Javier F-M, Rout MP.. One ring to rule them all? Structural and functional diversity in the nuclear pore complex. Trends Biochem Sci. 2021;46(7):595–607. doi: 10.1016/j.tibs.2021.01.003 - DOI - PMC - PubMed
    1. Hampoelz B, Andres-Pons A, Kastritis P, et al. Structure and assembly of the nuclear pore complex. Annu Rev Biophys. 2019;48:515–536. doi: 10.1146/annurev-biophys-052118-115308 - DOI - PubMed
    1. Wing CE, Yee Joyce Fung H, Min Chook Y. Karyopherin-mediated nucleocytoplasmic transport. Nat Rev Mol Cell Biol. 2022;23(5):307–328. doi: 10.1038/s41580-021-00446-7 - DOI - PMC - PubMed
    1. Bayliss R, Littlewood T, Stewart M. Structural Basis for the Interaction between FxFG nucleoporin repeats and importin-β in nuclear trafficking. Cell. 2000;102(1):99–108. doi: 10.1016/S0092-8674(00)00014-3. - DOI - PubMed

Publication types

MeSH terms

LinkOut - more resources