. 2023 Dec;9(12):2425-2443.
doi: 10.1016/j.jacep.2023.05.042. Epub 2023 Jul 26.

Unraveling Impacts of Chamber-Specific Differences in Intercalated Disc Ultrastructure and Molecular Organization on Cardiac Conduction

Affiliations

Unraveling Impacts of Chamber-Specific Differences in Intercalated Disc Ultrastructure and Molecular Organization on Cardiac Conduction

Heather L Struckman et al. JACC Clin Electrophysiol. 2023 Dec.

Abstract

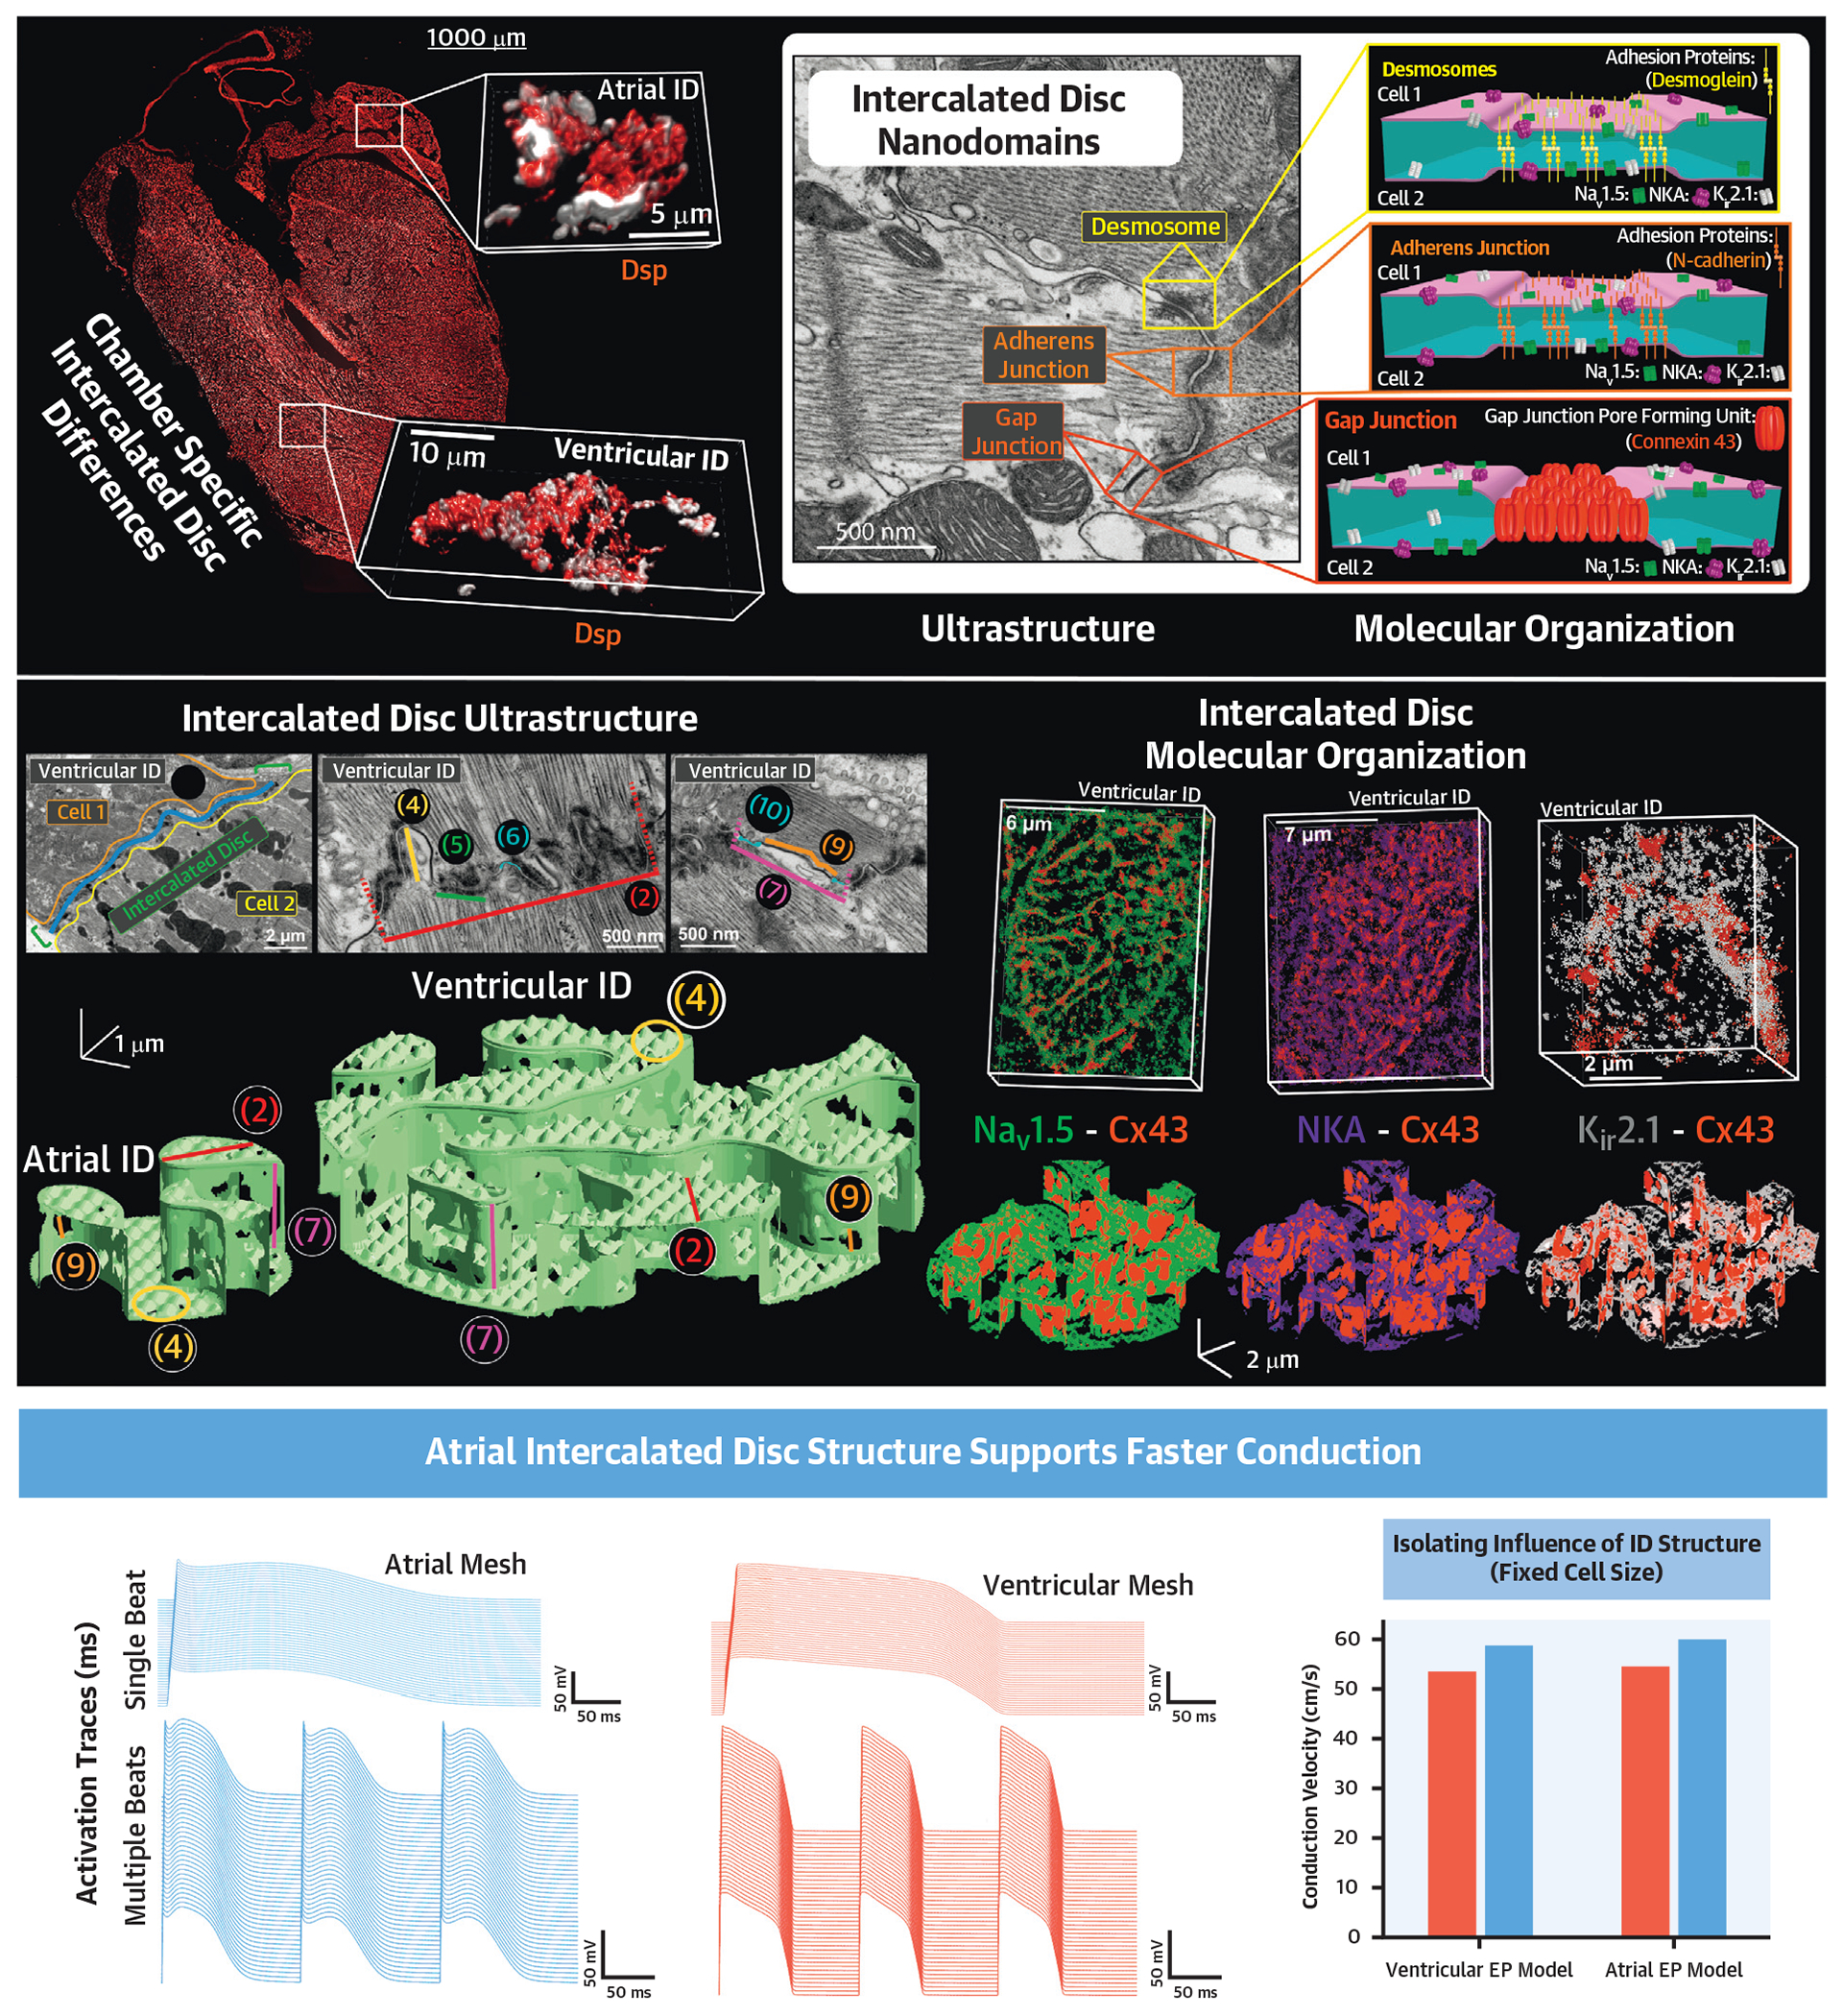
Background: Propagation of action potentials through the heart coordinates the heartbeat. Thus, intercalated discs, specialized cell-cell contact sites that provide electrical and mechanical coupling between cardiomyocytes, are an important target for study. Impaired propagation leads to arrhythmias in many pathologies, where intercalated disc remodeling is a common finding, hence the importance and urgency of understanding propagation dependence on intercalated disc structure. Conventional modeling approaches cannot predict changes in propagation elicited by perturbations that alter intercalated disc ultrastructure or molecular organization, because of lack of quantitative structural data at subcellular through nano scales.

Objectives: This study sought to quantify intercalated disc structure at these spatial scales in the healthy adult mouse heart and relate them to chamber-specific properties of propagation as a precursor to understanding the effects of pathological intercalated disc remodeling.

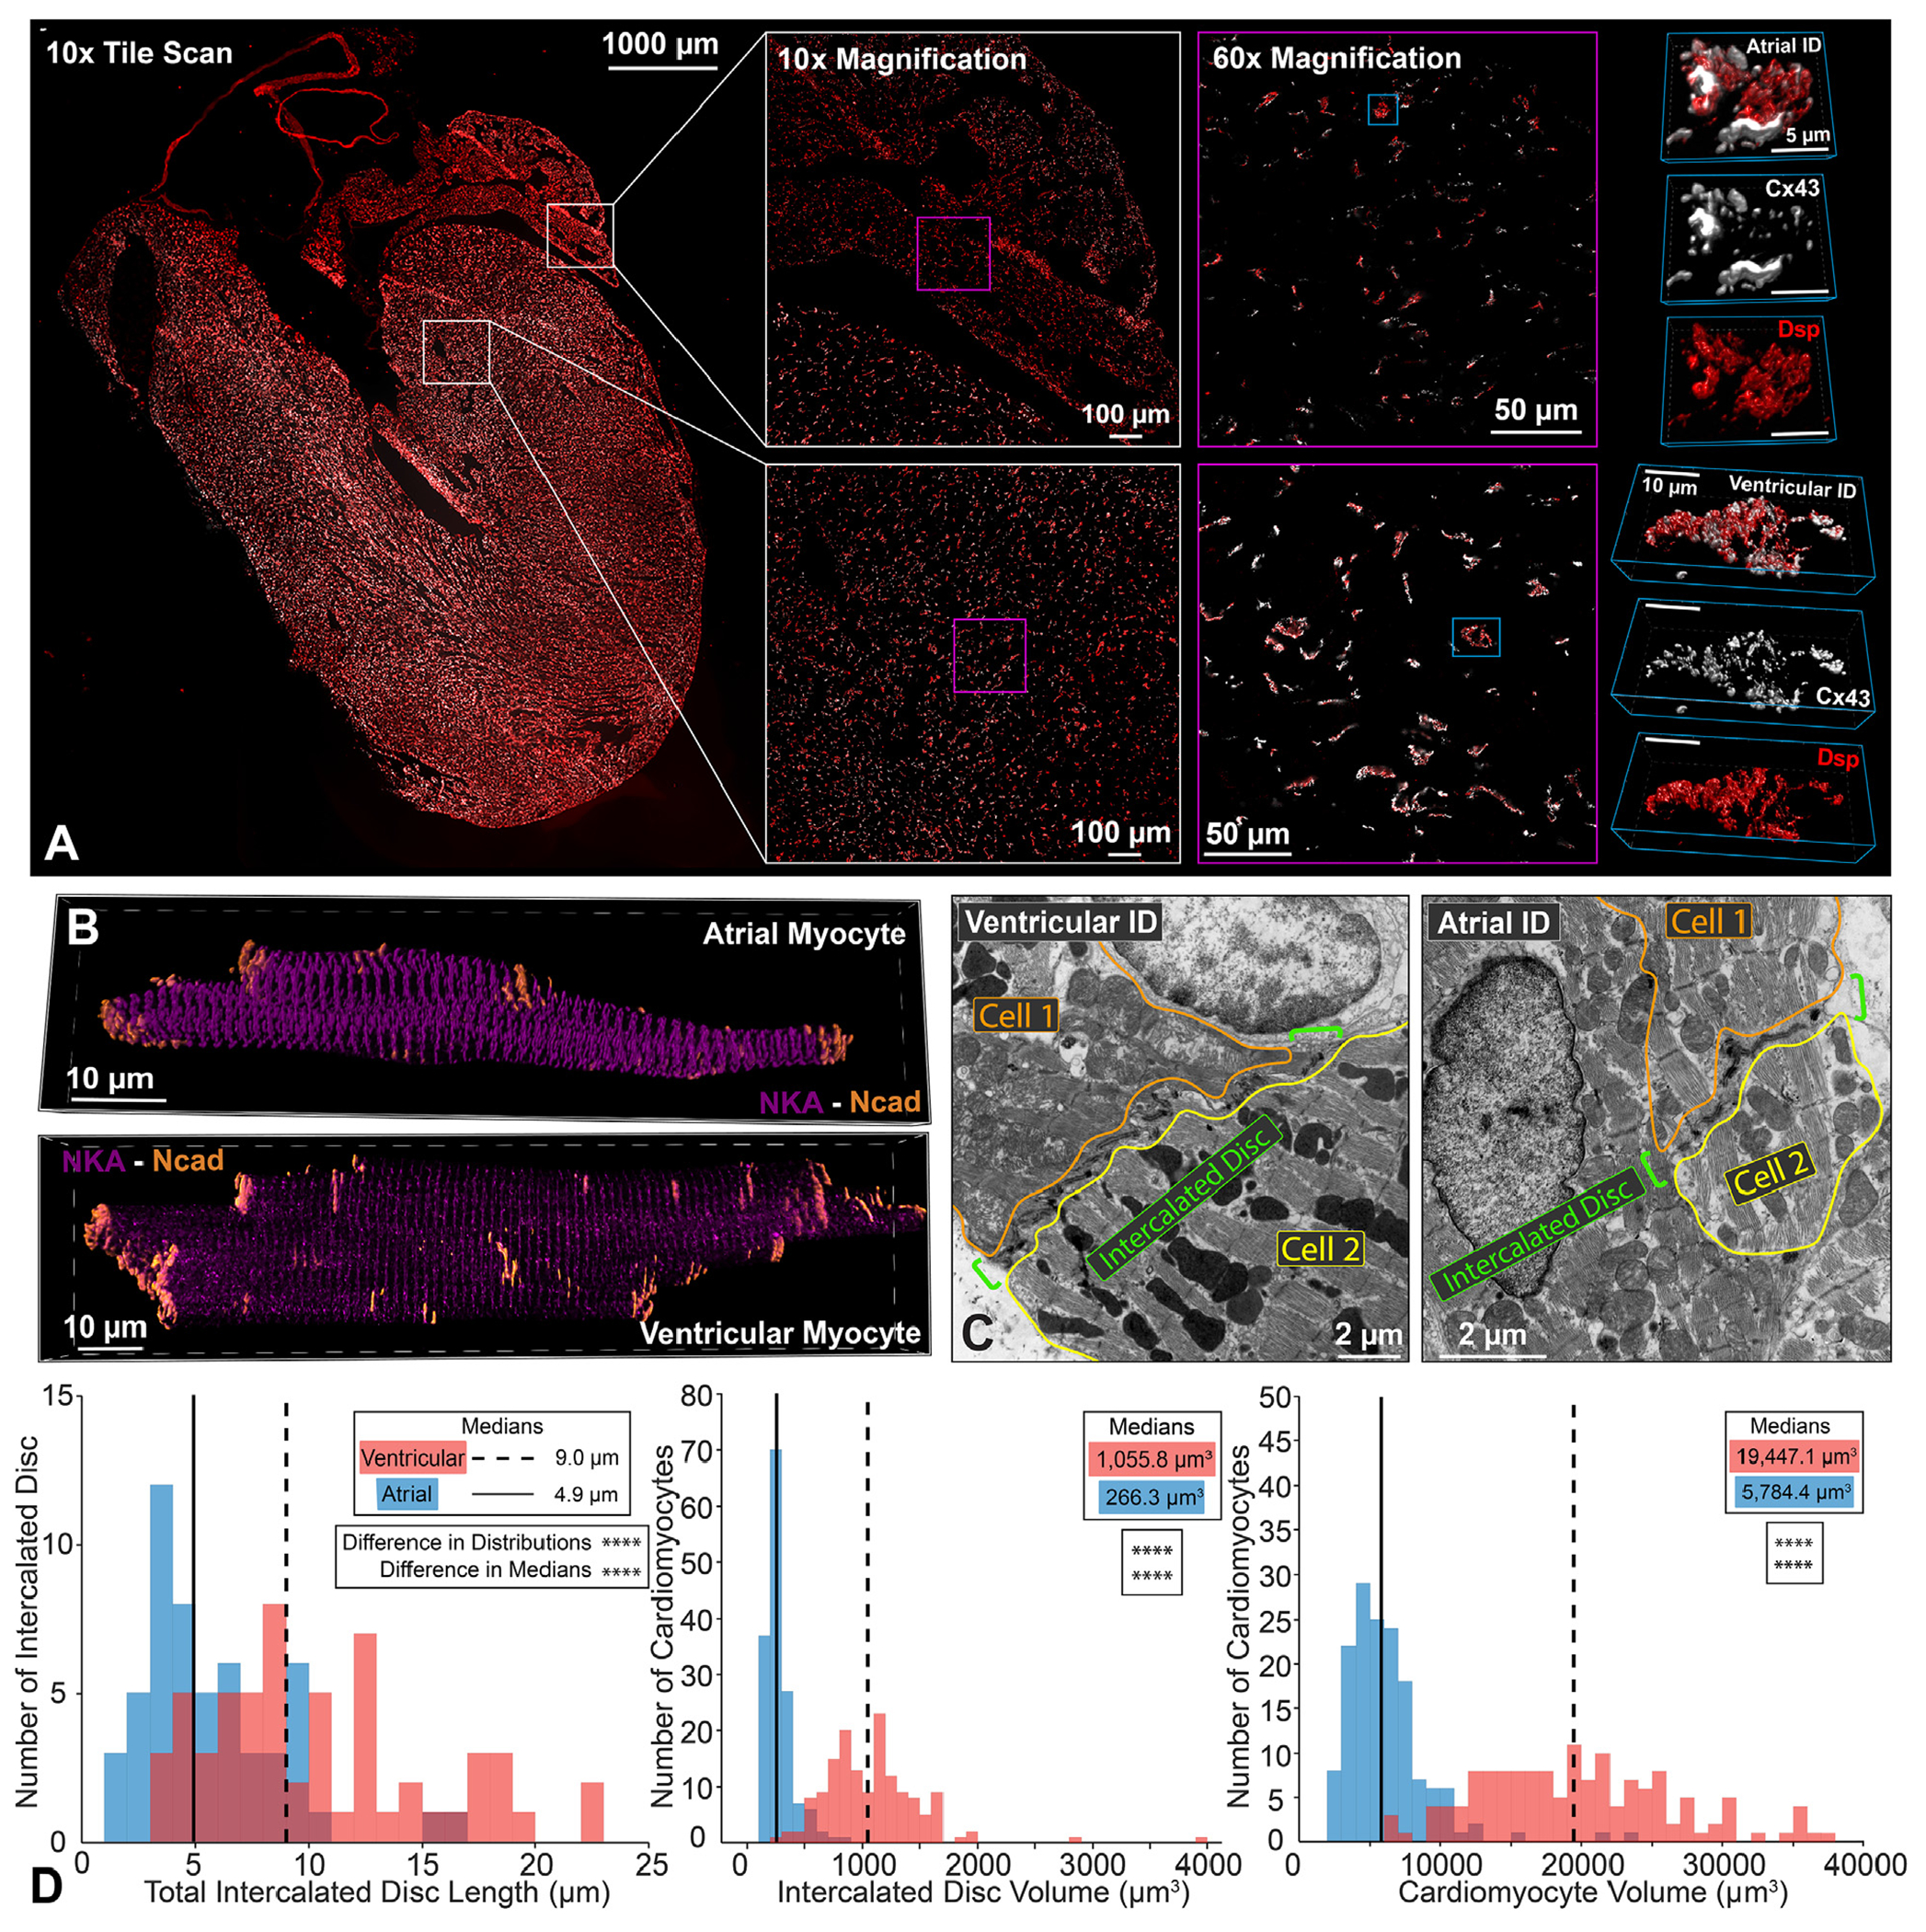
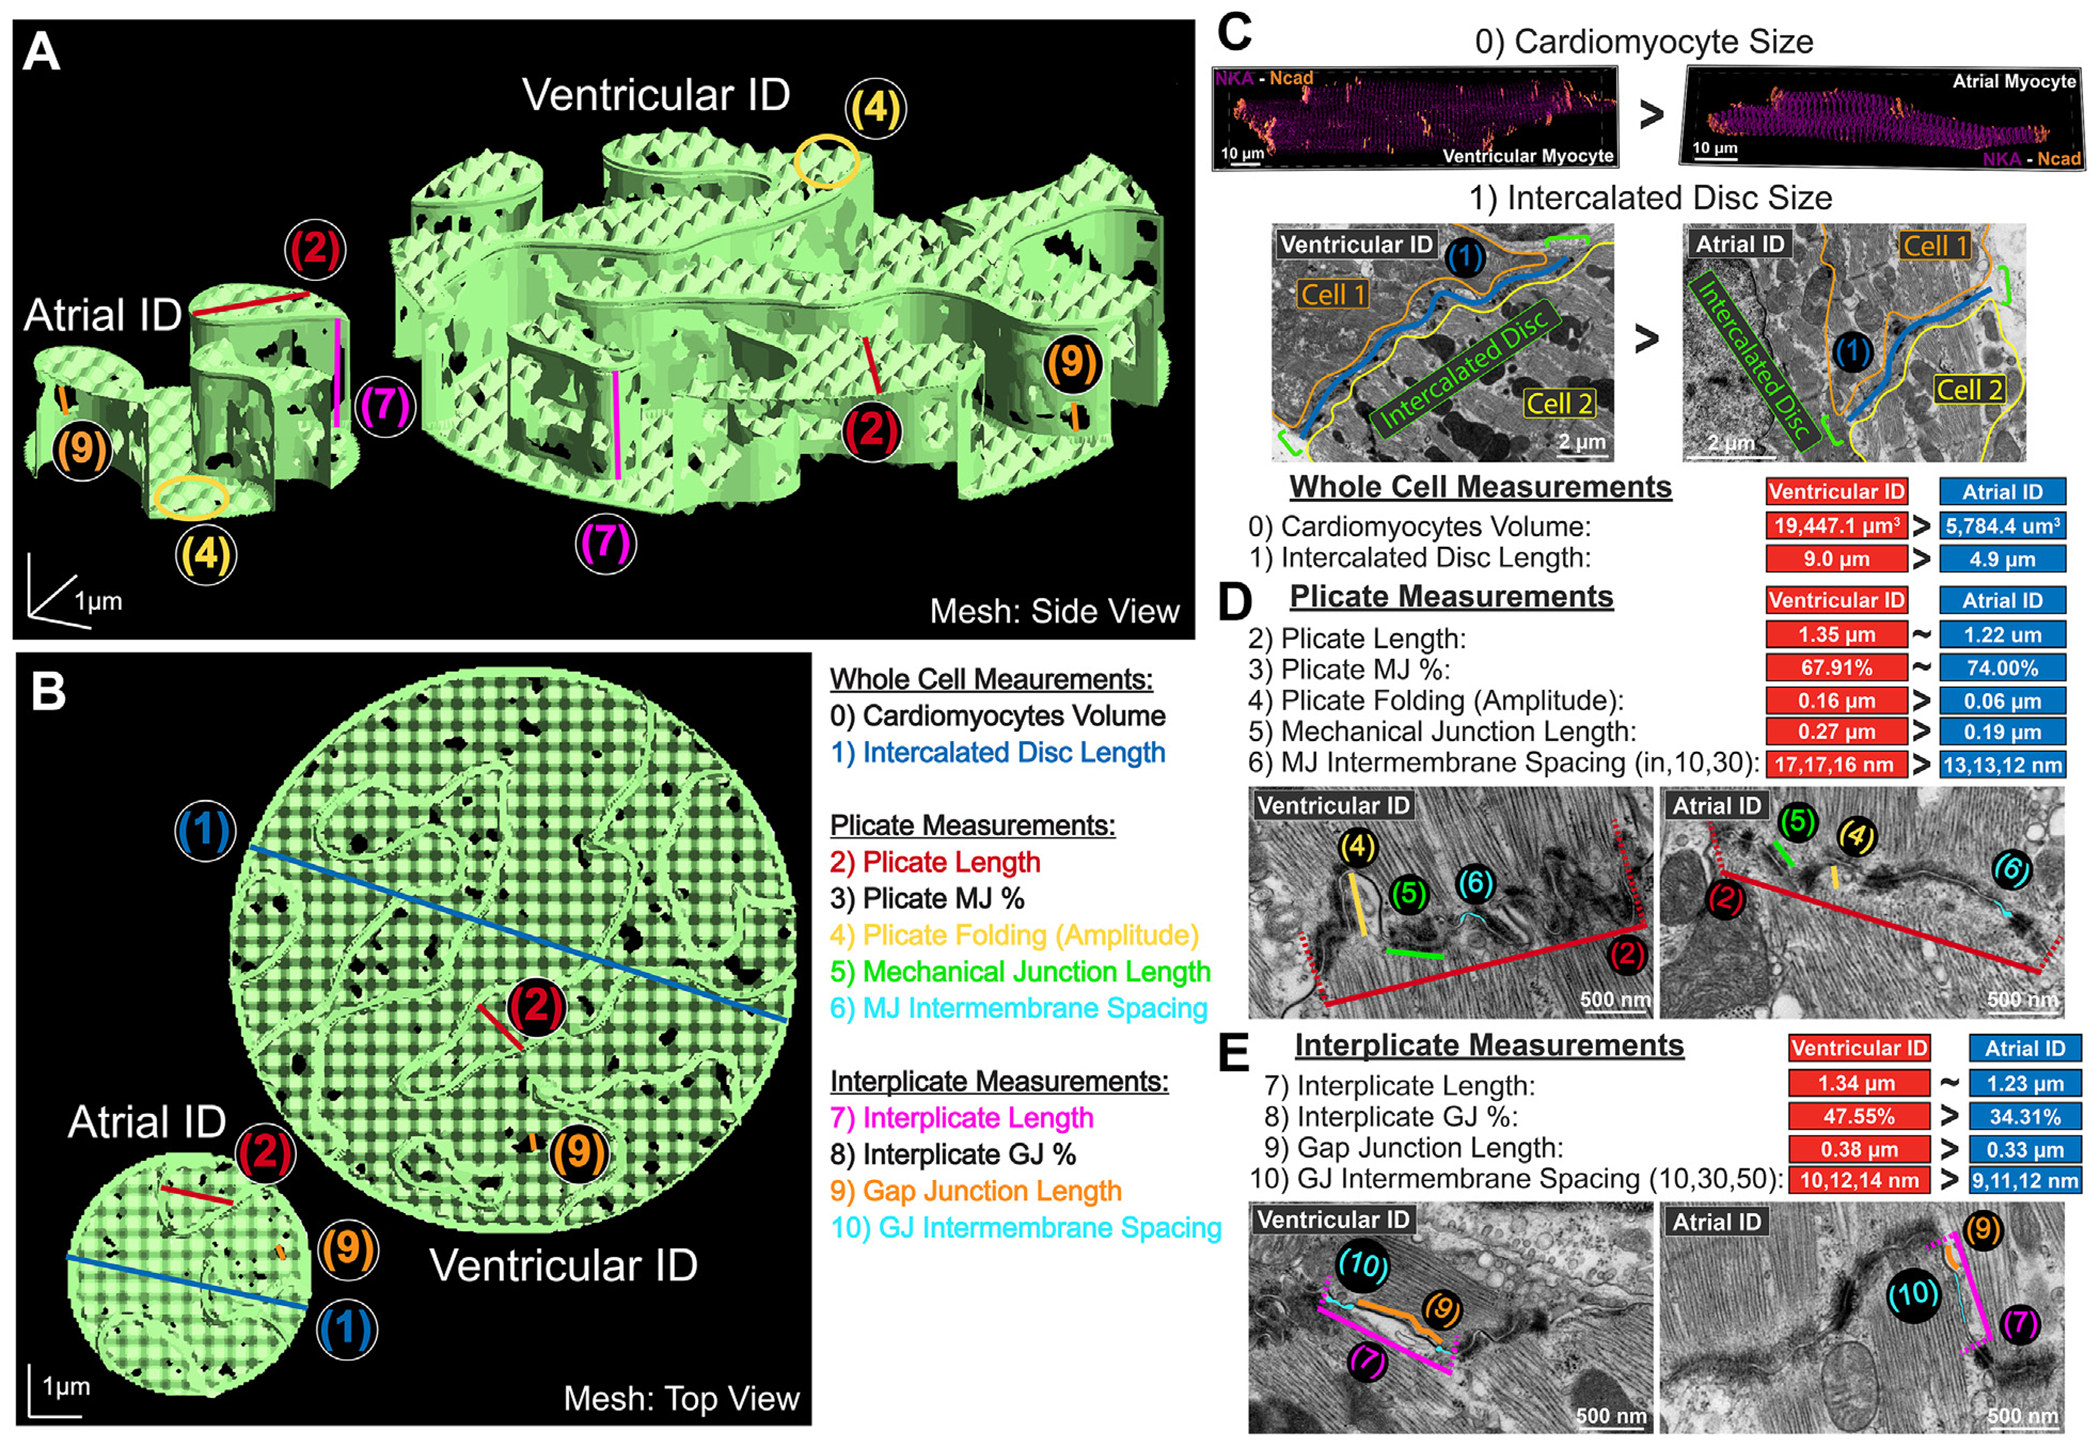
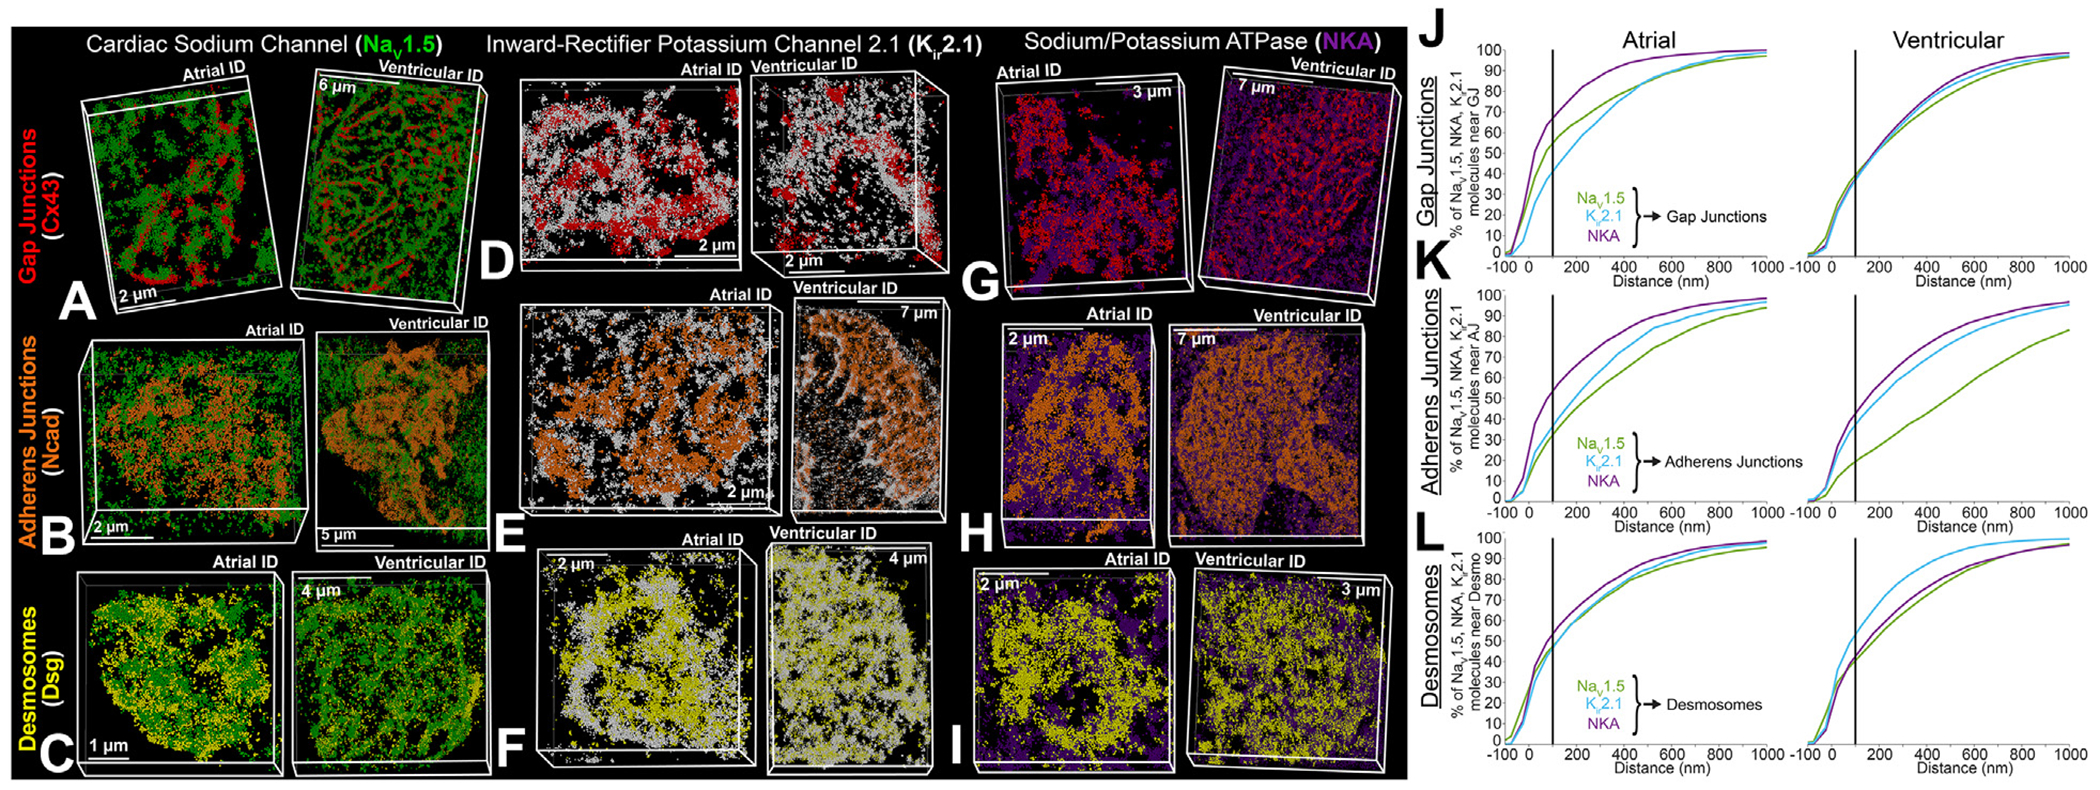
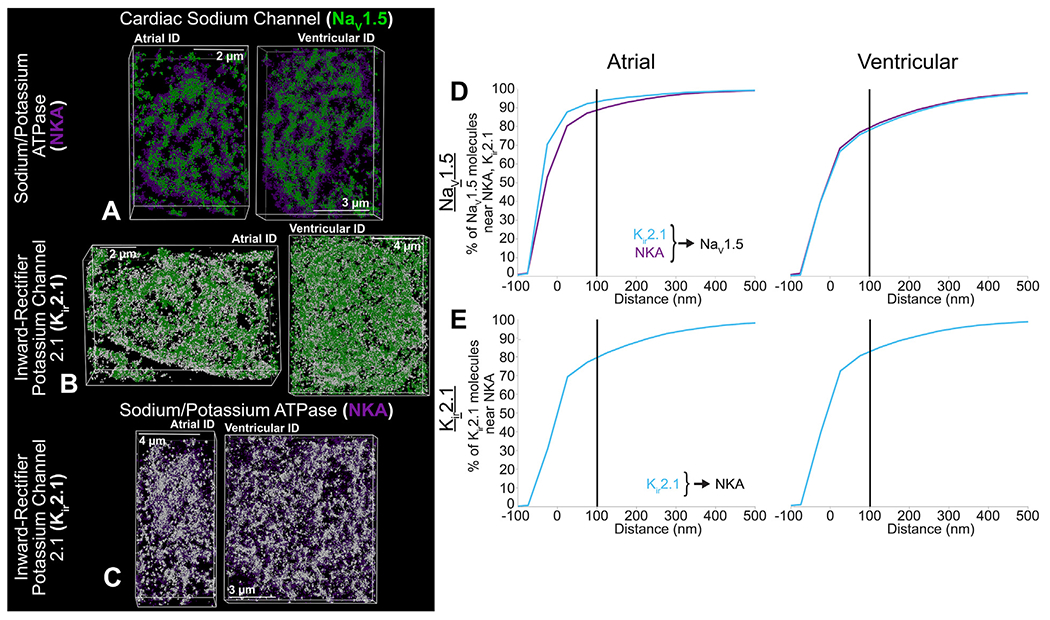
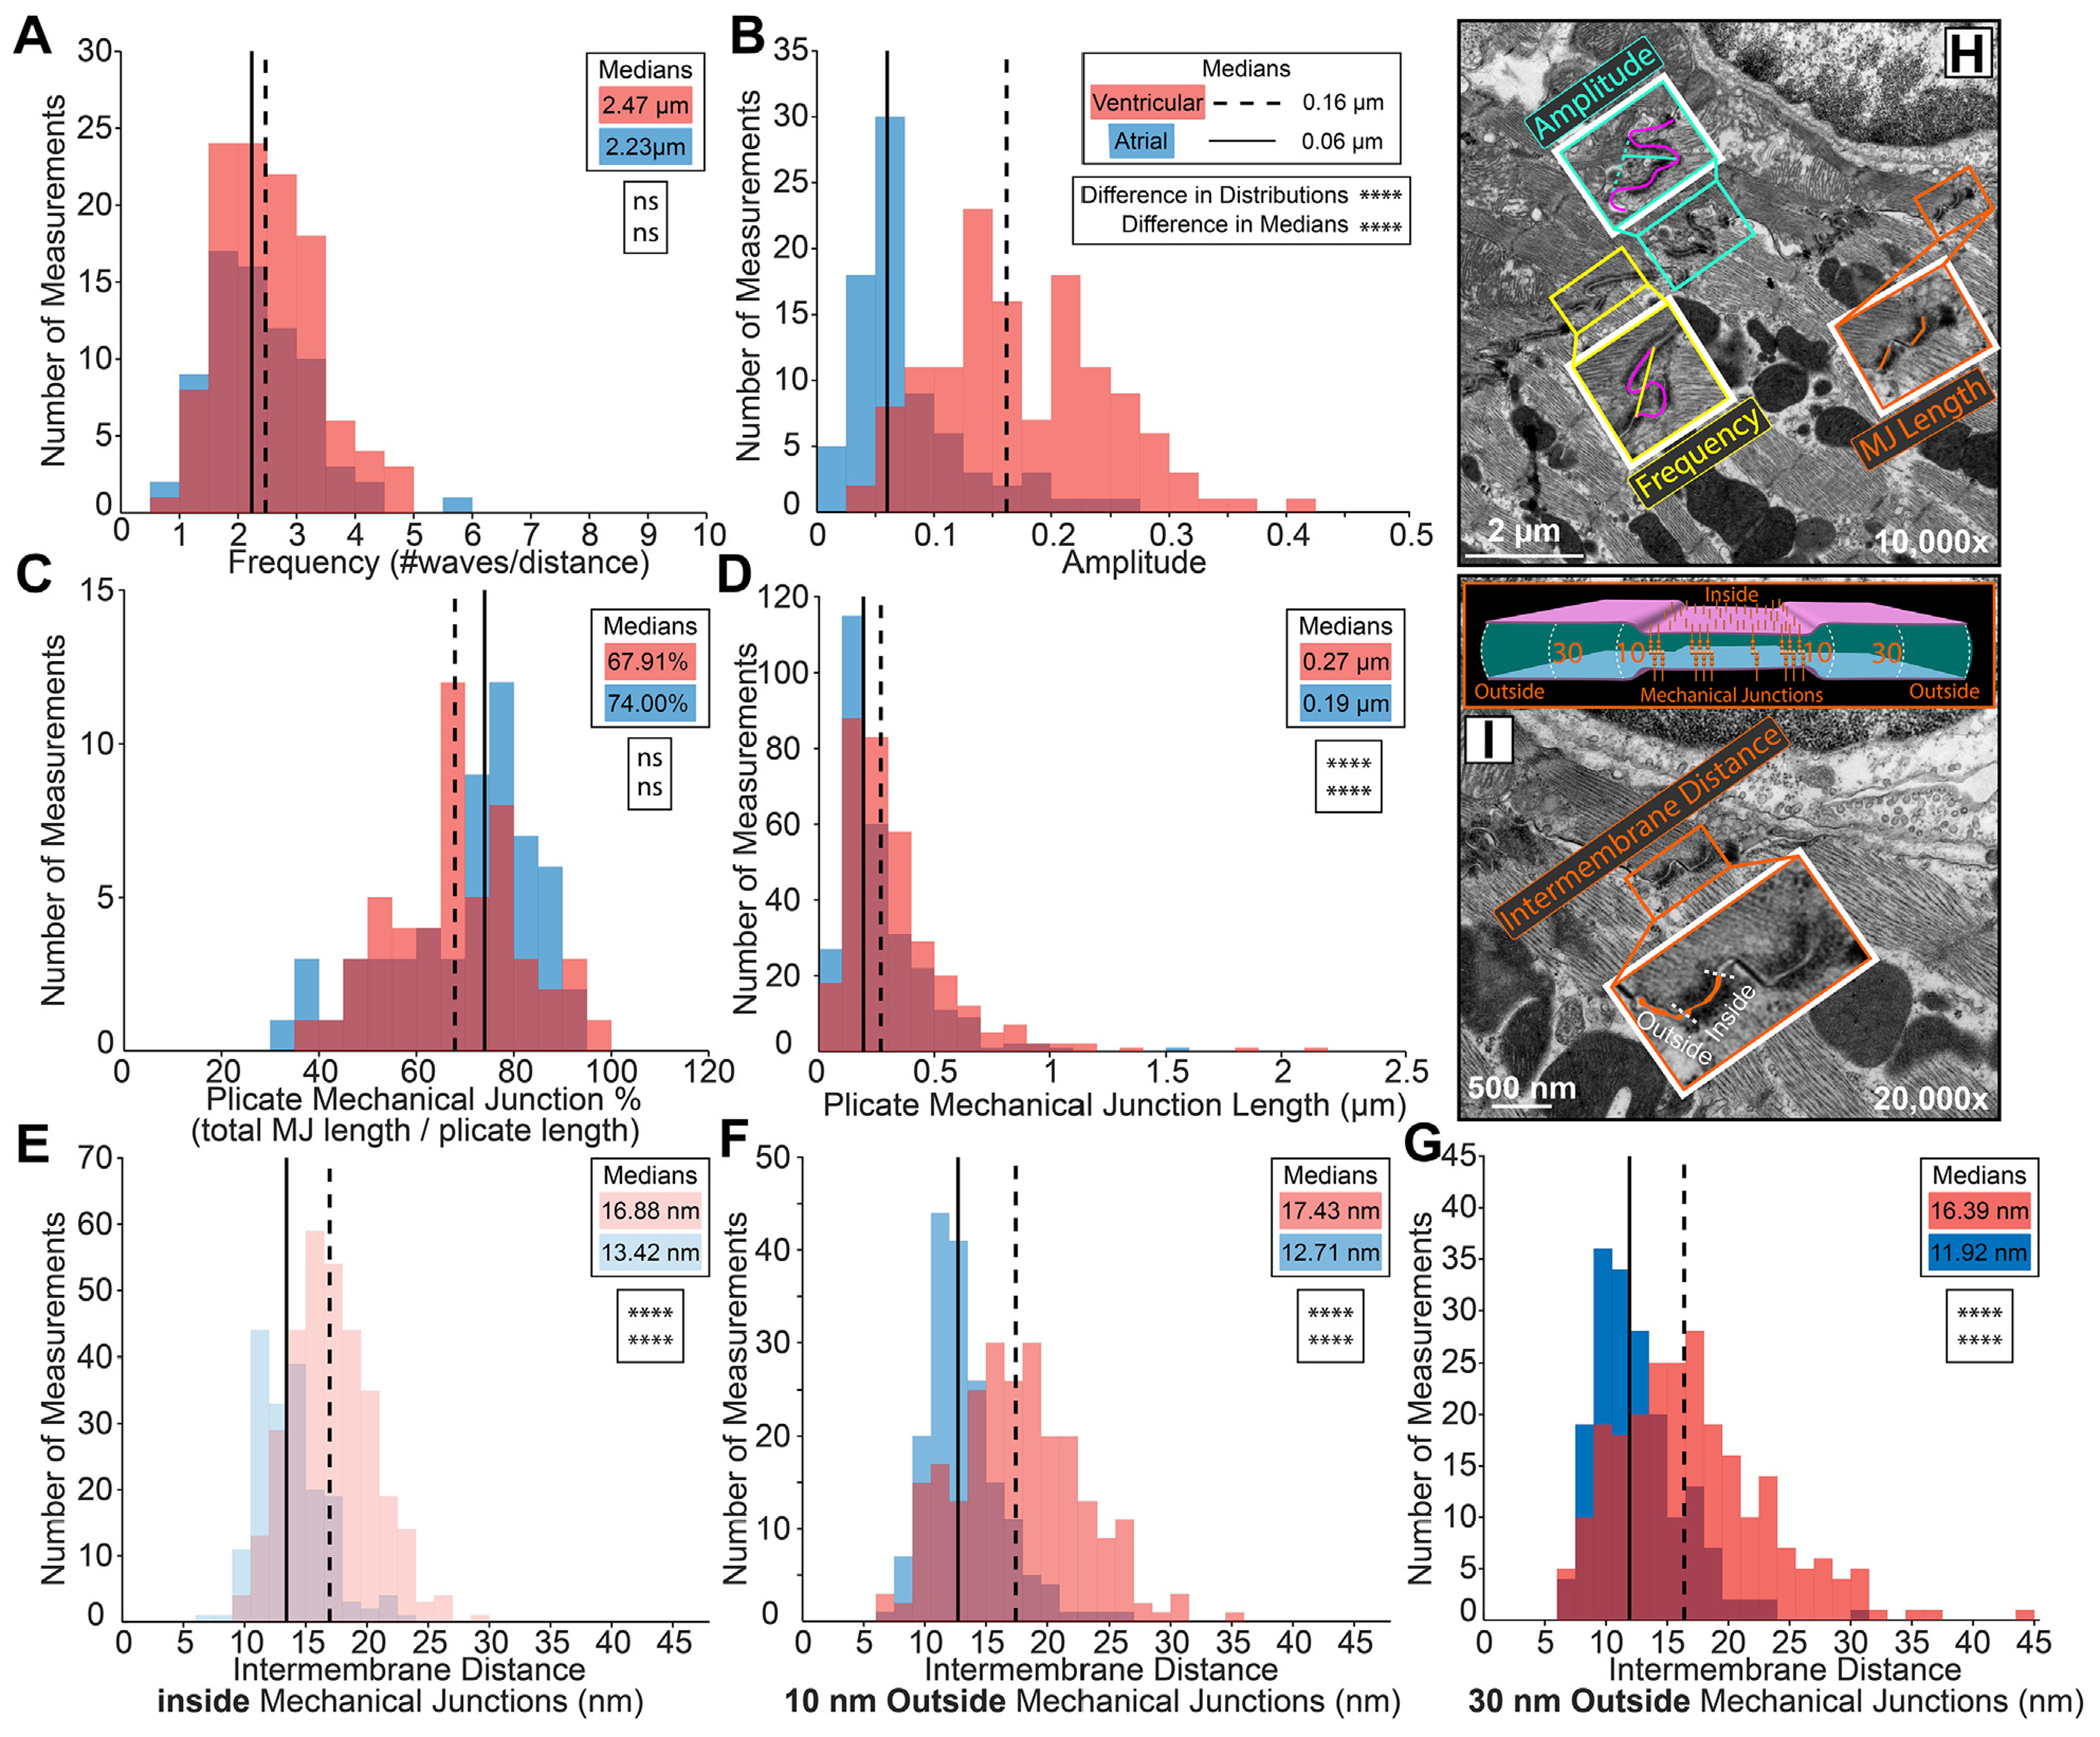
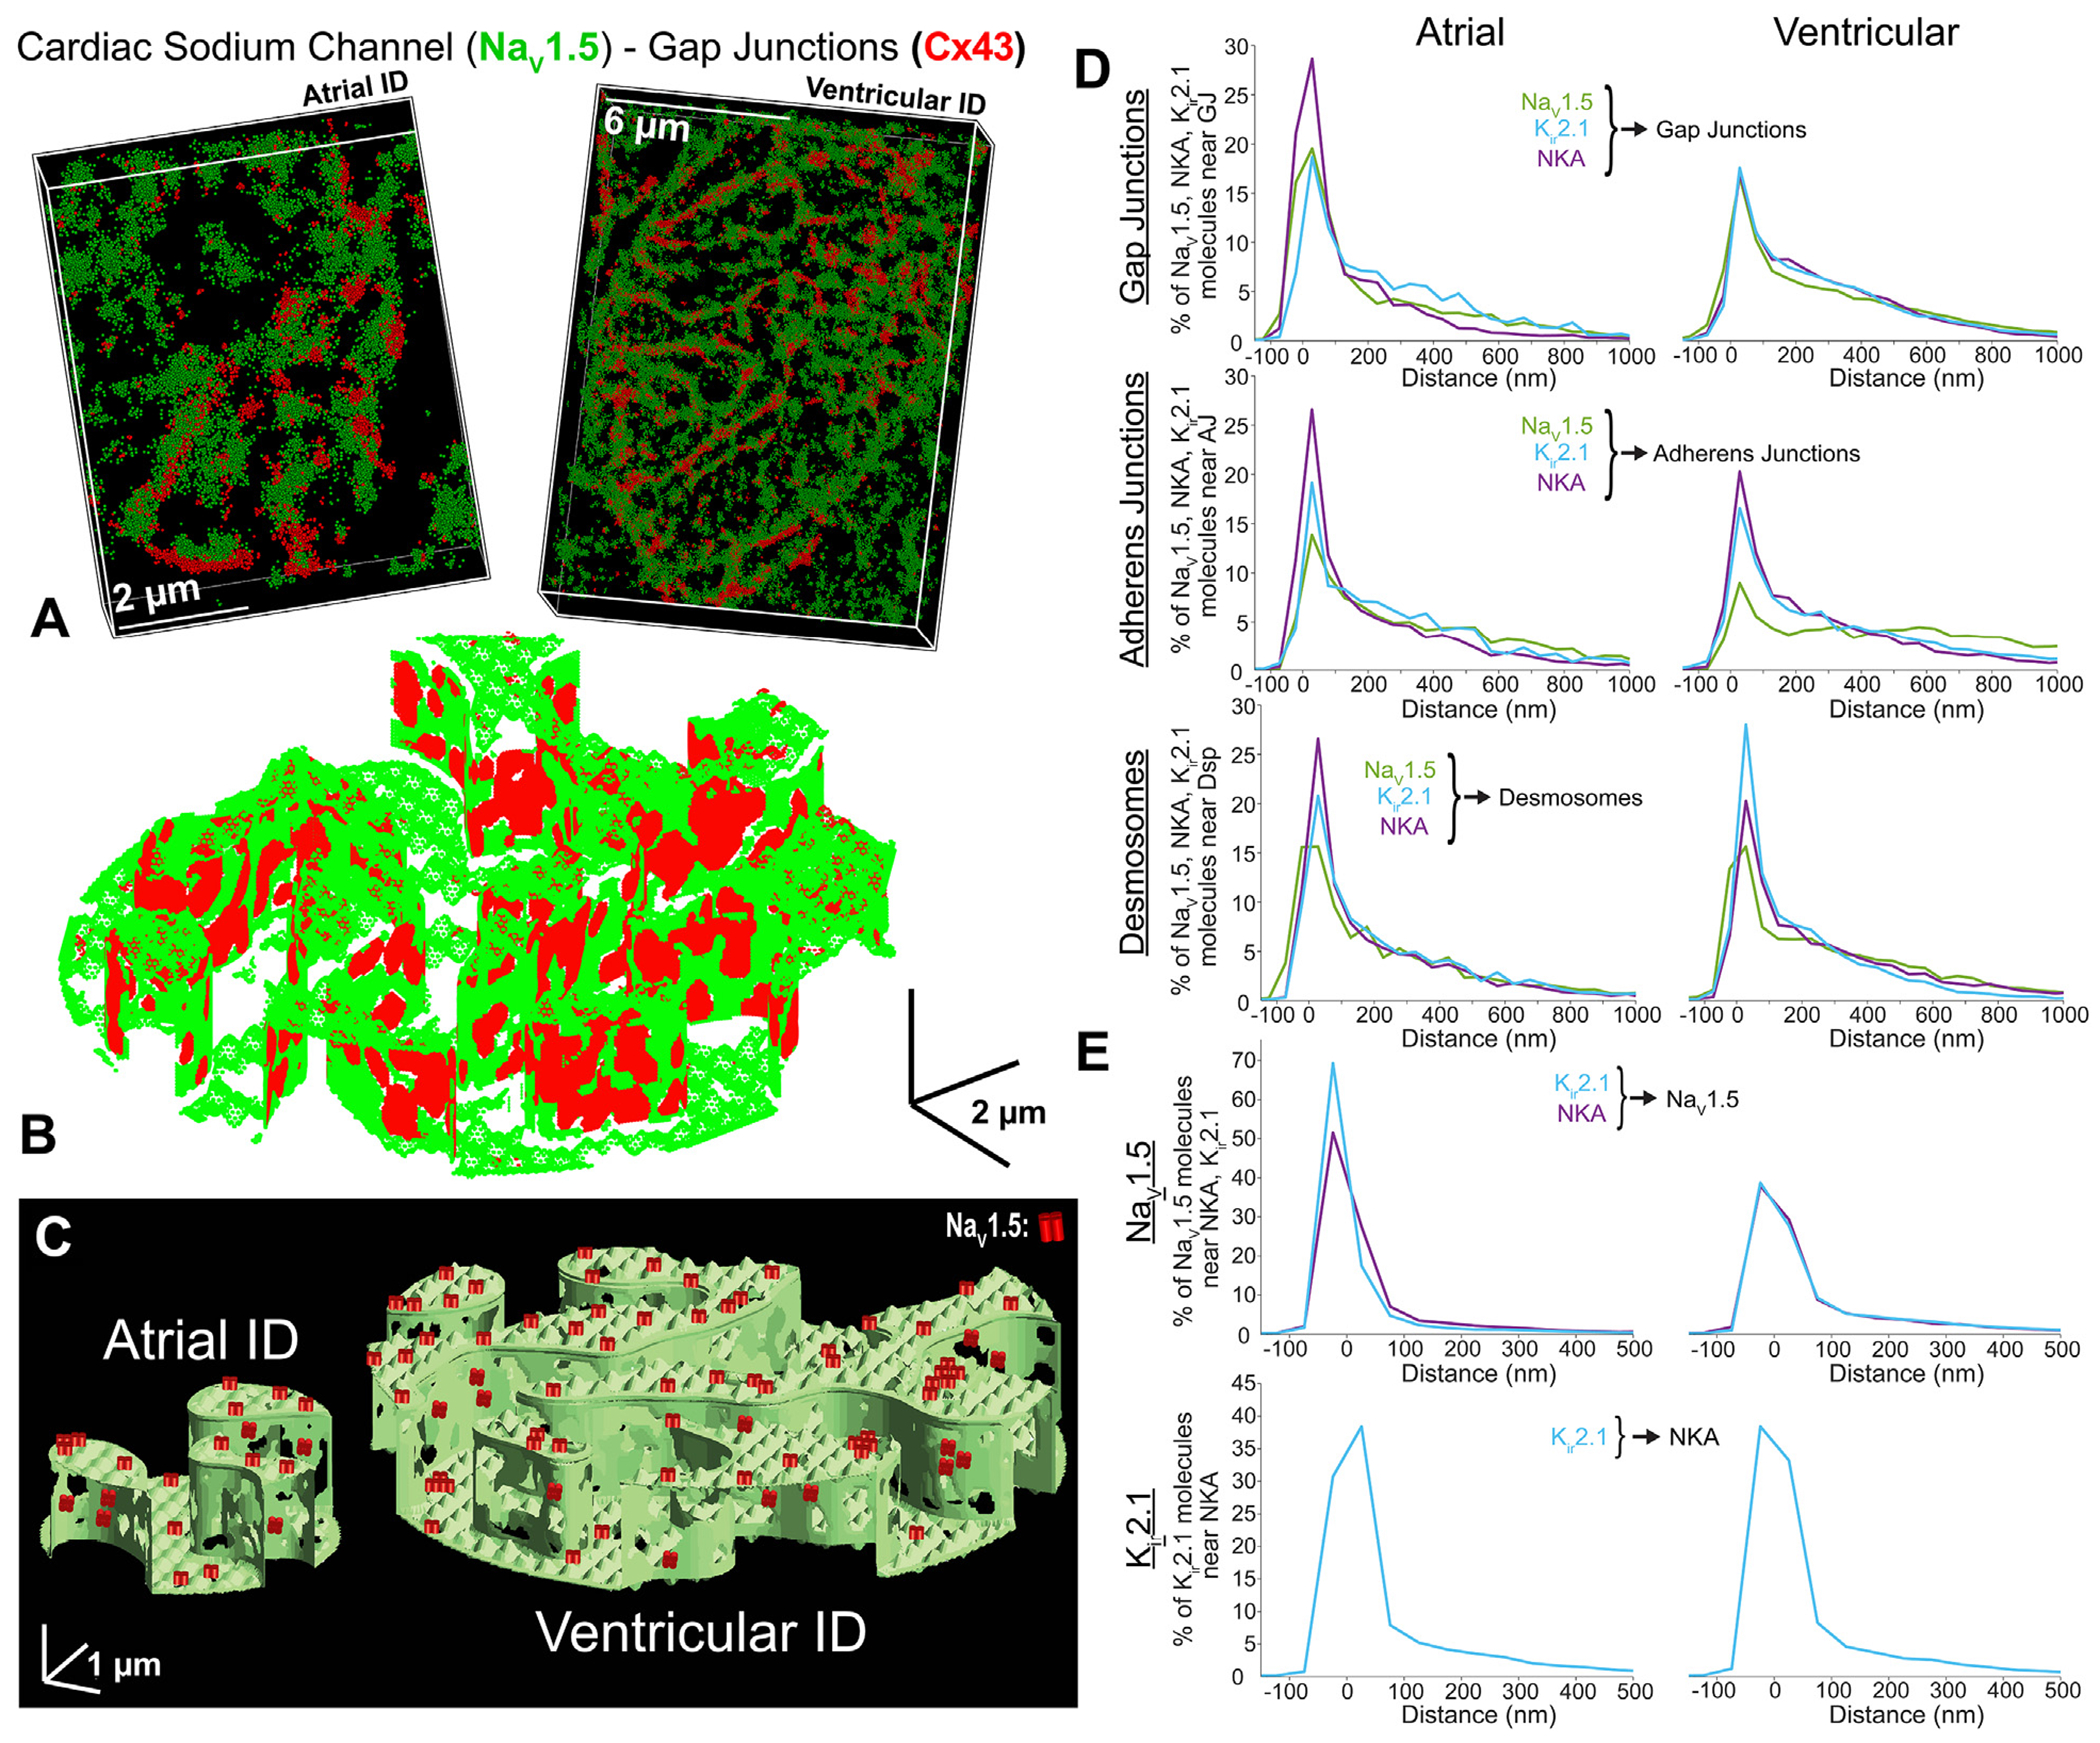
Methods: Using super-resolution light microscopy, electron microscopy, and computational image analysis, we provide here the first ever systematic, multiscale quantification of intercalated disc ultrastructure and molecular organization.

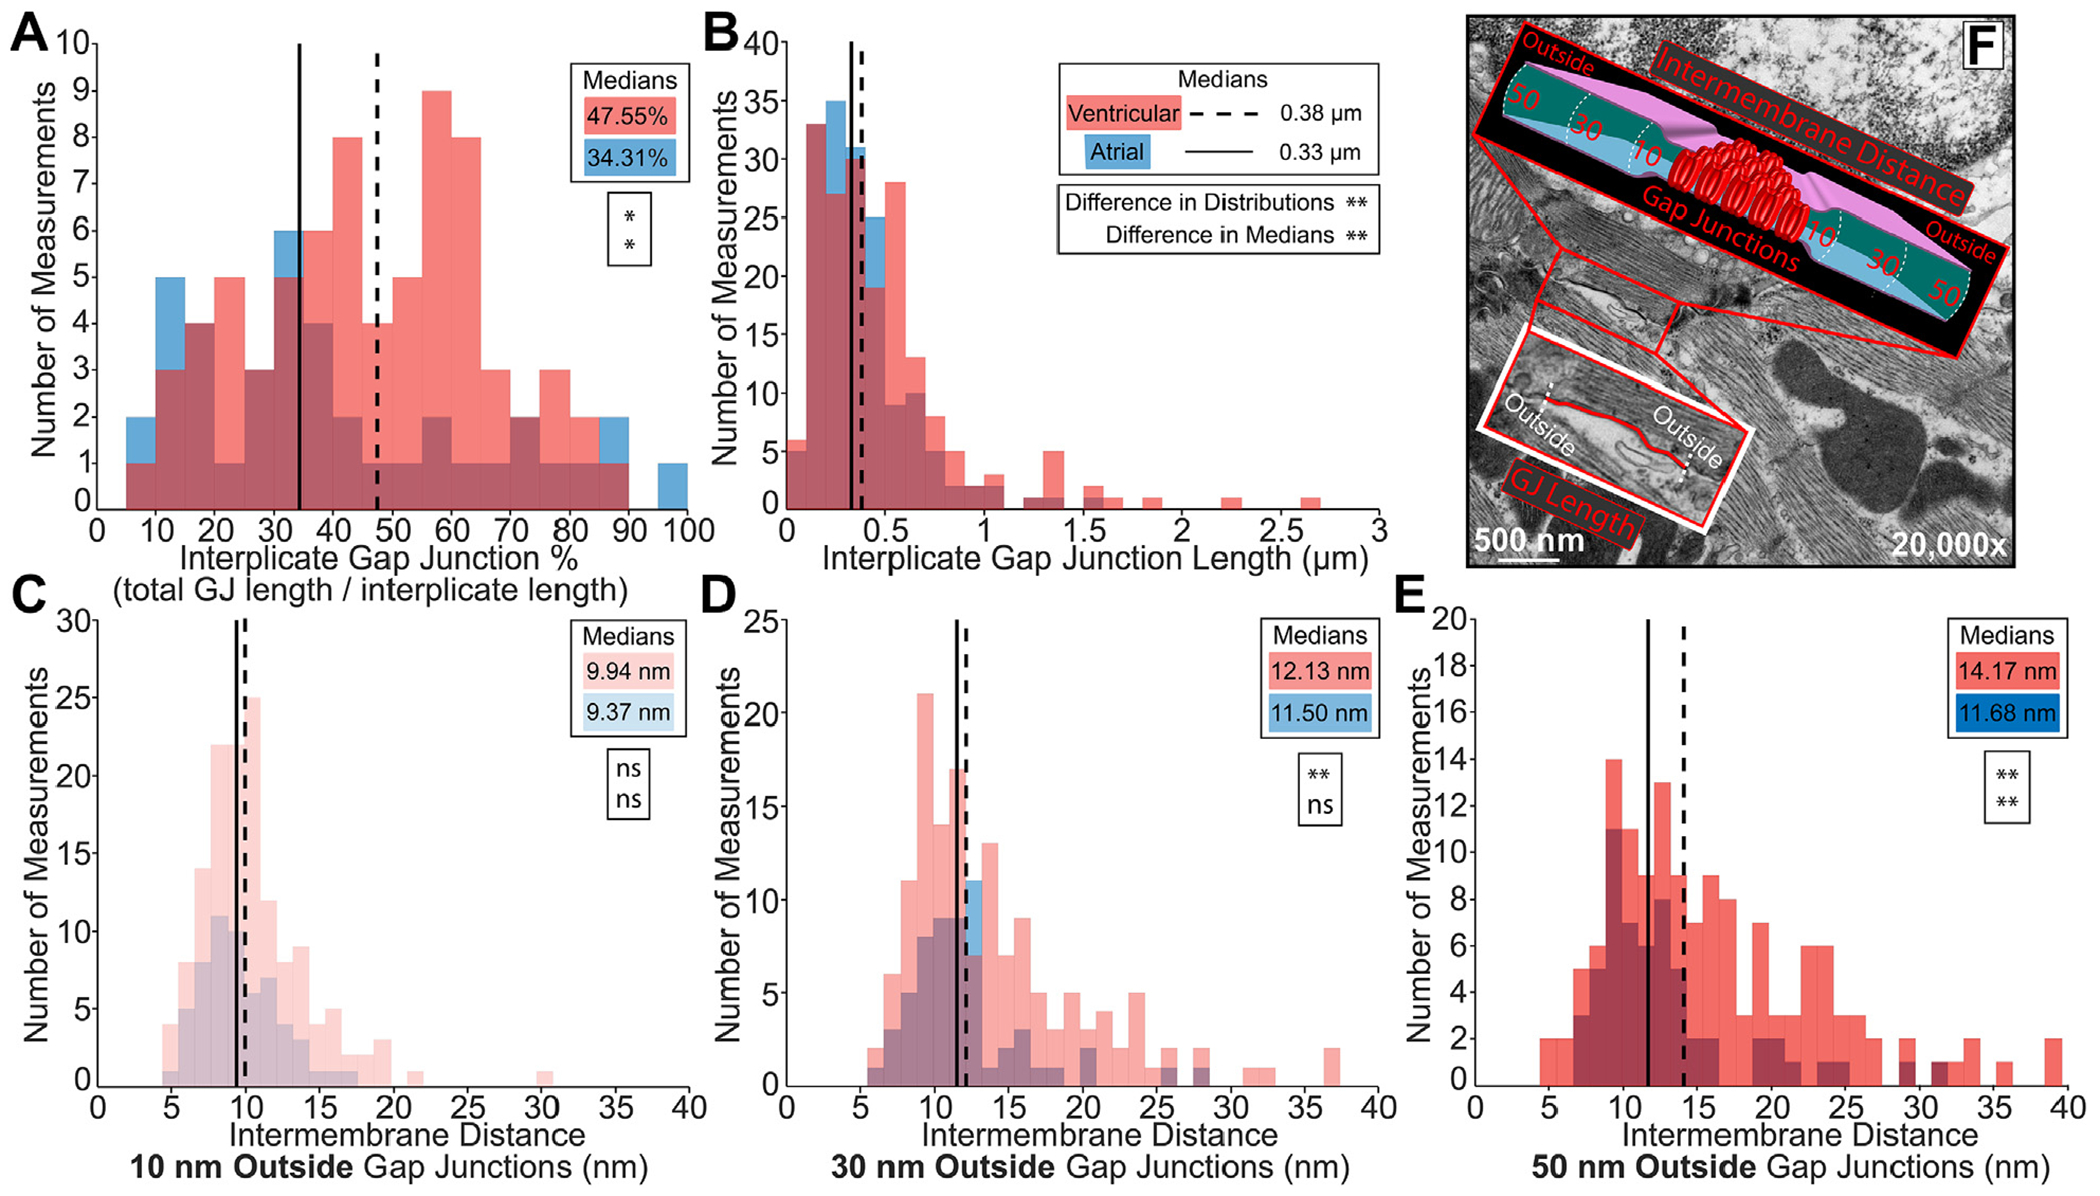
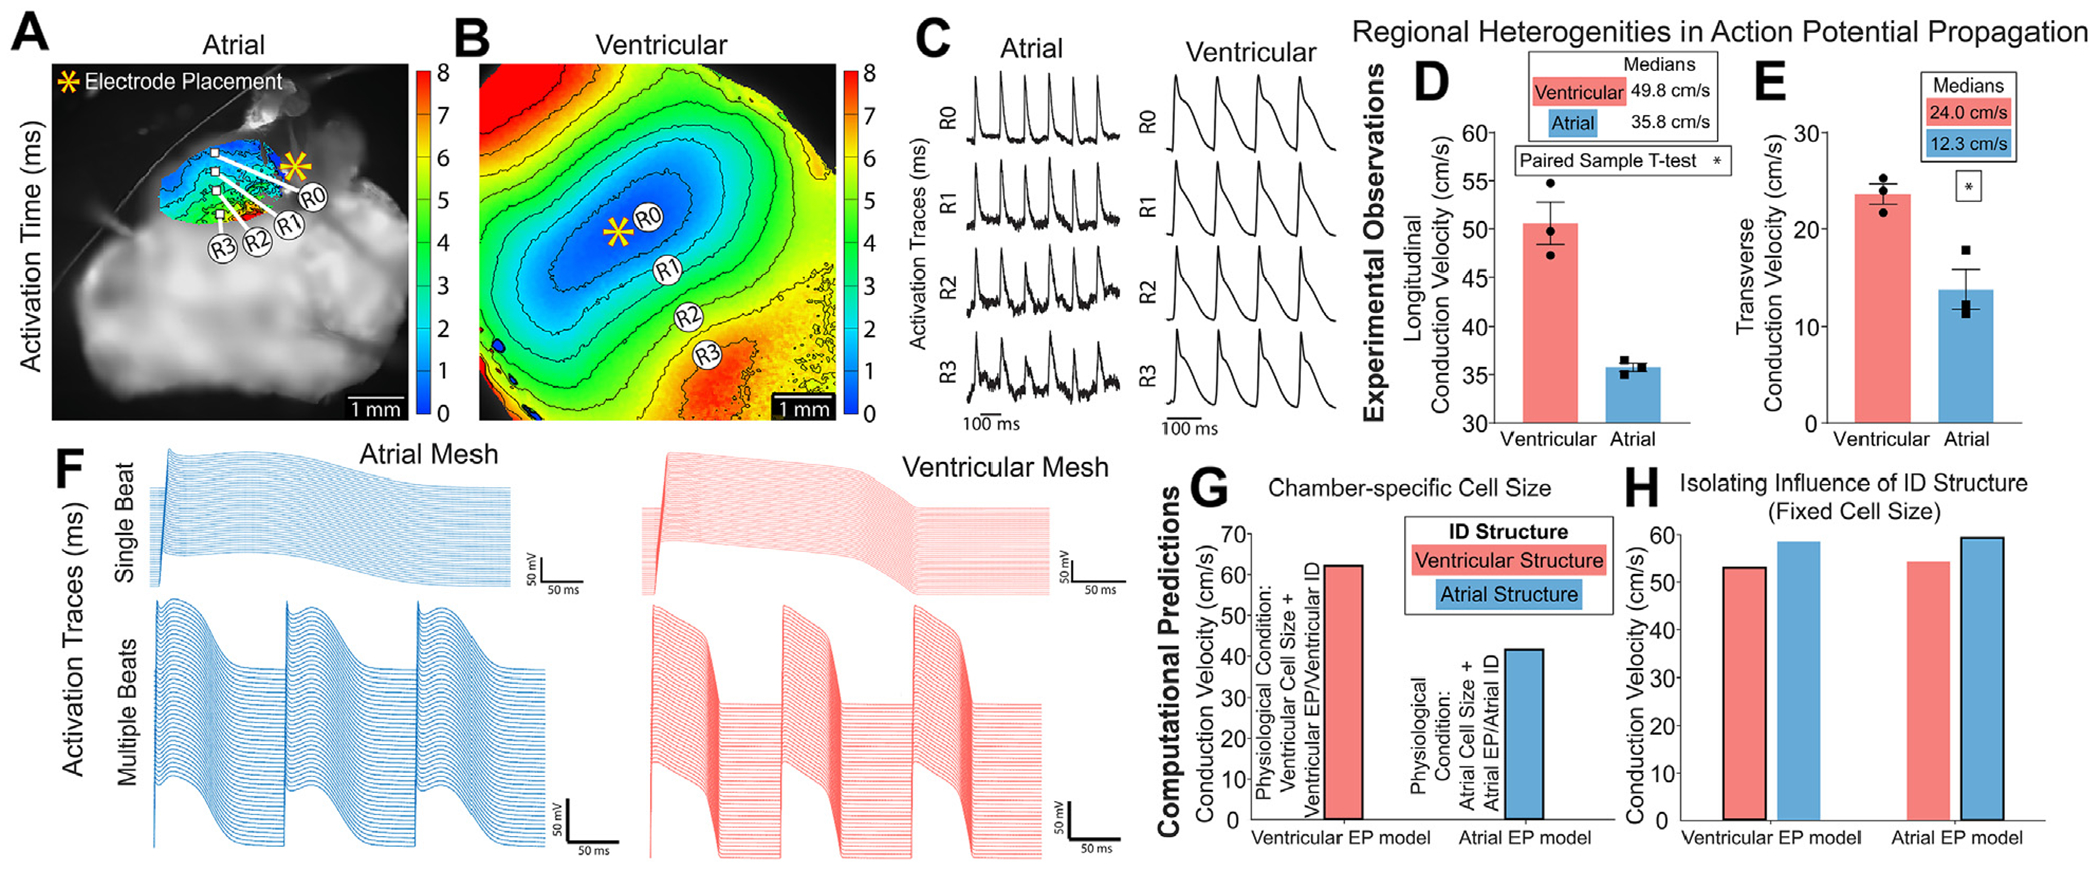
Results: By incorporating these data into a rule-based model of cardiac tissue with realistic intercalated disc structure, and comparing model predictions of electrical propagation with experimental measures of conduction velocity, we reveal that atrial intercalated discs can support faster conduction than their ventricular counterparts, which is normally masked by interchamber differences in myocyte geometry. Further, we identify key ultrastructural and molecular organization features underpinning the ability of atrial intercalated discs to support faster conduction.

Conclusions: These data provide the first stepping stone to elucidating chamber-specific effects of pathological intercalated disc remodeling, as occurs in many arrhythmic diseases.

Keywords: cardiac conduction; gap junctions; intercalated disc; ion channels; microscopy.


Conflict of interest statement

Funding Support and Author Disclosures This work was supported by National Institutes of Health R01 grants (HL148736 awarded to Dr Veeraraghavan, HL138003 awarded to Dr Weinberg, and R01HL155378 and R01 NS121234 awarded to Dr Radwański) as well as an American Heart Association grant (20TPA35460040) awarded to Dr Veeraraghavan, an American Heart Association Predoctoral Fellowship awarded to Dr Struckman, an American Heart Association Postdoctoral Fellowship awarded to Dr Moise, and a National Institutes of Health T32 (HL149637-02) and L40 (NS129034) awarded to Dr King. All other authors have reported that they have no relationships relevant to the contents of this paper to disclose.

Figures

FIGURE 1
FIGURE 1. Cardiomyocyte and ID Dimensions
Representative confocal images of atrial and ventricular (A) intercalated discs (IDs) from a whole-heart frontal section (gap junctions [Connexin43 (Cx43); white] and desmosomes [Dsp] [red]) and (B) isolated cardiomyocytes (adherens junctions [N-cadherin (Ncad); orange] and sodium/potassium ATPase [NKA; purple]). Representative thin section (C) transmission electron microscopy images of atrial and ventricular IDs. ID size was quantified by (D) length (left; n= 54 [atrial], 58 [ventricular] measurements from 3 hearts) and volume (middle; n = 151 [atrial], 150 [ventricular] measurements from 4 hearts). Cardiomyocyte size was quantified by (D) volume (right; n = 151 [atrial], 150 [ventricular] measurements from 4 hearts). Distributions are represented in red for ventricular and blue for atrial intercalated discs. Medians are represented as dashed lines for ventricular and solid lines for atrial results. Differences in distributions and medians were statistically tested by 2-sample Kolmogorov-Smirnov test and Wilcoxon signed rank test, respectively (NS = P > 0.05; *P ≤ 0.05; **P ≤ 0.01; ***P ≤ 0.001; ****P ≤ 0.0001).
FIGURE 2
FIGURE 2. Intercalated Disc Nanodomain Structures in the Interplicate Subdomain
Representative transmission electron microscopy images annotated to show intercalated disc nanodomain structural measurements in the interplicate regions: (F) gap junction (GJ) length (red trace), and intermembrane distance outside (10, 30, 50 nm) GJs (cartoon). Interplicate gap junctions were characterized by A) percentage relative to the interplicate region (n= 40 [atrial], 72 [ventricular] measurements), (B) length (n = 162 [atrial], 186 [ventricular] measurements), and (C-E) intermembrane distance outside (10, 30, 50 nm) GJs (10 nm outside n = 58 [atrial], 142 [ventricular]; 30 nm outside n = 58 [atrial], 143 [ventricular]; and 50 nm outside n = 58 [atrial], 140 [ventricular] measurements). Performed on 3 hearts. Distributions were represented in red for ventricular and blue for atrial measurements. Medians were represented as dashed line for ventricular and solid line for atrial. Differences in distributions and medians were statistically proven with two-sample Kolmogorov-Smirnov test and Wilcoxon signed-rank test, respectively (NS = P > 0.05; *P ≤ 0.05; **P ≤ 0.01; ***P ≤ 0.001; ****P ≤ 0.0001).
FIGURE 3
FIGURE 3. Integration of ID Ultrastructure Into Rule-Based Finite Element Model
Representative finite element meshes of atrial and ventricular intercalated discs (IDs): (A) side view and (B) top view. Overlay of multiscale ID measurements used for mesh generation: (0) cardiomyocyte volume, (1) ID size (blue), (2) plicate length (red), (3) plicate MJ%, (4) plicate folding (amplitude, yellow), (5) mechanical junction (MJ) length (green), (6) MJ intermembrane spacing (teal), (7) interplicate length (pink), (8) interplicate gap junction (GJ)%, (9) GJ length (orange), (10) GJ intermembrane spacing (teal). Ultrastructural measurements are annotated in TEM images and summarized as comparison of medians for (C) whole cell, (D) plicate, and (E) interplicate measurements.
FIGURE 4
FIGURE 4. NaV1.5, Kir2.1, NKA Channel Distribution Relative to Junctional Proteins
Representative stochastic optical reconstruction microscopy images of atrial and ventricular ID labeled for protein components of cardiac isoform of the voltage-gated sodium channel (NaV1.5) (green), inward-rectifier potassium channel 2.1 (Kir2.1) (white), NKA (purple), gap junctions (Cx43; red), adherens junctions (Ncad; orange), and Dsp (yellow). (A) Cardiac isoform of the voltage-gated sodium channel + gap junctions, (B) cardiac isoform of the voltage-gated sodium channel + adherens junctions, (C) cardiac isoform of the voltage-gated sodium channel + desmosomes, (D) inward-rectifier potassium channel 2.1 + gap junctions, (E) inward-rectifier potassium channel 2.1 + adherens junctions, (F) inward-rectifier potassium channel 2.1 + desmosomes, (G) sodium potassium ATPase + gap junctions, (H) sodium potassium ATPase + adherens junctions, (I) sodium potassium ATPase + desmosomes. Images were presented as whole IDs. Cumulative distributions of electrogenic proteins (NaV1.5 [green], Kir2.1 [light blue], and NKA [purple]) relative to intercalated disc junctions: (J) gap junctions, (K) adherens junctions, and (L) desmosomes. Summary plots show molecule-wise cumulative distributions (n = 5 [atrial], 5 [ventricular] images/heart from 3 hearts). Abbreviations as in Figure 1.
FIGURE 5
FIGURE 5. Distribution of Electrogenic Proteins Relative to Each Other
Representative stochastic optical reconstruction microscopy images of atrial and ventricular intercalated disc labeled for protein components of cardiac isoform of the voltage-gated sodium channel (NaV1.5) (green), inward-rectifier potassium channel (Kir2.1; white), and sodium potassium ATPase (NKA; purple). (A) cardiac isoform of the voltage-gated sodium channel + sodium potassium ATPase, (B) cardiac isoform of the voltage-gated sodium channel + inward-rectifier potassium channel, and (C) sodium potassium ATPase + inward-rectifier potassium channel. Cumulative distributions of electrogenic proteins (Kir2.1 [light blue], and NKA [purple]) relative to each other: (D) NaV1.5 relative to Kir2.1 and NKA, (E) Kir2.1 relative to NKA. Summary plots show molecule-wise cumulative distributions (n = 5 [atrial], 5 [ventricular] images/heart from 3 hearts).
FIGURE 6
FIGURE 6. Intercalated Disc Nanodomain Structures in the Plicate Subdomain
Representative transmission electron microscopy images annotated with intercalated disc nanodomain structural measurements within plicate regions: (H) membrane fold frequency (yellow trace), amplitude (teal trace), mechanical junction (MJ) length (orange trace), (I) intermembrane distance inside and outside (10, 30 nm) MJs (orange fill, cartoon). Plicate fold periodicity was characterized by (A) frequency (n= 72 [atrial], 110 [ventricular] measurements), and (B) amplitude (n= 79 [atrial], 128 [ventricular] measurements). Plicate mechanical junctions were characterized by (C) percentage relative to the plicate region (n = 57 [atrial], 52 [ventricular] measurements), D) length (n = 282 [atrial], 329 [ventricular] measurements), and (E-G) intermembrane distance inside and outside (10, 30 nm) MJs (inside n= 178 [atrial], 323 [ventricular]; 10 nm outside n= 178 [atrial], 241 [ventricular]; and 30 nm outside n= 178 [atrial], 240 [ventricular] measurements). Performed on 3 hearts. Distributions are represented in red for ventricular and blue for atrial measurements. Medians are represented as dashed lines for ventricular and solid lines for atrial measurements. Differences in distributions and medians were statistically proven with 2-sample Kolmogorov-Smirnov test and Wilcoxon signed rank test, respectively (NS = P > 0.05; *P ≤ 0.05; **P ≤ 0.01; ***P ≤ 0.001; ****P ≤ 0.0001).
FIGURE 7
FIGURE 7. Integration of ID Protein Organization Into Rule-Based Finite Element Model
Pipeline for integrating protein organization: (A) stochastic optical reconstruction microscopy-based assessment of electrogenic protein distribution relative to junctional landmarks, (B) in silico mapping of electrogenic protein placement relative to landmarks previously established in ultrastructural meshes via transmission electron microscopy, (C) cartoon of electrogenic protein integration into atrial (left) and ventricular (right) ultrastructural meshes. Summary plots of distribution of electrogenic proteins (NaV1.5 [green], Kir2.1 [light blue], and NKA [purple]) (D) relative to intercalated disc junctions (gap junctions, adherens junctions, and desmosomes) and (E) relative to each other. Summary plots show molecule-wise probability distribution functions. Abbreviations as in Figure 5.
FIGURE 8
FIGURE 8. Functional Implications of Intercalated Disc Structural Heterogeneities
Representative isochrone maps of activation from optical mapping of (A) atrial and (B) ventricular myocardium with (C) action potential duration traces matched to sites overlaid on the image. Propagation across the tissue was captured as (D) longitudinal conduction velocity and (E) transverse conduction velocity (from 3 hearts; *P ≤ 0.5, paired-sample t-test). Functional effects of incorporating atrial and ventricular cellular and intercalated disc (ID) structure into the rule-based finite element model (F-H). Computational model generated (F) action potential traces and longitudinal conduction velocity with (G) chamber-specific cell size and (H) uniform cell length of 100 μm. Outlined bars represent chamber-specific structures integrated with corresponding EP models (ie, atrial structure with atrial EP model).
CENTRAL ILLUSTRATION
CENTRAL ILLUSTRATION. Multiscale Experimental and Modeling Studies Elucidate Cardiac Conduction Dependence on Intercalated Disc Structure
(Top) ConfocaL image of a frontal section of a mouse heart illustrating chamber-specific differences in intercalated disc (ID) size and structure. Inset: Electron micrograph and cartoons highlighting juxta-junctional nanodomains within the ID, which play key roles in action potential propagation. (Middle) Incorporation of electron microscopy-derived ultrastructural measurements and super-resolution microscopy-derived measurements of molecular organization into finite element models of atrial and ventricular IDs. (Bottom) Incorporation of finite element models of IDs into functional physiological models reveals that, once cell size differences are accounted for, atrial IDs support faster conduction. Cx43 = connexin43; Kir2.1 = inward-rectifying potassium channel; NaV1.5 = cardiac isoform of the voltage-gated sodium channel; NKA = sodium/potassium ATPase.

Update of

Similar articles

Cited by

References

    1. Veeraraghavan R, Gourdie RG, Poelzing S. Mechanisms of cardiac conduction: a history of revisions. Am J Physiol Heart Circ Physiol. 2014;306:H619–H627. - PMC - PubMed
    1. Kleber AG, Rudy Y. Basic mechanisms of cardiac impulse propagation and associated arrhythmias. Physiol Rev. 2004;84:431–488. - PubMed
    1. Nowak MB, Veeraraghavan R, Poelzing S, Weinberg SH. Cellular size, gap junctions, and sodium channel properties govern developmental changes in cardiac conduction. Front Physiol. 2021;12:731025. - PMC - PubMed
    1. Veeraraghavan R, Hoeker GS, ALvarez-Laviada A, et al. The adhesion function of the sodium channel beta subunit (beta1) contributes to cardiac action potential propagation. Elife. 2018;7:e37610. 10.7554/eLife.37610 - DOI - PMC - PubMed
    1. Hichri E, Abriel H, Kucera JP. Distribution of cardiac sodium channels in clusters potentiates ephaptic interactions in the intercalated disc. J Physiol. 2018;596:563–589. - PMC - PubMed

Publication types

LinkOut - more resources