. 2023 Jul 26;15(14):7187-7218.
doi: 10.18632/aging.204901. Epub 2023 Jul 26.

Identification of TGF-β-related genes in cardiac hypertrophy and heart failure based on single cell RNA sequencing

Affiliations

Identification of TGF-β-related genes in cardiac hypertrophy and heart failure based on single cell RNA sequencing

Kai Huang et al. Aging (Albany NY). .

Abstract

Background: Heart failure (HF) remains a huge medical burden worldwide. Pathological cardiac hypertrophy is one of the most significant phenotypes of HF. Several studies have reported that the TGF-β pathway plays a double-sided role in HF. Therefore, TGF-β-related genes (TRGs) may be potential therapeutic targets for cardiac hypertrophy and HF. However, the roles of TRGs in HF at the single-cell level remain unclear.

Method: In this study, to analyze the expression pattern of TRGs during the progress of cardiac hypertrophy and HF, we used three public single-cell RNA sequencing datasets for HF (GSE161470, GSE145154, and GSE161153), one HF transcriptome data (GSE57338), and one hypertrophic cardiomyopathy transcriptome data (GSE141910). Weighted gene co-expression network analysis (WGCNA), functional enrichment analysis and machine learning algorithms were used to filter hub genes. Transverse aortic constriction mice model, CCK-8, wound healing assay, quantitative real-time PCR and western blotting were used to validate bioinformatics results.

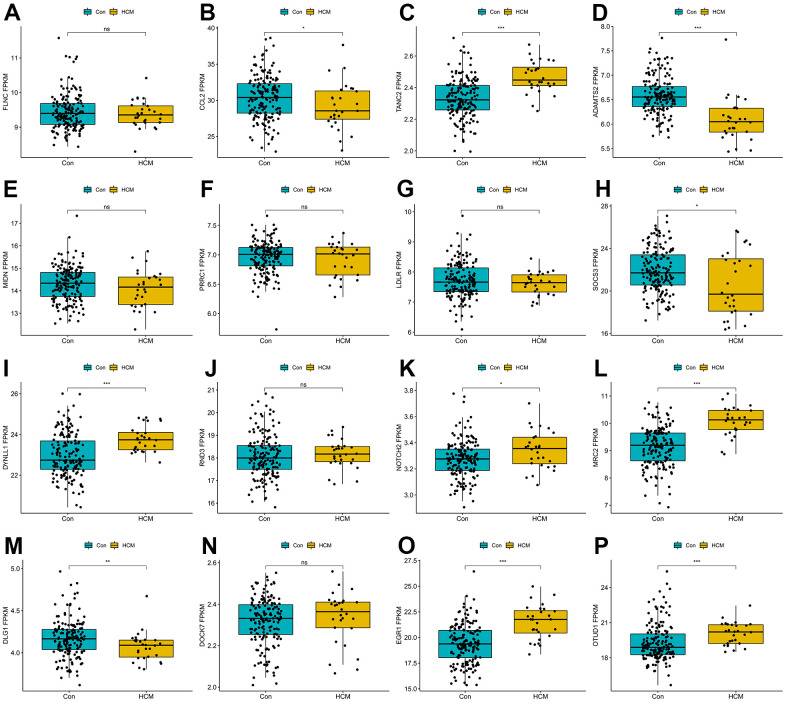
Results: We observed that cardiac fibroblasts (CFs) and endothelial cells showed high TGF-β activity during the progress of HF. Three modules (royalblue, brown4, and darkturquoize) were identified to be significantly associated with TRGs in HF. Six hub genes (TANC2, ADAMTS2, DYNLL1, MRC2, EGR1, and OTUD1) showed anomaly trend in cardiac hypertrophy. We further validated the regulation of the TGF-β-MYC-ADAMTS2 axis on CFs activation in vitro.

Conclusions: This study identified six hub genes (TANC2, ADAMTS2, DYNLL1, MRC2, EGR1, and OTUD1) by integrating scRNA and transcriptome data. These six hub genes might be therapeutic targets for cardiac hypertrophy and HF.

Keywords: ADAMTS2; TGF-β; cardiac hypertrophy; heart failure; single-cell RNA sequencing.


Conflict of interest statement

CONFLICTS OF INTEREST: The authors declare that they have no conflicts of interest.

Figures

Figure 1
Figure 1
Flow chart of the analysis. DEGs, differentially expressed genes; GO, gene ontology annotation; KEGG, Kyoto Encyclopedia of Genes and Genomes; ssGSEA, single-sample gene Set enrichment analysis; WGCNA, weighted gene co-expression network analysis; LASSO, least absolute shrinkage and selection operator; SVM-RFE, support vector machine-recursive feature elimination; TANC2, tetratricopeptide repeat, ankyrin repeat, and coiled-coil containing 2; ADAMTS2, ADAM metallopeptidase with thrombospondin type 1 motif 2; DYNLL1, dynein light chain LC8-type 1; MRC2, mannose receptor C type 2; EGR1, early growth response 1; OTUD1, OTU deubiquitinase 1.
Figure 2
Figure 2
Single-cell RNA sequencing shows the heterogeneity of the heart tissue. (A) Pipeline of single-cell RNA sequencing data processing. (B) t-SNE plot representing the 15 clusters across 39,995 cells from four controls and four heart failure samples. (C) Violin plots showing the expression of marker genes for the 15 cell clusters. (D) Dot plot showing the expression of the top five DEGs in each cell type. (E) t-SNE plot representing the 10 cell clusters after annotation. B, B cells; CM, cardiac muscle cells; EC, endothelial cells; EndoC, endocardial endothelial cells; FB, fibroblasts; myeloid, myeloid cells; neuronal, neurogenic cells; NK, natural killer cells; T, T cells. (F) Bar plot showing the proportion of cell types in each sample.
Figure 3
Figure 3
TGF-β score heart failure cell clusters. (A) t-SNE plot showing the high and low TGF-β activity in the control and heart failure samples. (B) TGF-β score for each cell cluster. (C) Heatmap showing the TGF-β activity. (D, E) GO and KEGG enrichment analyses of DEGs for CFs. (F, G) GO and KEGG enrichment analyses of DEGs for ECs.
Figure 4
Figure 4
Transcriptome data analysis for heart failure. (A) Volcano plot of DEGs for no failure and heart failure samples. (B) Heatmap of DEGs for no failure and heart failure samples. (C, D) GO and KEGG enrichment analyses of DEGs for no failure and heart failure samples.
Figure 5
Figure 5
ssGSEA and WGCNA results. (A) Circular heatmap showing the TGF-β scores of 313 samples calculated using ssGSEA. (B) Analysis of the network topology for various soft-thresholding powers. (C) Clustering dendrogram of genes. (D) Heatmap showing the correlation between modules and TGF-β scores. (EG) Three gene modules selected for further analysis.
Figure 6
Figure 6
Enrichment analysis for the three gene modules (royalblue, brown4, and darkturquoize) using Metascape and machine learning. (A, B) The network and bar plot of enriched terms for genes in the three gene modules. (C) The enriched diseases for genes in the three gene modules using the DisGeNET database. (D, E) A total of 44 genes identified using the LASSO regression. (F) A total of 25 genes were identified using the SVM-RFE algorithm. (G) A total of 20 genes were identified using random forest.
Figure 7
Figure 7
Boxplots of the sixteen genes in hypertrophic cardiomyopathy dataset (GSE141910). (A) FLNC; (B) CCL2; (C) TANC2; (D) ADAMTS2; (E) MIDN; (F) PRRC1; (G) LDLR; (H) SOCS3; (I) DYNLL1; (J) RND3; (K) NOTCH2; (L) MRC2; (M) DLG1; (N) DOCK7; (O) EGR1; (P) OTUD1. ns P > 0.05, * P < 0.05, ** P < 0.01, *** P < 0.001.
Figure 8
Figure 8
Six hub genes and corresponding transcriptional factors. (A) t-SNE plot showing the expression characteristic of the six hub genes in the control and heart failure samples. (B) Heatmap showing the expression of six hub genes in each cell type. (C) Relative mRNA expression of the six hub genes in the 2w TAC model. * P < 0.05. (D) Heatmap showing the expression of differentially expressed transcriptional factors in each cell type. (E) Transcriptional factor and hub gene regulatory network. (F) Correlation diagram between MYC and ADAMTS2.
Figure 9
Figure 9
Upregulation of ADAMTS2 alleviates the effect of TGF-β1 on cardiac fibroblasts. (A) The mRNA expression of Adamts2 in CFs and NRCMs was determined by RT-qPCR. * P < 0.05. (B) The protein expression of Adamts2 in CFs and NRCMs was determined western blot. * P < 0.05. (C) The mRNA expression of Adamts2 in TGF-β1 treated CFs at different time points. * P < 0.05 vs. the 0h group. (D) The protein expression of Adamts2 in TGF-β1 treated CFs at different time points. * P < 0.05 vs. the 0h group. (E) The overexpression of Adamts2 in CFs was determined by western blot. (F) The migration ability of CFs was showed by wound healing assay. (G) The relative migration distance of Adamts2 overexpressed CFs. (H) The cell viability was calculated by CCK-8. * P < 0.05 vs. the Control group. # P < 0.05 vs. the TGF-β group. (I) The expression of α-SMA and Col1 were determined by western blot. * P < 0.05 vs. the Control group. # P < 0.05 vs. the TGF-β group. (J) The downregulation of Adamts2 in CFs was determined by western blot. (K) The migration ability of CFs was showed by wound healing assay. (L) The relative migration distance of Adamts2 downregulated CFs. (M) The cell viability was calculated by CCK-8. * P < 0.05 vs. the Control group. # P < 0.05 vs. the TGF-β group. (N) The expression of α-SMA and Col1 were determined by western blot. * P < 0.05 vs. the Control group. # P < 0.05 vs. the TGF-β group.
Figure 10
Figure 10
MYC transcriptionally regulates ADAMTS2. (A) Three predicted binding sites of the MYC protein in the ADAMTS2 promoter region are shown. (B) Boxplot showing the expression of MYC mRNA in GSE141910. * P < 0.05. (C, D) Co-transfection of the mutant ADAMTS2 promoter recombinant vector and the MYC expression vector in 293 cells is verified using dual luciferase reporter gene assays. * P < 0.05 versus the oe-NC group. (E) Binding of MYC to the ADAMTS2 promoters is tested using ChIP assays. * P < 0.05 versus the IgG antibody group.
Figure 11
Figure 11
The regulatory effect of TGF-β-MYC-ADAMTS2 axis on CFs. (A) The migration ability of CFs was showed by wound healing assay. (B) The relative migration distance of CFs. * P < 0.05 vs. the Control group. # P < 0.05 vs. the TGF-β1+oe-NC+si-Adamts2 group. (C) The cell viability was calculated by CCK-8. * P < 0.05 vs. the Control group. # P < 0.05 vs. the TGF-β1+oe-NC+si-Adamts2 group. (D) The expression of α-SMA and Col1 was determined by western blot. (E) The relative protein expression of α-SMA and Col. * P < 0.05 vs. the Control group. # P < 0.05 vs. the TGF-β1+oe-NC+si-Adamts2 group. (F) The migration ability of CFs was showed by wound healing assay. (G) The relative migration distance of CFs. * P < 0.05 vs. the Control group. # P < 0.05 vs. the TGF-β1+si-NC+oe-Adamts2 group. (H) The cell viability was calculated by CCK-8. * P < 0.05 vs. the Control group. # P < 0.05 vs. the TGF-β1+si-NC+oe-Adamts2 group. (I) The expression of α-SMA and Col1 was determined by western blot. * P < 0.05 vs. the Control group. # P < 0.05 vs. the TGF-β1+si-NC+oe-Adamts2 group. (J) The relative protein expression of α-SMA and Col. * P < 0.05 vs. the Control group. # P < 0.05 vs. the TGF-β1+si-NC+oe-Adamts2 group. (K) The ridgeplot for the GESA results of ADAMTS2. (L) The PI3K-Akt signaling pathway for ADAMTS2. (M) The MAPK signaling pathway for ADAMTS2.

Similar articles

Cited by

References

    1. Kamel R, Leroy J, Vandecasteele G, Fischmeister R. Cyclic nucleotide phosphodiesterases as therapeutic targets in cardiac hypertrophy and heart failure. Nat Rev Cardiol. 2023; 20:90–108. 10.1038/s41569-022-00756-z - DOI - PubMed
    1. Yuan L, Bu S, Du M, Wang Y, Ju C, Huang D, Xu W, Tan X, Liang M, Deng S, Yang L, Huang K. RNF207 exacerbates pathological cardiac hypertrophy via post-translational modification of TAB1. Cardiovasc Res. 2023; 119:183–94. 10.1093/cvr/cvac039 - DOI - PubMed
    1. Wang L, Yu P, Zhou B, Song J, Li Z, Zhang M, Guo G, Wang Y, Chen X, Han L, Hu S. Single-cell reconstruction of the adult human heart during heart failure and recovery reveals the cellular landscape underlying cardiac function. Nat Cell Biol. 2020; 22:108–19. 10.1038/s41556-019-0446-7 - DOI - PubMed
    1. Ruiz-Villalba A, Romero JP, Hernández SC, Vilas-Zornoza A, Fortelny N, Castro-Labrador L, San Martin-Uriz P, Lorenzo-Vivas E, García-Olloqui P, Palacio M, Gavira JJ, Bastarrika G, Janssens S, et al. Single-Cell RNA Sequencing Analysis Reveals a Crucial Role for CTHRC1 (Collagen Triple Helix Repeat Containing 1) Cardiac Fibroblasts After Myocardial Infarction. Circulation. 2020; 142:1831–47. 10.1161/CIRCULATIONAHA.119.044557 - DOI - PMC - PubMed
    1. Ni SH, Xu JD, Sun SN, Li Y, Zhou Z, Li H, Liu X, Deng JP, Huang YS, Chen ZX, Feng WJ, Wang JJ, Xian SX, et al. Single-cell transcriptomic analyses of cardiac immune cells reveal that Rel-driven CD72-positive macrophages induce cardiomyocyte injury. Cardiovasc Res. 2022; 118:1303–20. 10.1093/cvr/cvab193 - DOI - PubMed

Publication types

Substances