

Exploratory analyses on the effect of time since last meal on concentrations of amino acids, lipids, one-carbon metabolites, and vitamins in the Hordaland Health Study
- PMID: 37498368
- PMCID: PMC10468919
- DOI: 10.1007/s00394-023-03211-y
Exploratory analyses on the effect of time since last meal on concentrations of amino acids, lipids, one-carbon metabolites, and vitamins in the Hordaland Health Study
Abstract
Purpose: Dietary intake may have pronounced effects on circulating biomarker concentrations. Therefore, the aim was to provide a descriptive overview of serum metabolite concentrations in relation to time since last meal, focusing on amino acids, lipids, one-carbon metabolites, and biomarkers of vitamin status.
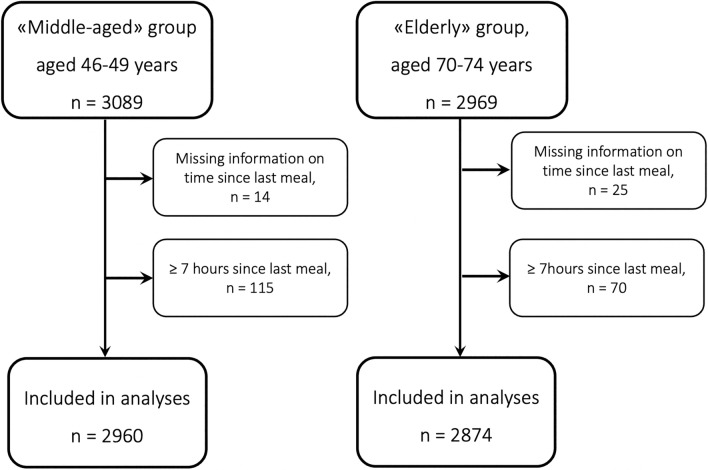
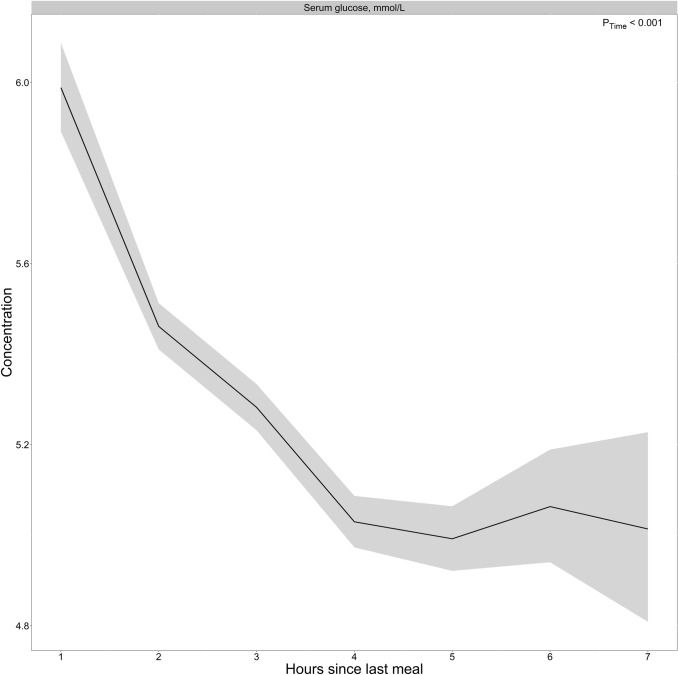
Methods: We used baseline data from the observational community-based Hordaland Health Study, including 2960 participants aged 46-49 years and 2874 participants aged 70-74 years. A single blood draw was taken from each participant, and time since last meal varied. Estimated marginal geometric mean metabolite concentrations were plotted as a function of time since last meal, up to 7 h, adjusted for age, sex, and BMI.
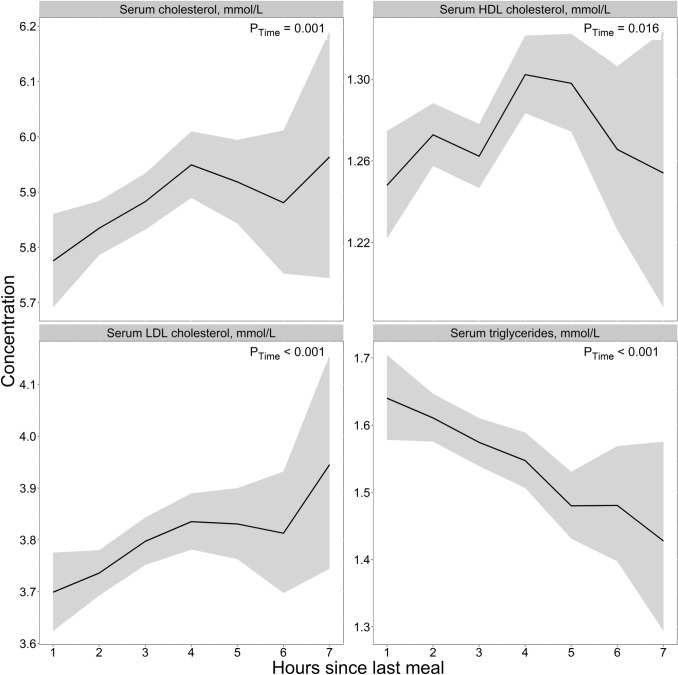
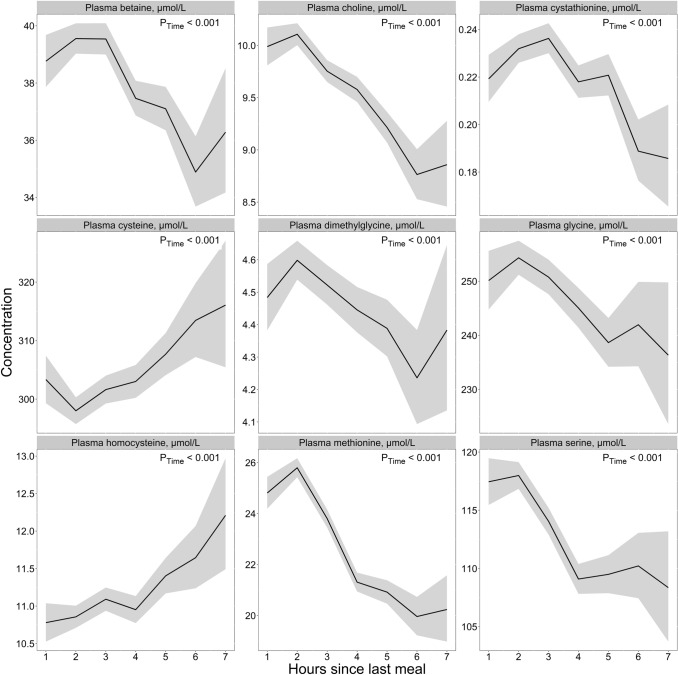
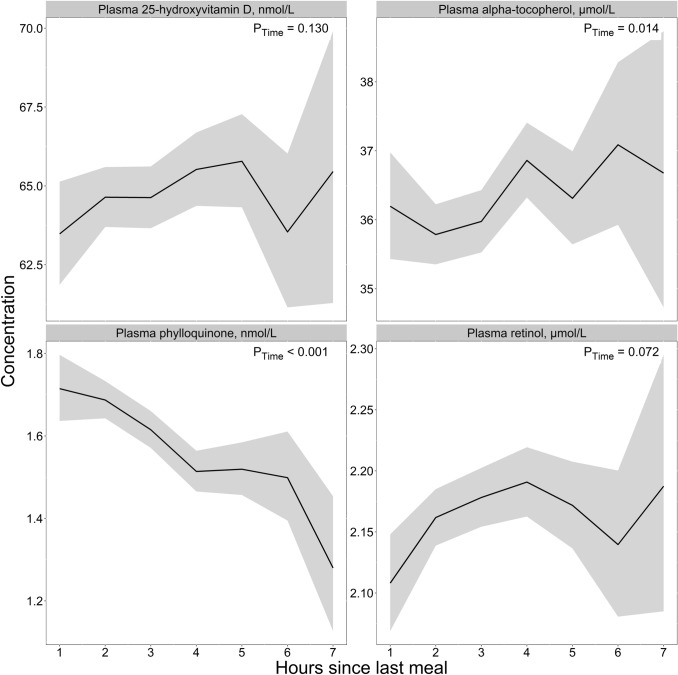
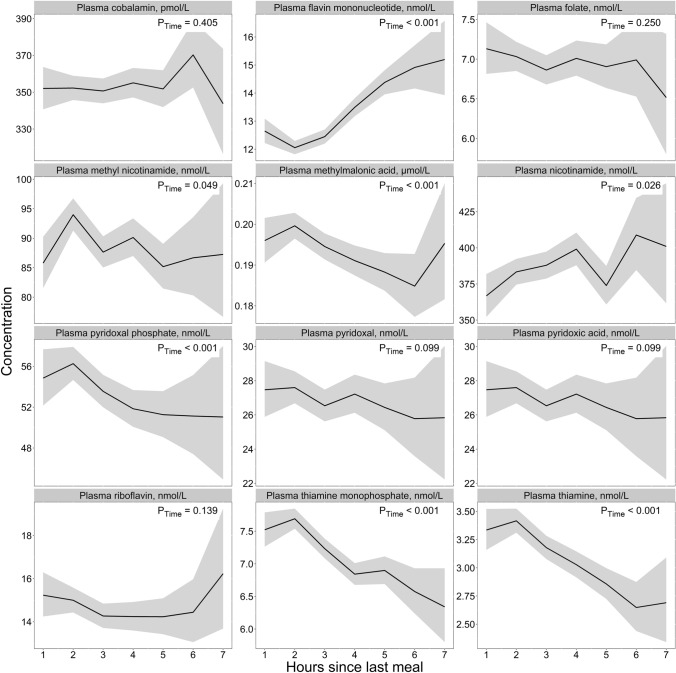
Results: We observed a common pattern for nearly all amino acids and one-carbon metabolites with highest concentrations during the first 3 h after dietary intake. Homocysteine and cysteine were lowest the 1st hour after a meal, while no patterns were observed for glutamate and glutamic acid. The concentrations of phylloquinone and triglycerides were highest 1 h after dietary intake. Thiamine and thiamine monophosphate concentrations were highest, while flavin mononucleotide concentrations were lowest within the first 2 h after a meal. No clear patterns emerged for the other fat-soluble vitamins, blood lipids, or B-vitamin biomarkers.
Conclusion: Our findings suggest that distinguishing between "fasting" and "non-fasting" blood samples may be inadequate, and a more granular approach is warranted. This may have implications for how to account for dietary intake when blood sampling in both clinical and research settings.
Keywords: Biomarkers; Categorization; Epidemiology; Fasting; Metabolites; Postprandial.
© 2023. The Author(s).
Conflict of interest statement
The authors declare that they have no conflict of interests.
Figures

Similar articles
-
Time-resolved concentrations of serum amino acids, one-carbon metabolites and B-vitamin biomarkers during the postprandial and fasting state: the Postprandial Metabolism in Healthy Young Adults (PoMet) Study.Br J Nutr. 2024 Mar 14;131(5):786-800. doi: 10.1017/S0007114523002490. Epub 2023 Oct 27. Br J Nutr. 2024. PMID: 37886826 Free PMC article.
-
Serum concentrations of lipids, ketones and acylcarnitines during the postprandial and fasting state: the Postprandial Metabolism (PoMet) study in healthy young adults.Br J Nutr. 2024 Oct 14;132(7):851-861. doi: 10.1017/S0007114524001934. Epub 2024 Oct 18. Br J Nutr. 2024. PMID: 39422147 Free PMC article.
-
Assessment of Dietary Choline Intake, Contributing Food Items, and Associations with One-Carbon and Lipid Metabolites in Middle-Aged and Elderly Adults: The Hordaland Health Study.J Nutr. 2022 Feb 8;152(2):513-524. doi: 10.1093/jn/nxab367. J Nutr. 2022. PMID: 34643705 Free PMC article.
-
The acute postprandial response of homocysteine to multivitamin and mineral supplementation with a standard meal is not impaired in older compared to younger adults.Eur J Nutr. 2023 Apr;62(3):1309-1322. doi: 10.1007/s00394-022-03068-7. Epub 2022 Dec 20. Eur J Nutr. 2023. PMID: 36539620
-
Moderate Postmeal Walking Has No Beneficial Effects Over Resting on Postprandial Lipemia, Glycemia, Insulinemia, and Selected Oxidative and Inflammatory Parameters in Older Adults with a Cardiovascular Disease Risk Phenotype: A Randomized Crossover Trial.J Nutr. 2019 Nov 1;149(11):1930-1941. doi: 10.1093/jn/nxz148. J Nutr. 2019. PMID: 31318033 Clinical Trial.
Cited by
-
Time-resolved concentrations of serum amino acids, one-carbon metabolites and B-vitamin biomarkers during the postprandial and fasting state: the Postprandial Metabolism in Healthy Young Adults (PoMet) Study.Br J Nutr. 2024 Mar 14;131(5):786-800. doi: 10.1017/S0007114523002490. Epub 2023 Oct 27. Br J Nutr. 2024. PMID: 37886826 Free PMC article.
-
Serum concentrations of lipids, ketones and acylcarnitines during the postprandial and fasting state: the Postprandial Metabolism (PoMet) study in healthy young adults.Br J Nutr. 2024 Oct 14;132(7):851-861. doi: 10.1017/S0007114524001934. Epub 2024 Oct 18. Br J Nutr. 2024. PMID: 39422147 Free PMC article.
References
-
- White E. Measurement error in biomarkers: sources, assessment, and impact on studies. IARC Sci Publ. 2011;163:143–161. - PubMed
-
- David Wang D, Sievenpiper JL, de Souza RJ, Cozma AI, Chiavaroli L, Ha V, Mirrahimi A, Carleton AJ, Di Buono M, Jenkins AL, Leiter LA, Wolever TM, Beyene J, Kendall CW, Jenkins DJ. Effect of fructose on postprandial triglycerides: a systematic review and meta-analysis of controlled feeding trials. Atherosclerosis. 2014;232(1):125–133. doi: 10.1016/j.atherosclerosis.2013.10.019. - DOI - PubMed
-
- Musa-Veloso K, Poon T, Harkness LS, O'Shea M, Chu Y. The effects of whole-grain compared with refined wheat, rice, and rye on the postprandial blood glucose response: a systematic review and meta-analysis of randomized controlled trials. Am J Clin Nutr. 2018;108(4):759–774. doi: 10.1093/ajcn/nqy112. - DOI - PubMed
-
- Kdekian A, Alssema M, Van Der Beek EM, Greyling A, Vermeer MA, Mela DJ, Trautwein EA. Impact of isocaloric exchanges of carbohydrate for fat on postprandial glucose, insulin, triglycerides, and free fatty acid responses-a systematic review and meta-analysis. Eur J Clin Nutr. 2020;74(1):1–8. doi: 10.1038/s41430-019-0534-6. - DOI - PubMed
MeSH terms
Substances
LinkOut - more resources
Full Text Sources
Medical
