. 2023 Sep 15;133(18):e159181.
doi: 10.1172/JCI159181.

Targeting collagen XVIII improves the efficiency of ErbB inhibitors in breast cancer models

Affiliations

Targeting collagen XVIII improves the efficiency of ErbB inhibitors in breast cancer models

Raman Devarajan et al. J Clin Invest. .

Abstract

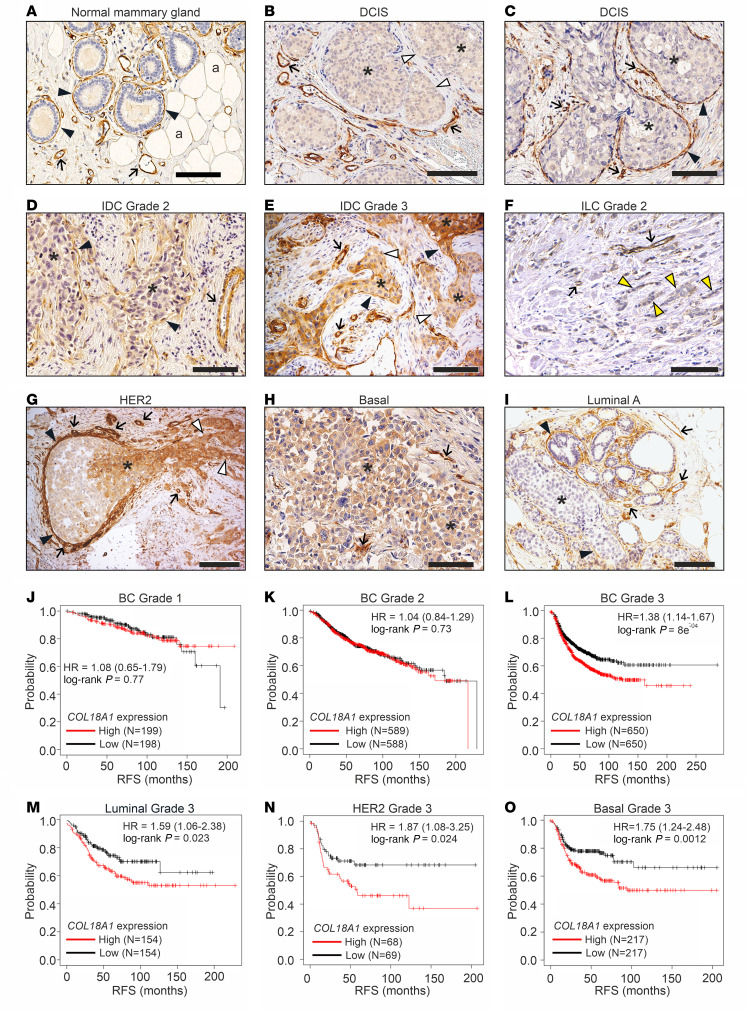
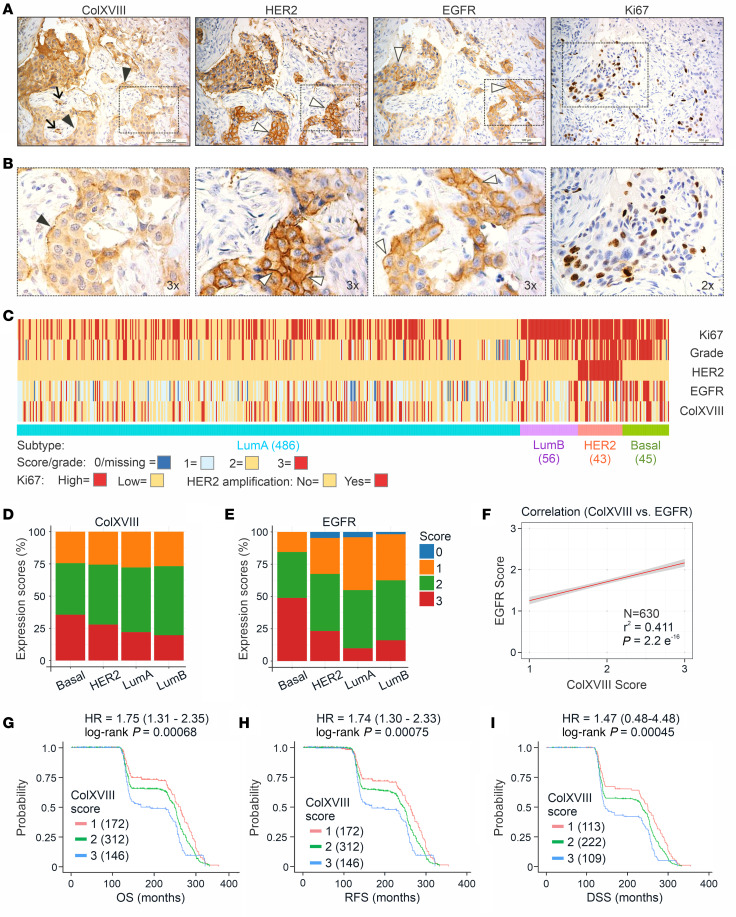
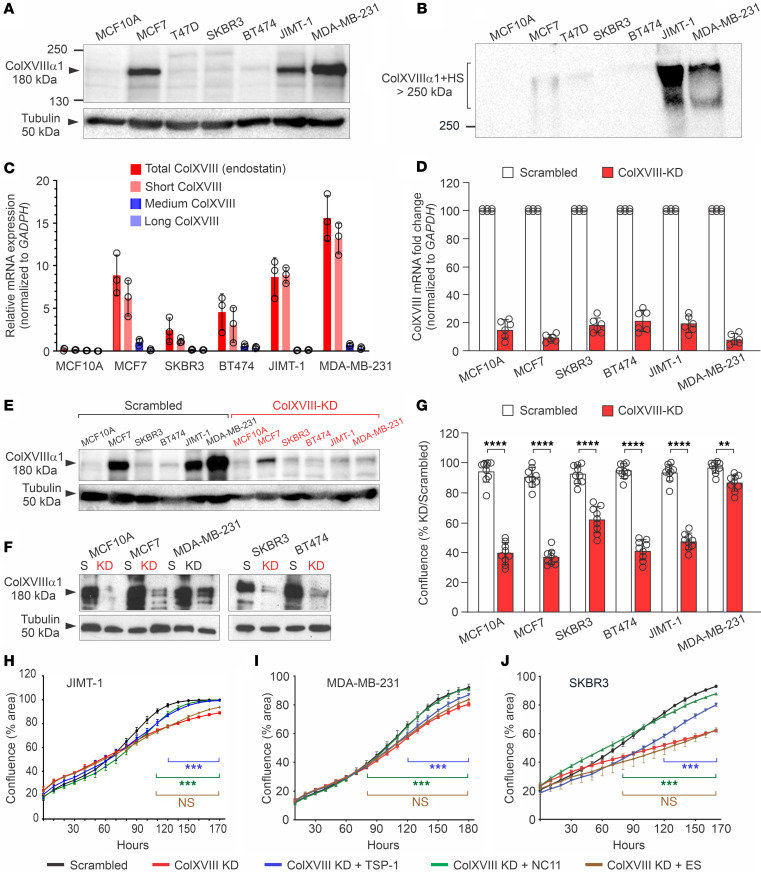
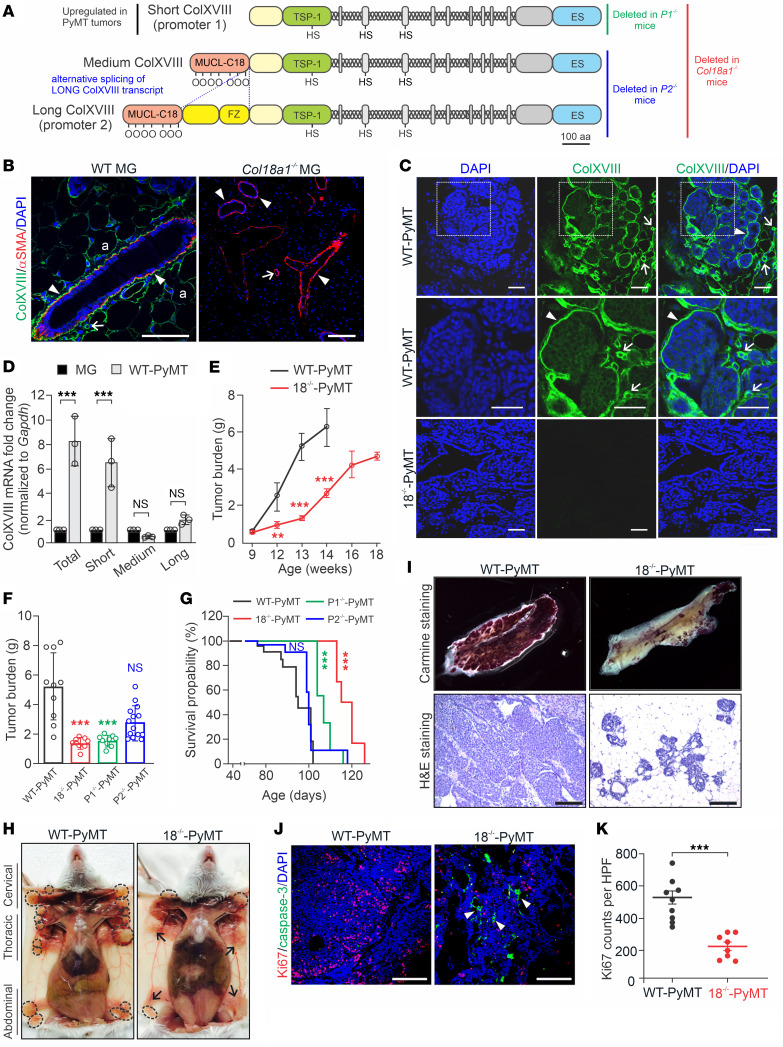
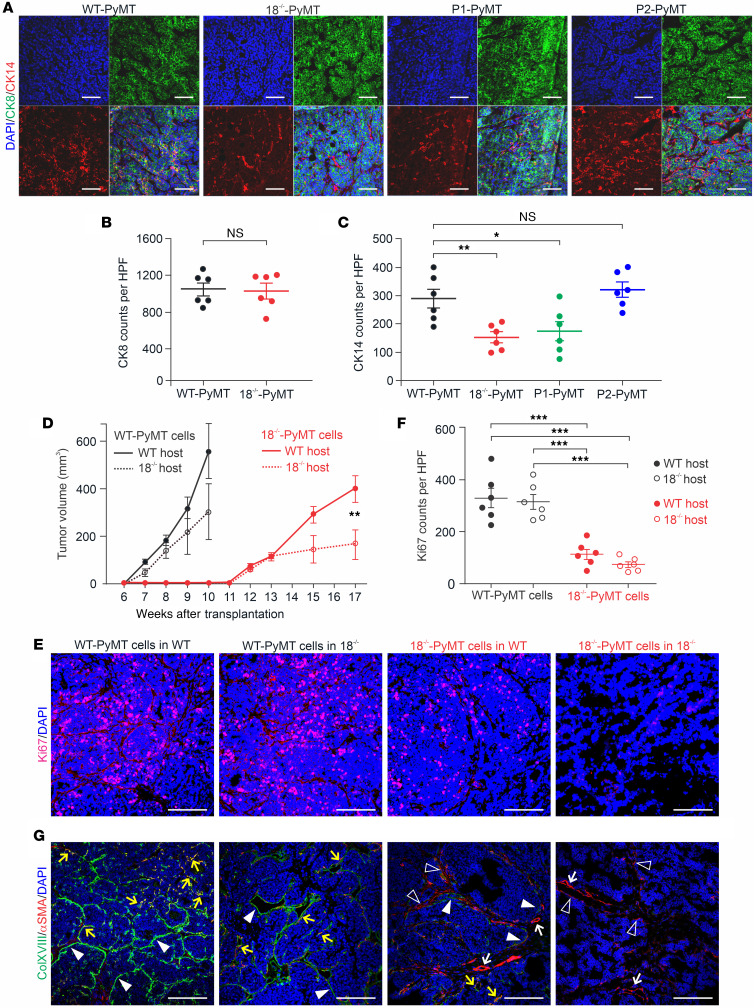
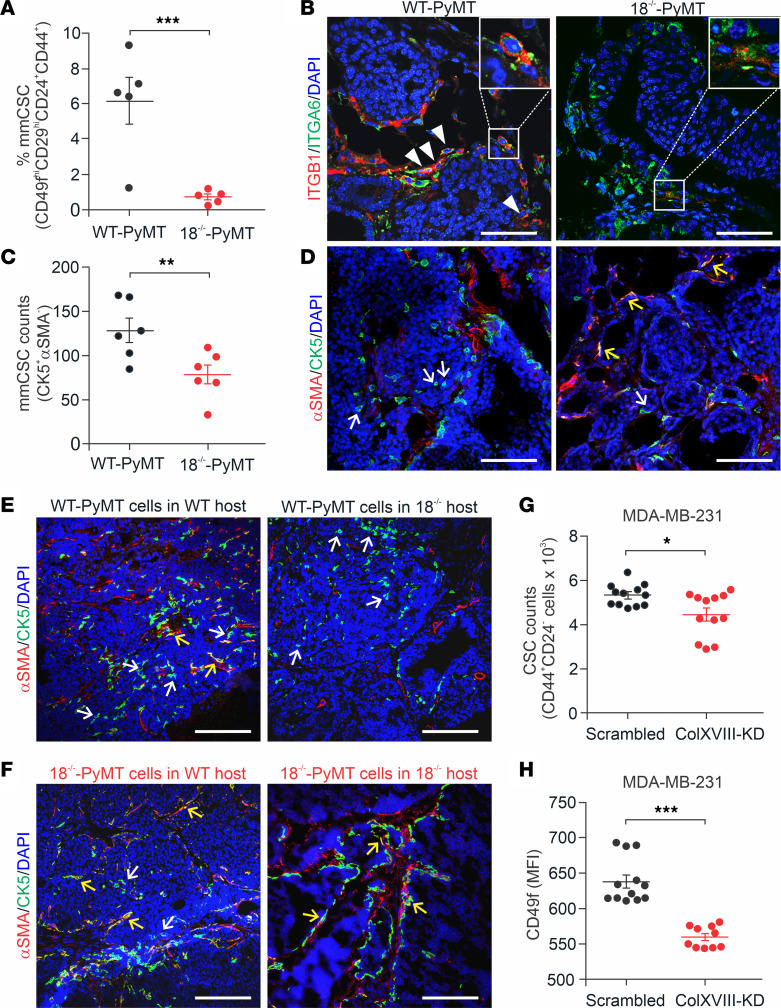
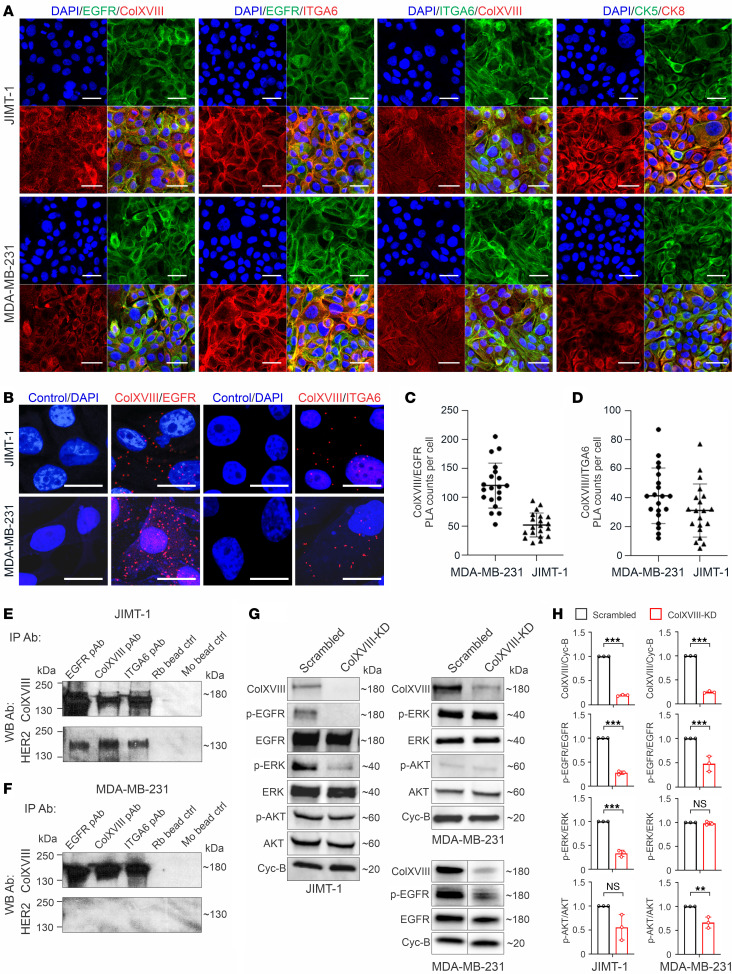
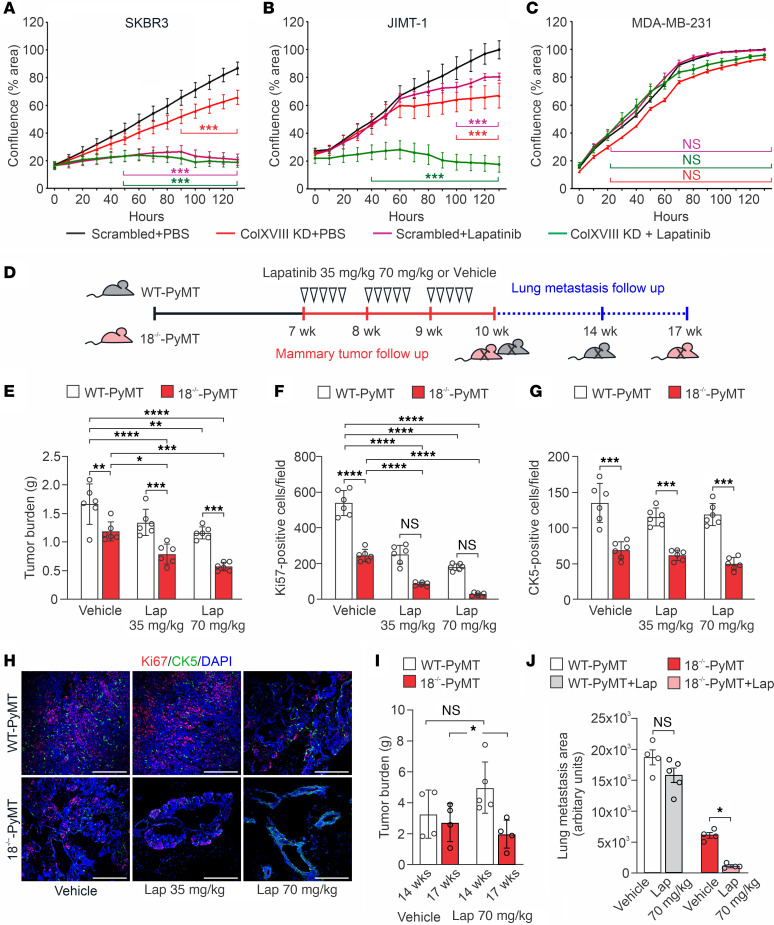
The tumor extracellular matrix (ECM) critically regulates cancer progression and treatment response. Expression of the basement membrane component collagen XVIII (ColXVIII) is induced in solid tumors, but its involvement in tumorigenesis has remained elusive. We show here that ColXVIII was markedly upregulated in human breast cancer (BC) and was closely associated with a poor prognosis in high-grade BCs. We discovered a role for ColXVIII as a modulator of epidermal growth factor receptor tyrosine kinase (ErbB) signaling and show that it forms a complex with ErbB1 and -2 (also known as EGFR and human epidermal growth factor receptor 2 [HER2]) and α6-integrin to promote cancer cell proliferation in a pathway involving its N-terminal portion and the MAPK/ERK1/2 and PI3K/AKT cascades. Studies using Col18a1 mouse models crossed with the mouse mammary tumor virus-polyoma virus middle T antigen (MMTV-PyMT) mammary carcinogenesis model showed that ColXVIII promoted BC growth and metastasis in a tumor cell-autonomous manner. Moreover, the number of mammary cancer stem cells was significantly reduced in the MMTV-PyMT and human cell models upon ColXVIII inhibition. Finally, ablation of ColXVIII substantially improved the efficacy of ErbB-targeting therapies in both preclinical models. In summary, ColXVIII was found to sustain the stemness properties of BC cells and tumor progression and metastasis through ErbB signaling, suggesting that targeting ColXVIII in the tumor milieu may have important therapeutic potential.

Keywords: Breast cancer; Collagens; Growth factors; Oncology.


Conflict of interest statement

Conflict of interest: The authors have declared that no conflict of interest exists.

Figures

Figure 1
Figure 1. High ColXVIII expression is associated with poor prognosis for human BC.
(AI). Representative images of ColXVIII expression and localization in (A) normal breast tissue, (B and C) DCIS, (D and E) grade-2 and -3 IDCs, (F) grade-2 ILC, and (G) HER2, (H) basal/TNBC, and (I) luminal A subtypes of BC (n = 730, Supplemental Table 1). Panel G is shown also in Supplemental Figure 2, together with the negative staining control for the mAB DB144-N2 used in IHC (Supplemental Figure 2, M and N). Black arrowheads, epithelial BM; white arrowheads, ColXVIII absent in the epithelial BM; yellow arrowheads, single files of tumor cells in classic ILC; arrows, vascular BM; asterisks, cytoplasmic staining in tumor cells; a, adipocyte. Scale bars: 100 μm. (JO) Kaplan-Meier plots showing RFS of patients with BC stratified by COL18A1 mRNA expression levels (probe: 209082_s_at) by cancer grade (JL) and by cancer subtype (MO, also shown in Supplemental Figure 5 together with other survival data of BC subtypes). High ColXVIII expression, red line; low ColXVIII expression, black line. The open access gene expression data and patients’ survival information from The Cancer Genome Atlas (TCGA), the Gene Expression Omnibus (GEO) database, and the European Genome Archive (EGA), compiled in a single database at www.kmplot.com (22), were used for the meta-analyses. HRs and log-rank P values were computed using the median ColXVIII expression level as the cutoff. The initial number of patients in each group is indicated in the survival graphs.
Figure 2
Figure 2. Expression of ColXVIII and routine BC biomarkers in human BC.
(A) Representative images of IHC staining for ColXVIII, EGFR, HER2, and Ki67 in sequential sections of HER2 subtype BC (n = 70, Supplemental Table 1). Scale bars: 200 μm. Arrow, vascular BM; black arrowheads, epithelial BM; white arrowheads, EGFR or HER2 signal on the plasma membrane. (B) Magnified regions indicated in A (original magnification, ×2 and ×3). (C) Heatmap showing IHC scores for ColXVIII and EGFR, HER2 and Ki67 status, and nuclear tumor grades for BC samples from the Uppsala/Umeå cohort, grouped by BC subtypes. Samples analyzed for each molecular subtype: HER2, n = 43; luminal B, n = 56; luminal A, n = 486; and TNBC, n = 45. IHC scores and nuclear grades are indicated in different colors. (D and E) Proportions of IHC scores for ColXVIII and EGFR in BC subtypes in the Uppsala/Umeå cohort. (F) Correlation between the ColXVIII and EGFR scores in the Uppsala/Umeå cohort, calculated using the Kendall rank correlation coefficient (Kendall Tau). In CF, n = 630. (G) Kaplan-Meier plots showing OS (n = 630), RFS (n = 630), and disease-specific survival (DSS) (n = 444) for the Uppsala/Umeå cohort of patients with BC, stratified by cytoplasmic ColXVIII protein expression levels. HR and log-rank P values were computed using the ColXVIII IHC scores as thresholds for stratification. The initial number of patients in each group is indicated in the survival graphs.
Figure 3
Figure 3. ColXVIII promotes BC cell proliferation through its N-terminal domain.
(A and B) Representative immunoblots of ColXVIII in human BC and mammary epithelial cell lines. (A) In cell lysates, the size of the major ColXVIII band of approximately 180 kDa corresponds to the core polypeptide of the short isoform (60). (B) JIMT-1 and MDA-MB-231 cells secreted high amounts of glycosylated ColXVIII, which appears as a broad smear over 250 kDa. In A and B, biological replicates: lysates, n ≥5; culture media, n = 3. (C) Relative expression of the short, medium, and long COL18A1 mRNA transcripts normalized to GAPDH in human BC cell lines (n = 3). The primer pairs are listed in Supplemental Table 5. (D) qRT-PCR analysis of total COL18A1 mRNA after its KD in BC cell lines (n = 6). (E and F) Examples of immunoblots of ColXVIII protein levels in various KD cell lines and corresponding scrambled controls (S). n ≥3 biological replicates for each cell line. In A, E, and F, the loading control was β-tubulin. (G) Confluence of ColXVIII-KD versus scrambled cell lines (percentage), measured by an IncuCyte live-cell analysis system for 96 hours (n = 9). (HJ) Confluence of KD cell lines after administration of recombinant NC ColXVIII fragments (500 ng/mL) to the KD cells (n = 3). Untreated scrambled cell lines are shown as controls. TSP-1, TSP-1 domain; NC11, full-length N-terminal NC. Data in C, D, G, and HJ are presented as the mean ± SD. **P < 0.01, ***P < 0.001, and ****P < 0.0001, by 2-tailed Student’s t test (C, D, and G) and 2-way ANOVA with Dunnett’s multiple-comparison (treated vs. ColXVIII-KD) (HJ).
Figure 4
Figure 4. The short ColXVIII isoform promotes mammary tumor growth in mice.
(A) Structures of 3 α1(XVIII) collagen chains and Col18a1 mouse models. (B and C) ColXVIII expression (green) in MGs of WT and ColXVIII-KO (Col18a1–/–) females (n = 3) (B) and in WT MMTV-PyMT (WT-PyMT) and Col18a1–/– MMTV-PyMT (18–/–-PyMT) mammary tumors (n ≥10) (C). αSMA (red) in myoepithelial cells and vascular smooth muscle cells (B). Arrowheads, epithelial BM; arrows, vascular BM; a, adipocyte. (D) Expression of short, medium, and long Col18a1 transcripts normalized to Gapdh in WT MGs and WT-PyMT tumors (n = 3). (E) Tumor burden in WT-PyMT and 18–/–-PyMT mice at 9–18 weeks of age (n ≥3 per genotype at each time point). (F) Mammary tumor burden at week 13 in WT-PyMT (n = 10), 18–/–-PyMT (n = 9), P1-PyMT (n = 9), and P2-PyMT (n = 14) mice. (G) Kaplan-Meier plots for WT-PyMT (n = 38), 18–/–-PyMT (n = 31), P1-PyMT (n = 28), and P2-PyMT (n = 33) mice. (H) Tumors (circles) in MGs of WT-PyMT and 18–/–-PyMT mice at week 13. Arrows indicate macroscopically normal MGs. (I) Carmine Alum-stained MGs and H&E-stained WT-PyMT and 18–/–-PyMT tumor sections at week 13 (n ≥6). (J) Ki67 (red) and cleaved caspase-3 (green) in WT-PyMT and 18–/–-PyMT tumors. Arrowheads point to apoptotic cells in the 18–/–-PyMT specimen. (K) Ki67+ cells in WT-PyMT (n = 9) and 18–/–-PyMT tumors (n = 8) (4 fields/tumor at ×20). Scale bars: 200 μm (B, C, I, and J). **P < 0.01 and ***P < 0.001, by 2-tailed Student’s t test (D, E, and K), 1-way ANOVA with Bartlett’s post-correction test for equal variances (F), and Mantel-Cox test (G). Error bars indicate the SEM.
Figure 5
Figure 5. Expression of cytokeratins in PyMT tumors and orthotopic allograft transplantation experiments.
(A) Representative images of immunostaining of CK8 and CK14 in WT-PyMT, 18–/–-PyMT, P1-PyMT, and P2-PyMT tumors. (B) Quantification of CK8+ luminal cells in WT-PyMT and 18–/–-PyMT tumors. (C) Quantification of CK14+ basal cells in WT-PyMT, 18–/–-PyMT, P1-PyMT, and P2-PyMT tumors. In B and C, n = 6/genotype; n = 4 random fields/tumor at ×20. (D) Growth rates of transplanted WT-PyMT and 18–/–-PyMT tumors in WT and Col18a1–/– hosts. Number of mice (N) and allograft tumors (n): WT-PyMT cells in WT hosts and 18–/–-PyMT cells in WT hosts (N = 12, n = 24), WT-PyMT cells in Col18a1–/– hosts and 18–/–-PyMT cells in Col18a1–/– hosts (N = 6, n = 12). (E) Representative images of Ki67 immunostaining in WT-PyMT and 18–/–-PyMT allografts. (F) Quantification of the Ki67+ cell counts in transplanted tumors (n = 6/group, n = 4 random fields/tumor at ×20). (G) Representative images of ColXVIII (green) and αSMA (red) expression in allograft tumors. Arrowheads indicate ColXVIII+ structures or cells at tumor borders; open arrowheads show αSMA+ cells; yellow arrows point to αSMA and ColXVIII double-positive structures and cells; white arrows indicate αSMA+ blood vessels. Scale bars: 200 μm (A, E, and G). DAPI, blue. *P < 0.05, **P < 0.01, and ***P < 0.01, by 2-tailed Student’s t test (B and D) and 2-way ANOVA with Dunnett’s multiple-comparison test (C and F). Error bars indicate the SEM.
Figure 6
Figure 6. ColXVIII expression in mouse mammary CSCs.
(A) Quantification of FACS-sorted CD44+, CD24+, CD29hi, and CD49fhi mouse mammary CSCs (mmCSC) from tumors from 13-week-old WT-PyMT and 18–/–-PyMT mice (n = 5 per genotype; n = 3 technical replicates for each). (B) Representative images of ITGB1 (CD29, red) and ITGA6 (CD49f, green) immunofluorescence staining of mammary tumors at week 13. Arrowheads indicate CD29 and CD49f double-positive cells in WT-PyMT tumors. Insets show strongly double-positive cells in WT-PyMT tumors and weakly double-positive cells in 18–/–-PyMT tumors (n = 5). Original magnification of insets, ×2.5. (C and D) Analysis of CK5 and αSMA expression in WT-PyMT and 18–/–-PyMT tumor tissues at week 13. (C) Quantification of discrete CK5+ and αSMA cells (n = 6 per genotype; n = 4 random fields/tumor at ×20). (D) Representative images of CK5 (green) and αSMA (red) staining. (E and F) Representative images of CK5 (green) and αSMA (red) staining in allograft tumors. White arrows show CK5+ and αSMA progenitor cells; yellow arrows point to CK5/αSMA double-positive mature myoepithelial cells (n ≥6). (G) CSC populations in the ColXVIII siRNA–transfected KD and scrambled vector–transfected control MDA-MB-231 cells, as estimated by FACS-sorted CD44+ CD24lo/– cells. (H) Quantification of the MFI of CD49f+ cells in ColXVIII-KD and control MDA-MB-231 cells. n = 4 biological replicates; n = 3 technical replicates (G and H). Scale bars: 100 μm (B, D, E and F). DAPI, blue. *P < 0.05, **P < 0.01, and ***P < 0.001, by 2-tailed Student’s t test (A, C, G and H). Error bars indicate the SEM.
Figure 7
Figure 7. Interactions between ColXVIII, ErbBs, and integrins and analyses of ErbB signaling.
(A) Representative images of immunostaining for ColXVIII, EGFR, and α6-integrin (ITGA6) in JIMT-1 and MDA-MB-231 cells (n ≥3). (BD) In situ PLA in JIMT-1 and MDA-MB-231 cells. (B) Evidence of proximity (distance < 40 nm) for ColXVIII (mAb DB144-N2) and EGFR (mAb 52894) and for ColXVIII (mAb DB144-N2) and α6-integrin (primary Ab [pAb] 97760) is indicated by the presence of red dots. PLAs without pAbs served as the negative controls. Scale bars: 50 μm (A); 20 μm (B). (C and D) Quantitation of PLA counts for ColXVIII and EGFR (C) and ColXVIII and α6-integrin (D) (n = 3 biological replicates; n = 20 cells per sample). (E and F) Co-IP of ColXVIII (mouse mAB DB144-N2), EGFR (rabbit mAb 52894), and α6-integrin (rabbit pAb 97760) in HER2+ JIMT-1 (E) cells and in triple-negative MDA-MB-231 (F) cells. Protein complexes were detected in Western blot (WB) with ColXVIII (rabbit pAb QH48.18) and HER2 (rabbit mAb 4290) Abs (n ≥ 5). Goat anti–rabbit (Rb) IgG– and goat anti–mouse (Mo) IgG–coated magnetic bead controls are shown. (G) Representative immunoblots of EGFR and downstream signaling mediators in scrambled and ColXVIII-KD JIMT-1 and MDA-MB-231 cell lysates. In MDA-MB-231 cell lysates, the results for p-EGFR and EGFR along with ColXVIII were derived from another biological replicate. (H) Quantitation of ColXVIII, and EGFR, ERK, and AKT phosphorylation in JIMT-1 and MDA-MB-231 cell lysates (n = 3 biological replicates). **P < 0.01 and ***P < 0.001, by 2-tailed Student’s t test (H). Error bars indicate the SD.
Figure 8
Figure 8. Depletion of ColXVIII improves the efficacy of ErbB-targeting drugs in preclinical BC models.
(AC) Cell proliferation, monitored as the cell confluence (percentage) for 5 days using the IncuCyte live-cell imaging platform, in BC cell lines with ColXVIII KD and lapatinib treatment (n = 3 biological replicates per cell line in triplicate). (D) Schematic figure of the lapatinib treatment regimen and follow up of the primary tumor growth (red) and lung metastasis (blue) in WT-PyMT and 18–/–-PyMT mice. (E) The total tumor burden in vehicle-treated (0.5% hydroxymethyl-cellulose) and lapatinib-treated WT-PyMT mice and 18–/–-PyMT mice at the age of 10 weeks. Two doses of lapatinib, 35 mg/kg and 70 mg/kg, were tested (n = 6 mice/group). (F and G) Quantification of the Ki67+ and the CK5+ cells (n = 6, n = 4 random fields/tumor at ×20). (H) Representative images of proliferating Ki67+ cells (red) and CK5+ mammary progenitor cells (green) in the vehicle- and lapatinib-treated WT-PyMT and 18–/–-PyMT tumors at week 10. Scale bars: 200 nm. (I) Mammary tumor burden in vehicle- and lapatinib-treated (70 mg/kg) WT-PyMT mice (14 weeks) and 18–/–-PyMT (17 weeks) mice (n = 4–5 mice/experimental group). (J) Quantification of lung metastasis area of vehicle and lapatinib (70 mg/kg) treated WT-PyMT mice (14 weeks) and 18–/–-PyMT (17 weeks) mice using ImageJ software (NIH) (n = 4–5). *P < 0.05, **P < 0.01, ***P < 0.001, and ****P < 0.0001, by 2-way ANOVA followed by Bonferroni’s post test (AC) and Tukey’s multiple-comparison test (EG, I, and J). Error bars indicate the SEM.

Similar articles

Cited by

References

    1. Sung H, et al. Global Cancer Statistics 2020: GLOBOCAN Estimates of Incidence and Mortality Worldwide for 36 Cancers in 185 Countries. CA Cancer J Clin. 2021;71(3):209–249. doi: 10.3322/caac.21660. - DOI - PubMed
    1. Feng Y, et al. Breast cancer development and progression: Risk factors, cancer stem cells, signaling pathways, genomics, and molecular pathogenesis. Genes Dis. 2018;5(2):77–106. doi: 10.1016/j.gendis.2018.05.001. - DOI - PMC - PubMed
    1. Hynes NE, MacDonald G. ErbB receptors and signaling pathways in cancer. Curr Opin Cell Biol. 2009;21(2):177–184. doi: 10.1016/j.ceb.2008.12.010. - DOI - PubMed
    1. Swain SM, et al. Targeting HER2-positive breast cancer: advances and future directions. Nat Rev Drug Discov. 2023;22(2):101–126. doi: 10.1038/s41573-022-00579-0. - DOI - PMC - PubMed
    1. Hsu JL, Hung MC. The role of HER2, EGFR, and other receptor tyrosine kinases in breast cancer. Cancer Metastasis Rev. 2016;35(4):575–588. doi: 10.1007/s10555-016-9649-6. - DOI - PMC - PubMed

Publication types