

Immunopeptidome profiling of human coronavirus OC43-infected cells identifies CD4 T-cell epitopes specific to seasonal coronaviruses or cross-reactive with SARS-CoV-2
- PMID: 37498934
- PMCID: PMC10409285
- DOI: 10.1371/journal.ppat.1011032
Immunopeptidome profiling of human coronavirus OC43-infected cells identifies CD4 T-cell epitopes specific to seasonal coronaviruses or cross-reactive with SARS-CoV-2
Abstract
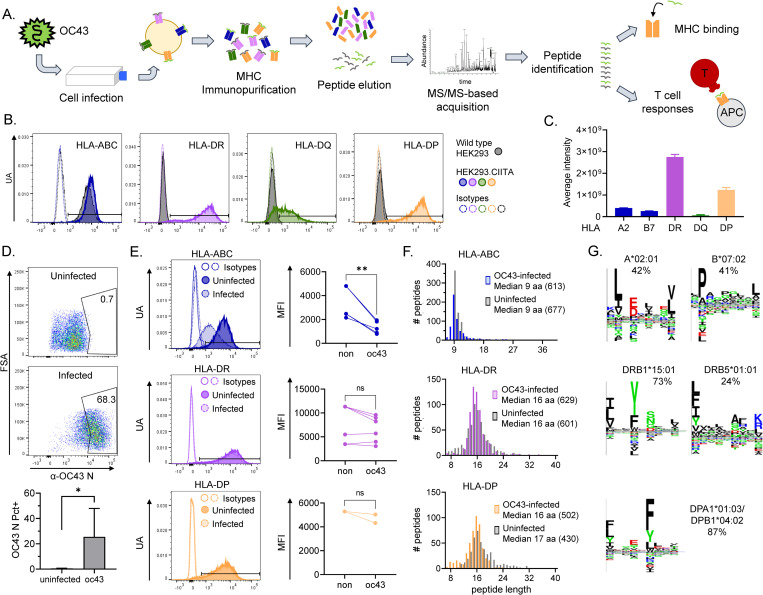
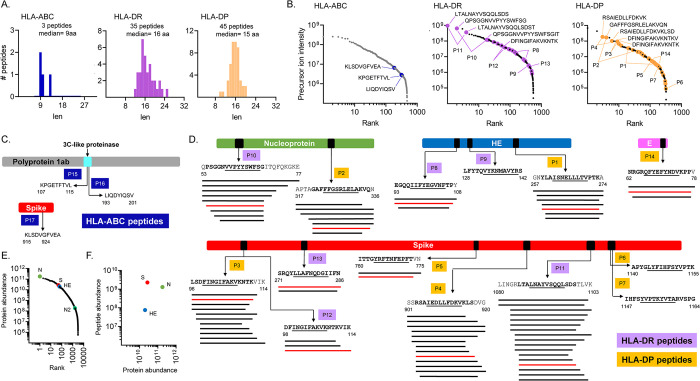
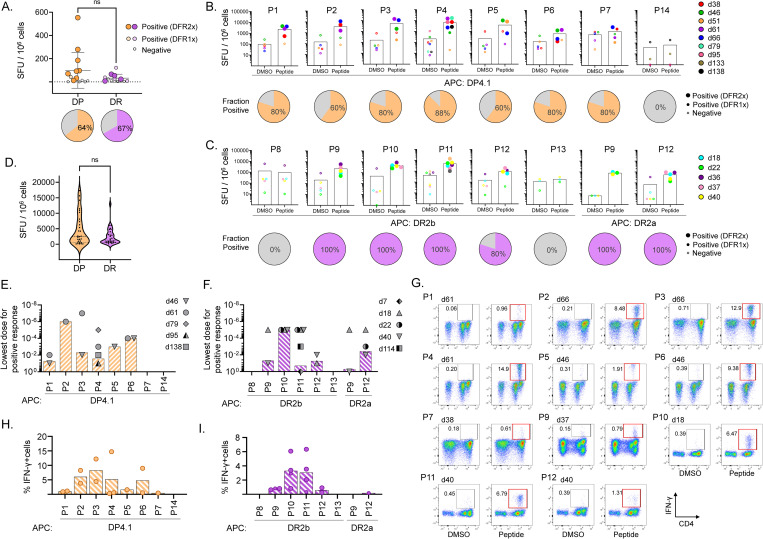
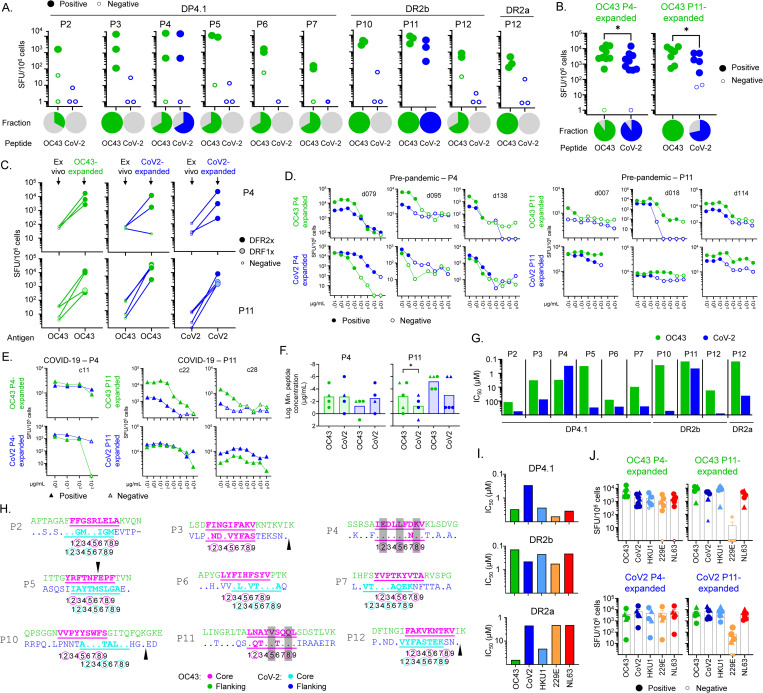
Seasonal "common-cold" human coronaviruses are widely spread throughout the world and are mainly associated with mild upper respiratory tract infections. The emergence of highly pathogenic coronaviruses MERS-CoV, SARS-CoV, and most recently SARS-CoV-2 has prompted increased attention to coronavirus biology and immunopathology, but the T-cell response to seasonal coronaviruses remains largely uncharacterized. Here we report the repertoire of viral peptides that are naturally processed and presented upon infection of a model cell line with seasonal coronavirus OC43. We identified MHC-bound peptides derived from each of the viral structural proteins (spike, nucleoprotein, hemagglutinin-esterase, membrane, and envelope) as well as non-structural proteins nsp3, nsp5, nsp6, and nsp12. Eighty MHC-II bound peptides corresponding to 14 distinct OC43-derived epitopes were identified, including many at very high abundance within the overall MHC-II peptidome. Fewer and less abundant MHC-I bound OC43-derived peptides were observed, possibly due to MHC-I downregulation induced by OC43 infection. The MHC-II peptides elicited low-abundance recall T-cell responses in most donors tested. In vitro assays confirmed that the peptides were recognized by CD4+ T cells and identified the presenting HLA alleles. T-cell responses cross-reactive between OC43, SARS-CoV-2, and the other seasonal coronaviruses were confirmed in samples of peripheral blood and peptide-expanded T-cell lines. Among the validated epitopes, spike protein S903-917 presented by DPA1*01:03/DPB1*04:01 and S1085-1099 presented by DRB1*15:01 shared substantial homology to other human coronaviruses, including SARS-CoV-2, and were targeted by cross-reactive CD4 T cells. Nucleoprotein N54-68 and hemagglutinin-esterase HE128-142 presented by DRB1*15:01 and HE259-273 presented by DPA1*01:03/DPB1*04:01 are immunodominant epitopes with low coronavirus homology that are not cross-reactive with SARS-CoV-2. Overall, the set of naturally processed and presented OC43 epitopes comprise both OC43-specific and human coronavirus cross-reactive epitopes, which can be used to follow CD4 T-cell cross-reactivity after infection or vaccination, and to guide selection of epitopes for inclusion in pan-coronavirus vaccines.
Copyright: © 2023 Becerra-Artiles et al. This is an open access article distributed under the terms of the Creative Commons Attribution License, which permits unrestricted use, distribution, and reproduction in any medium, provided the original author and source are credited.
Conflict of interest statement
The authors have declared that no competing interests exist.
Figures
Update of
-
Immunopeptidome profiling of human coronavirus OC43-infected cells identifies CD4 T cell epitopes specific to seasonal coronaviruses or cross-reactive with SARS-CoV-2.bioRxiv [Preprint]. 2022 Dec 1:2022.12.01.518643. doi: 10.1101/2022.12.01.518643. bioRxiv. 2022. Update in: PLoS Pathog. 2023 Jul 27;19(7):e1011032. doi: 10.1371/journal.ppat.1011032. PMID: 36482973 Free PMC article. Updated. Preprint.
Similar articles
-
Immunopeptidome profiling of human coronavirus OC43-infected cells identifies CD4 T cell epitopes specific to seasonal coronaviruses or cross-reactive with SARS-CoV-2.bioRxiv [Preprint]. 2022 Dec 1:2022.12.01.518643. doi: 10.1101/2022.12.01.518643. bioRxiv. 2022. Update in: PLoS Pathog. 2023 Jul 27;19(7):e1011032. doi: 10.1371/journal.ppat.1011032. PMID: 36482973 Free PMC article. Updated. Preprint.
-
SARS-CoV-2-Seronegative Subjects Target CTL Epitopes in the SARS-CoV-2 Nucleoprotein Cross-Reactive to Common Cold Coronaviruses.Front Immunol. 2021 Apr 28;12:627568. doi: 10.3389/fimmu.2021.627568. eCollection 2021. Front Immunol. 2021. PMID: 33995351 Free PMC article. Clinical Trial.
-
SARS-CoV-2-reactive T cells in healthy donors and patients with COVID-19.Nature. 2020 Nov;587(7833):270-274. doi: 10.1038/s41586-020-2598-9. Epub 2020 Jul 29. Nature. 2020. PMID: 32726801
-
Roles of Sialyl Glycans in HCoV-OC43, HCoV-HKU1, MERS-CoV and SARS-CoV-2 Infections.Methods Mol Biol. 2022;2556:243-271. doi: 10.1007/978-1-0716-2635-1_17. Methods Mol Biol. 2022. PMID: 36175638 Review.
-
SARS-CoV-2 human T cell epitopes: Adaptive immune response against COVID-19.Cell Host Microbe. 2021 Jul 14;29(7):1076-1092. doi: 10.1016/j.chom.2021.05.010. Epub 2021 May 21. Cell Host Microbe. 2021. PMID: 34237248 Free PMC article. Review.
Cited by
-
A Broad-Spectrum Multi-Antigen mRNA/LNP-Based Pan-Coronavirus Vaccine Induced Potent Cross-Protective Immunity Against Infection and Disease Caused by Highly Pathogenic and Heavily Spike-Mutated SARS-CoV-2 Variants of Concern in the Syrian Hamster Model.bioRxiv [Preprint]. 2024 Feb 15:2024.02.14.580225. doi: 10.1101/2024.02.14.580225. bioRxiv. 2024. PMID: 38405942 Free PMC article. Preprint.
-
Machine learning-enhanced immunopeptidomics applied to T-cell epitope discovery for COVID-19 vaccines.Nat Commun. 2024 Nov 28;15(1):10316. doi: 10.1038/s41467-024-54734-9. Nat Commun. 2024. PMID: 39609459 Free PMC article.
-
A Primer on Proteomic Characterization of Intercellular Communication in a Virus Microenvironment.Mol Cell Proteomics. 2025 Mar;24(3):100913. doi: 10.1016/j.mcpro.2025.100913. Epub 2025 Jan 23. Mol Cell Proteomics. 2025. PMID: 39862905 Free PMC article. Review.
-
Diversifying selection identified in immune epitopes of bovine coronavirus isolates from Irish cattle.J Gen Virol. 2024 Aug;105(8):002019. doi: 10.1099/jgv.0.002019. J Gen Virol. 2024. PMID: 39158563 Free PMC article.
-
Recombinant XBB.1.5 boosters induce robust neutralization against KP.2- and KP.3-included JN.1 sublineages.Signal Transduct Target Ther. 2025 Jan 27;10(1):47. doi: 10.1038/s41392-025-02139-5. Signal Transduct Target Ther. 2025. PMID: 39870636 Free PMC article.
References
-
- Gaunt ER, Hardie A, Claas ECJ, Simmonds P, Templeton KE. Epidemiology and clinical presentations of the four human coronaviruses 229E, HKU1, NL63, and OC43 detected over 3 years using a novel multiplex real-time PCR method. J Clin Microbiol. 2010;48: 2940–2947. doi: 10.1128/JCM.00636-10 - DOI - PMC - PubMed
Publication types
MeSH terms
Substances
Grants and funding
LinkOut - more resources
Full Text Sources
Medical
Research Materials
Miscellaneous
