. 2023 Aug 29;42(8):112791.
doi: 10.1016/j.celrep.2023.112791. Epub 2023 Jul 26.

FOXC2 promotes vasculogenic mimicry and resistance to anti-angiogenic therapy

Affiliations

FOXC2 promotes vasculogenic mimicry and resistance to anti-angiogenic therapy

Ian G Cannell et al. Cell Rep. .

Abstract

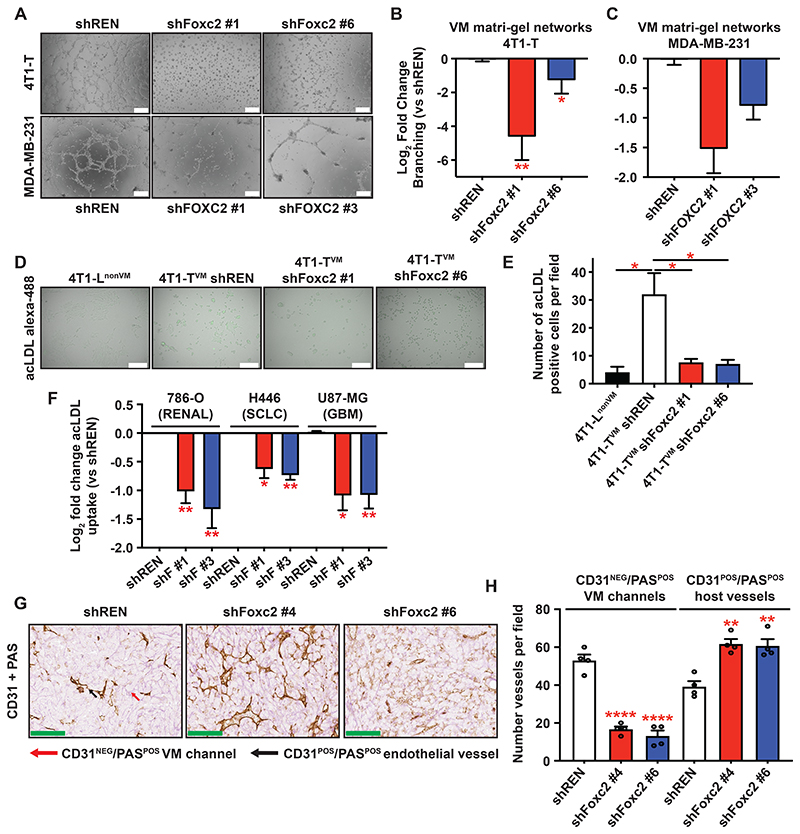
Vasculogenic mimicry (VM) describes the formation of pseudo blood vessels constructed of tumor cells that have acquired endothelial-like properties. VM channels endow the tumor with a tumor-derived vascular system that directly connects to host blood vessels, and their presence is generally associated with poor patient prognosis. Here we show that the transcription factor, Foxc2, promotes VM in diverse solid tumor types by driving ectopic expression of endothelial genes in tumor cells, a process that is stimulated by hypoxia. VM-proficient tumors are resistant to anti-angiogenic therapy, and suppression of Foxc2 augments response. This work establishes co-option of an embryonic endothelial transcription factor by tumor cells as a key mechanism driving VM proclivity and motivates the search for VM-inhibitory agents that could form the basis of combination therapies with anti-angiogenics.

Keywords: CP: Cancer; anti-angiogenic therapy; epithelial-to-endothelial transistion; transcriptional reprogramming; transdifferentiation; tumor vasculature.


Conflict of interest statement

Declaration of interests The authors have filed a patent covering use of FOXC2 and FOXC2-regulated gene sets as diagnostics and as a route toward development of VM inhibitors.

Figures

Figure 1
Figure 1. Visualization of perfused vasculogenic mimicry channels in vivo with lectin labelling, tissue clearing and 3D imaging.
(A) 3D reconstruction of a ~1mm cleared 4T1-T tumor slice labelled intravenously by injection of lectin (magenta, 1A-F) and with CD31 antibody staining (yellow, 1A-F) using light sheet microscopy. (B) A representative lectinPOS/CD31NEG VM vessel in 3D. (C) Maximum intensity projections of the ~1mm Z-stack split by channel showing lectin and CD31. White arrows indicate VM vessels (lectinPOS/CD31NEG), green arrows indicate host vessels (lectinPOS/CD31POS). (D) Representative 3D renderings of CD31 and lectin in regions used for quantifying VM vessel volume. Arrows as in C. (E) Quantification of VM vessels in different tumor regions. The sum of CD31POS/lectinPOS (host) and CD31NEG/lectinPOS (VM) vessel volumes was calculated and the data expressed as the percent of that total that is VM. Bars mean +/- SEM, n=2 sub-regions per region. (F) Visualization of lectin perfusion status, CD31 and zsGreen-labelled tumor cells (cyan) of cleared 4T1-T tumors. White arrows indicate VM (lectinPOS/CD31NEG/zsGreenPOS), orange arrow indicates segments that are lectinPOS/CD31POS/zsGreenPOS and green arrow indicates host vessel (lectinPOS/CD31POS/zsGreenNEG).
Figure 2
Figure 2. FOXC2 is up-regulated in vasculogenic mimicry-proficient tumor cells.
(A) Volcano plot of log2 fold change mRNA expression vs FDR p-value of all TFs in 4T1-EVM and 4T1-TVM, relative to all 23 4T1 sub-clones. (B) qRT-PCR analysis of Foxc2 mRNA expression in a subset of 4T1 sub-clones expressed as log2 fold change relative to parental 4T1 cells. Bars mean (+/- SEM), n=3. * p<0.05, *** p<0.001 student’s t-test. (C) Foxc2 mRNA expression in matched primary breast tumors and lung metastases from the 4T1 model. Bars mean (+/- SEM) log2 fold change vs the primary tumor, n=4. **** p<0.0001 student’s t-test. (D) GSEA of gene expression changes (log2 FC ranked) in 4T1-EVM and 4T1-TVM, relative to all 23 4T1 sub-clones, for FOXC2-target Gene Set#1 (Table S1). ES = enrichment score, NES = normalized ES. (E) FOXC2 mRNA expression in breast cancer patients (METABRIC) stratified by molecular sub-type (Claudin-low/Basal vs Luminal A/Luminal B/HER2-enriched). Box plots according to the Tukey convention. n represents an individual patient. **** p<0.0001, Wilcoxon rank-sum. (F) GSEA as in D in VM-proficient solid tumor human cell lines (HCC38, MDA-MB-231, U87MG, NCIH446, U251MG) from the CCLE relative to all solid tumor cell lines in the CCLE, for FOXC2-target Gene Set#1. (G) GSEA as in F of protein expression changes (for which proteomics data exist). (H) FOXC2 mRNA expression from ex vivo cultures of SCLC circulating tumor cell-derived explants (CDX) separated into VM-competent (non-neuroendocrine) and VM-deficient (neuroendocrine) cells across multiple CDX models (CDX17, CDX17P, CDX30, CDX31P) from RNA-Seq data in Pearsall et al.,. Z-scored gene expression values from paired neuroendocrine and non-neuroendocrine cells across 4 CDX models. Box plots according to the Tukey convention. n represents an individual CDX model. * p<0.05, Wilcoxon rank-sum. (I) GSEA as in D in non-neuroendocrine versus neuroendocrine cells derived from 4 CDX models (RNA-Seq data from H).
Figure 3
Figure 3. FOXC2 is required for VM and the endothelial-like properties of VM-proficient tumor cells.
(A) Representative Matrigel network formation assay images of murine 4T1-TVM or VM competent human MDA-MB-231 breast cancer cells expressing a control (shREN) or two different Foxc2-targeting shRNAs. Bar = 200 μm. (B) Quantification of replicate experiments in A. Bars mean log2 fold change (+/- SEM) in branching length vs shREN normalized for viability. n=3. * p<0.05, ** p<0.01 vs shREN, student’s t-test. (C) As in B with MDA-MB-231 cells. n=2. (D) Representative fluorescent images of Alexa-488 labelled acLDL uptake assays in 4T1-LnonVM or 4T1-TVM cells expressing shREN or two different Foxc2-targeting shRNAs. Bar = 200 μm. (E) Quantification of acLDL uptake from D. Bars mean acLDLPOS cells per field (+/-SEM), n=3, p<0.05, student’s t-test. (F) Quantification of acLDL uptake in renal, SCLC and GBM cell lines from Figure S3G. Bars mean log2 fold change of acLDL positive tdTomato co-positive cells relative to shREN (+/- SEM), n=3, * p<0.05, ** p<0.01, student’s t-test. (G) Representative images of CD31/PAS dual staining of sections from 4T1-TVM tumors expressing shREN or two different Foxc2-targeting shRNAs (dox-inducible). Black arrows, endothelial vessels (CD31POS/PASPOS) and red arrows, VM vessels (CD31NEG/PASPOS). Bar = 100 μm. (H) Quantification of VM and host vessels from sections stained in G. Bars mean channel number (+/- SEM) per field, n=4 fields per condition from two different animals, ** p<0.01, **** p<0.0001, student’s t-test.
Figure 4
Figure 4. FOXC2 promotes expression of endothelial genes in tumor cells of aggressive breast cancer subtypes.
(A) Tissue-specific expression analysis (TSEA) of top 100 up-regulated genes in HMLER cells over expressing FOXC2 (GSE4435) or the EMT transcription factors TWIST, SLUG or SNAIL (GSE43495). Color represents the -log10 of the Benjamini-Hochberg corrected FDR enrichment p-value for each tissue, TSEA specificity threshold of 0.001. For all gene sets see Table S1. (B) GSEA of gene expression changes (log2 FC ranked) with FOXC2 over-expression in HMLER (GSE44335) for endothelial enriched genes from Butler et al., filtered to remove any mesenchymal genes (Endo Gene Set#1, Table S1). (C) GSEA as in B with FOXC2 knockdown in MDA-MB-231 human breast cancer cells. (D) Representative Matrigel network formation assays of 4T1-TVM cells sorted based on high or low acLDL uptake. Bar = 200 μm. (E) Quantification of Matrigel network formation assays in D. Bars mean fold-change (+/- SEM) in branching length vs the acLDLlow population. n=3, ** p<0.01, student’s t-test. (F) GSEA as in B. RNA-seq of acLDLhigh and acLDLlow 4T1-T cells sorted as in D using FOXC2-target Gene Set#1. (G) GSEA as in F using Endo Gene Set#1. (H) Expression of core FOXC2-target genes (FOXC2-target Gene Set#3) in human breast cancer cell lines from the CCLE, PDTX tumor cells (human reads), or PDTX stroma/host cells (mouse reads). Box plots according to the Tukey convention. Mean signature expression was calculated for each cell line or PDTX, n represents an individual cell line or PDTX model. *** p<0.001, **** p<0.0001, Wilcoxon rank-sum. (I) As in H for endothelial enriched genes (Endo Gene Set#1). (J) Pearson correlation between tumor/human Endo Gene Set#1 expression and tumor/human FOXC2-target Gene Set#3 expression across PDTXs. Mean signature expression was calculated as in H and I. n=71 models, red = VM-high, blue = VM-low. (K) Pearson correlation between host/mouse endothelial gene expression (Endo Gene Set#1, mouse orthologs) and tumor/human FOXC2-target Gene Set#3 expression across PDTXs. Mean signature expression was calculated as in H and I. n=71 models. (L) Pearson correlation between host/mouse endothelial gene expression (Endo Gene Set#1, mouse orthologs) and mouse Pecam1 (encoding CD31) gene expression across PDTXs. Mean signature expression was calculated as in H and I. n=71 models. (M) Representative images of CD31/PAS staining with adjacent H&E staining from three PDTXs. HCI010 and AB630, predicted VM-high (red dots, Figure 4J) and AB551, predicted VM-low (blue dot, Figure 4J). Red arrows indicate PASPOS/CD31NEG channels with red blood cells on the adjacent H&E section. Bar = 100 μm.
Figure 5
Figure 5. Severe hypoxia promotes quasi-endothelial differentiation of tumor cells.
(A) UMAP visualization of 4T1-TVM CellTag tumor scRNA-seq data, labelled by cluster number with tumor cells and endothelial cells highlighted. (B) GSEA gene expression changes in endo-high 4T1-T tumor cells vs the remaining tumor cells for FOXC2-target Gene Set#3. Endo-high = top 5% of cells based on expression of the Endo Gene Set#2. (C) GSEA-derived normalized enrichment scores (NES) of select gene sets across datasets consisting of the endo-high scRNA-Seq ranked list (in 5B), human genes ranked based on their correlation with human FOXC2-target genes across PDTXs and genes ranked based on their log2 fold change with FOXC2 knockdown in MDA-MB-231 cells. * p<0.05, ** p<0.01, **** p<0.0001, GSEA-derived FDR p value. (D) Representative images of CD31/PAS staining of parental tumors treated with B20. Bar = 100 μm. Below quantification of CD31NEG/PASPOS channels in B20 treated parental tumors. Bars mean number of channels (+/- SEM) per field, n=4 fields per condition from two different animals, ** p<0.01, student’s t-test. For quantification of host vessels and VM ratios see Figure S5I. (E) UMAP visualization of parental 4T1 CellTag tumor scRNA-seq dataset as in 5A +/- Axitinib. (F) Distribution of AUCell-calculated endo scores (Endo Gene Set#2) of all tumor cells separated by replicate and treatment. **** p<0.0001, Wilcoxon rank-sum comparing vehicle to Axitinib treatment. (G) Percentage of endo-high tumor cells based on AUCell scores in F (above the line). Bars represent mean percentage of endo-high cells, n=2 animals per treatment condition. (H) GSEA of gene expression changes in endo-high 4T1 Axitinib treated parental tumor cells vs the remaining Axitinib treated parental tumor cells for FOXC2-target Gene Set#3. (I) GSEA-derived NES for select gene sets using the ranked list from H as input. The same gene sets are highlighted in C. **** p<0.0001, GSEA-derived FDR p-value.
Figure 6
Figure 6. FOXC2-driven VM promotes resistance to anti-angiogenic therapy.
(A) GSEA of gene sets associated with AAT resistance in breast cancer patients (Bev Resistance Gene Set#1) or GBM xenografts (Bev Resistance Gene Set#2) in a meta-analysis of FOXC2 driven gene expression changes. Ranked list derived from mean of the log2 fold change upon FOXC2 over-expression in HMLER cells and the inverse log2 fold change upon FOXC2 knockdown in MDA-MB-231 cells. (B) GSEA of AAT resistance genes from breast cancer patients (Bev Resistance Gene Set#1) in acLDLhigh versus acLDLlow 4T1-TVM cells, using RNA-seq data in Figure 4D and 4E. (C) GSEA as in B in endo-high versus bulk 4T1-TVM cells using scRNA-seq data in Figure 5A and 5B. (D) Mean Z-score expression of FOXC2-target Gene Set#3 in naive or Sunitinib resistant renal PDX using either human (tumor) or mouse (stroma/host) microarrays (GSE76068). Box plots according to the Tukey convention. Mean Z-score expression was calculated per replicate, n represents an individual mouse. * p<0.05, Wilcoxon rank-sum test. (E) GSEA summary statistics of ranked lists of human FOXC2-target Gene Set#3 correlations with human/tumor genes (red bars), with mouse genes (orange bars) or with genes across patients from the METABRIC cohort (white bars), used as inputs for GSEA of AAT resistance genes. **** p<0.0001, GSEA-derived FDR, n.s. = not significant. (F) Tumor volumes of parental 4T1nonVM or 4T1-TVM tumors treated with B20 or Axitinib. Bars represent mean fold change (+/- SEM) relative to vehicle. n=10 mice per condition. *** p<0.001, **** p<0.0001, n.s. not significant, student’s t-test. (G) Tumor volumes of vehicle treated animals with Foxc2 knockdown 4T1-TVM tumors vs control (shREN) tumors. Bars mean tumor volume (mm3) (+/- SEM). n.s. = not significant. (H) Growth curves of 4T1-T tumors treated with vehicle or B20 with or without Foxc2 knockdown by doxycycline-inducible shRNAs. Curves mean tumor volume (+/- SEM) in mm3 over time. Two-way ANOVA effect of treatment F (1, 18): shREN Vehicle (n=10) vs shREN B20 (n=10) = 0.001025, p-value = 0.975. shFoxc2 #4 Vehicle (n=10) vs shFoxc2 #4 B20 (n=9) = 55.13, p-value <0.0001****. shFoxc2 #6 Vehicle (n=10) vs shFoxc2 #6 B20 (n=10) = 29.19, p-value <0.0001****. (I) Response of shREN or Foxc2 knockdown 4T1-TVM tumors to B20 (17 days). Bars mean fold change (+/- SEM) in tumor volume relative to shREN, normalized to vehicle per condition. n=10, 9, 10 mice per condition. **** p<0.0001, student’s t-test. (J) Response of shREN or Foxc2 knockdown 4T1-TVM tumors to Axitinib (10 days) as in I. n=10, 9, 10 mice per condition. *** p<0.001, **** p<0.0001, student’s t-test.

References

    1. Folkman J, Merler E, Abernathy C, Williams G. ISOLATION OF A TUMOR FACTOR RESPONSIBLE FOR ANGIOGENESIS. J Exp Medicine. 1971;133:275–288. doi: 10.1084/jem.133.2.275. - DOI - PMC - PubMed
    1. Sherwood LM, Parris EE, Folkman J. Tumor Angiogenesis: Therapeutic Implications. New Engl J Med. 1971;285:1182–1186. - PubMed
    1. Sennino B, McDonald DM. Controlling escape from angiogenesis inhibitors. Nat Rev Cancer. 2012;12:699–709. doi: 10.1038/nrc3366. - DOI - PMC - PubMed
    1. Hendrix MJC, Seftor EA, Hess AR, Seftor REB. Vasculogenic mimicry and tumour-cell plasticity: lessons from melanoma. Nat Rev Cancer. 2003;3:411–421. - PubMed
    1. Maniotis AJ, Folberg R, Hess A, Seftor EA, Gardner LMG, Pe’er J, Trent JM, Meltzer PS, Hendrix MJC. Vascular Channel Formation by Human Melanoma Cells in Vivo and in Vitro: Vasculogenic Mimicry. Am J Pathology. 1999;155:739–752. doi: 10.1016/S0002-9440(10)65173-5. - DOI - PMC - PubMed

Publication types