. 2023 Aug 17;83(16):2925-2940.e8.
doi: 10.1016/j.molcel.2023.06.031. Epub 2023 Jul 26.

Visualization of direct and diffusion-assisted RAD51 nucleation by full-length human BRCA2 protein

Affiliations

Visualization of direct and diffusion-assisted RAD51 nucleation by full-length human BRCA2 protein

Ondrej Belan et al. Mol Cell. .

Abstract

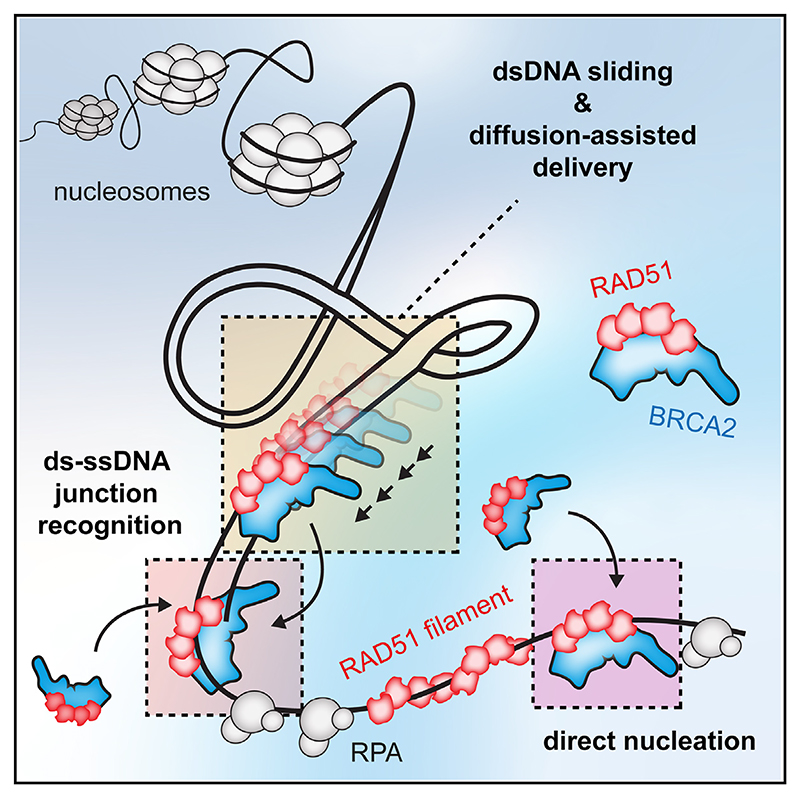
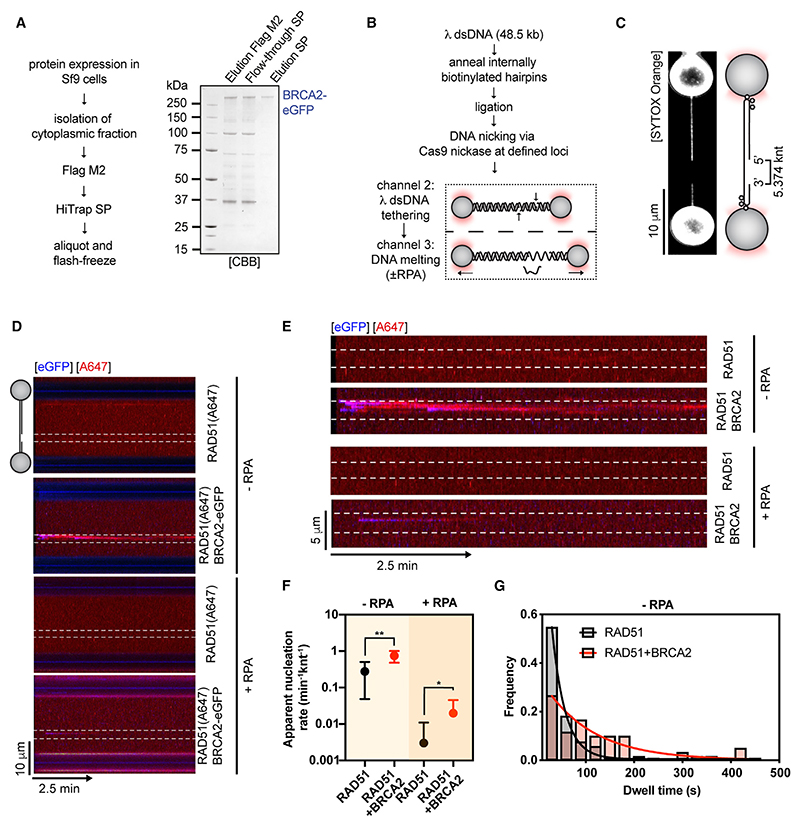
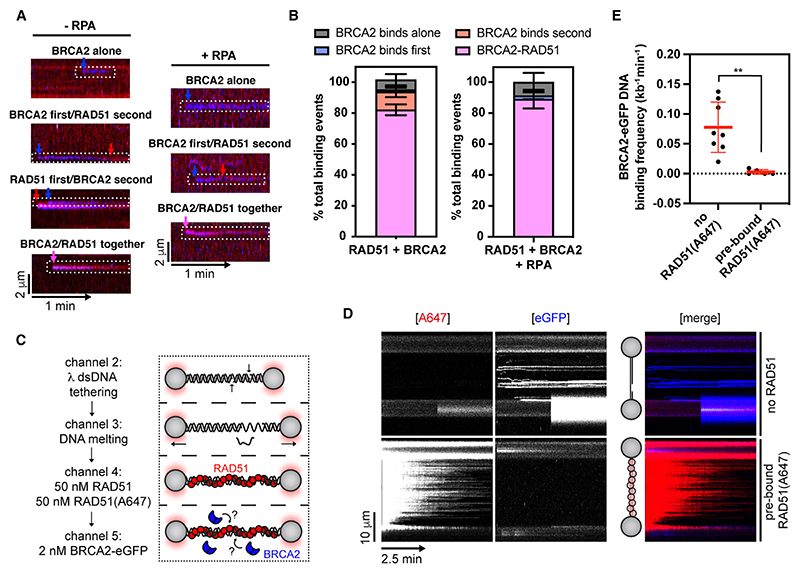
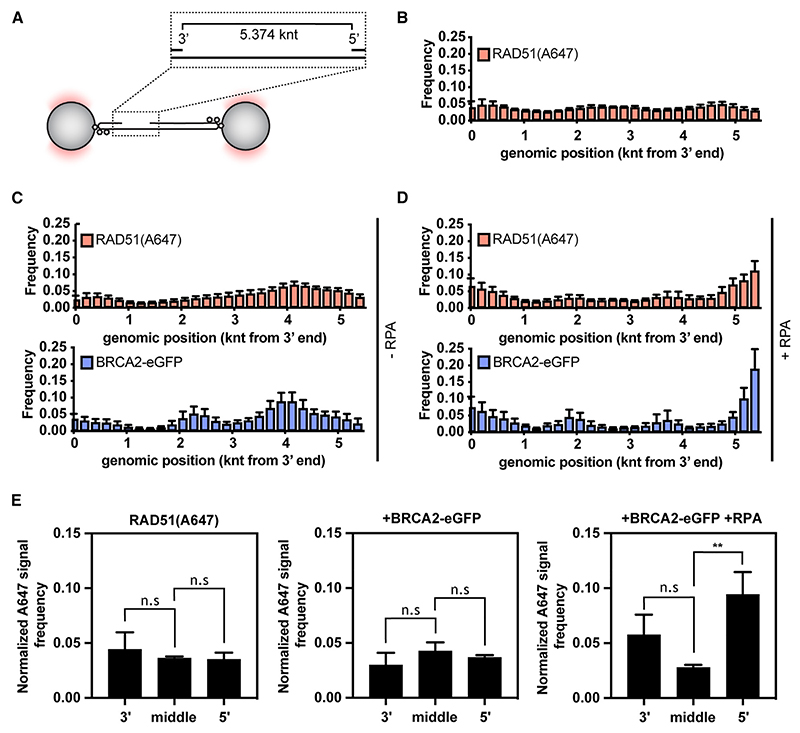
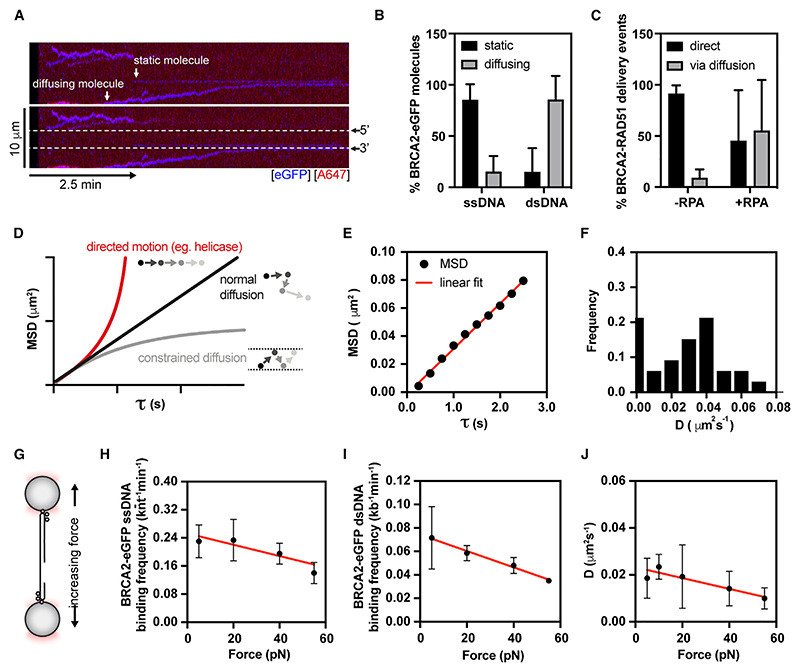
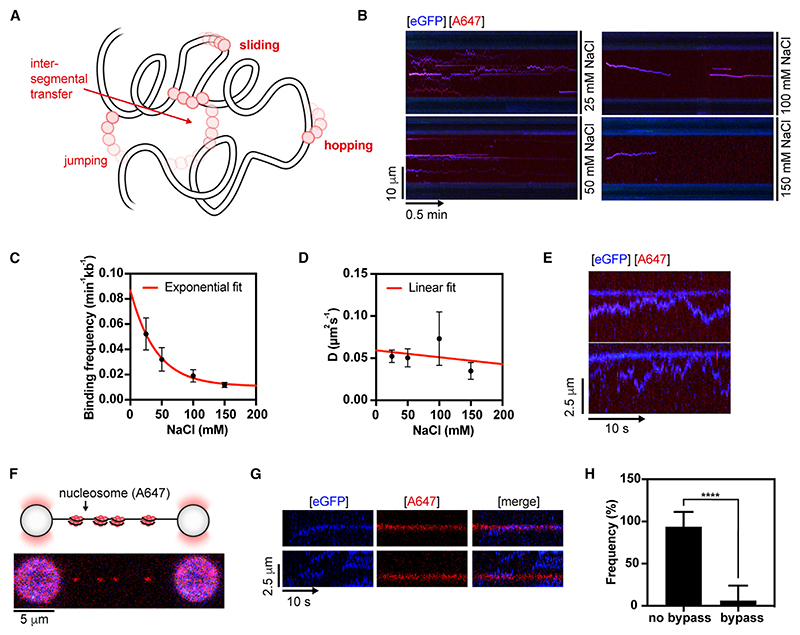
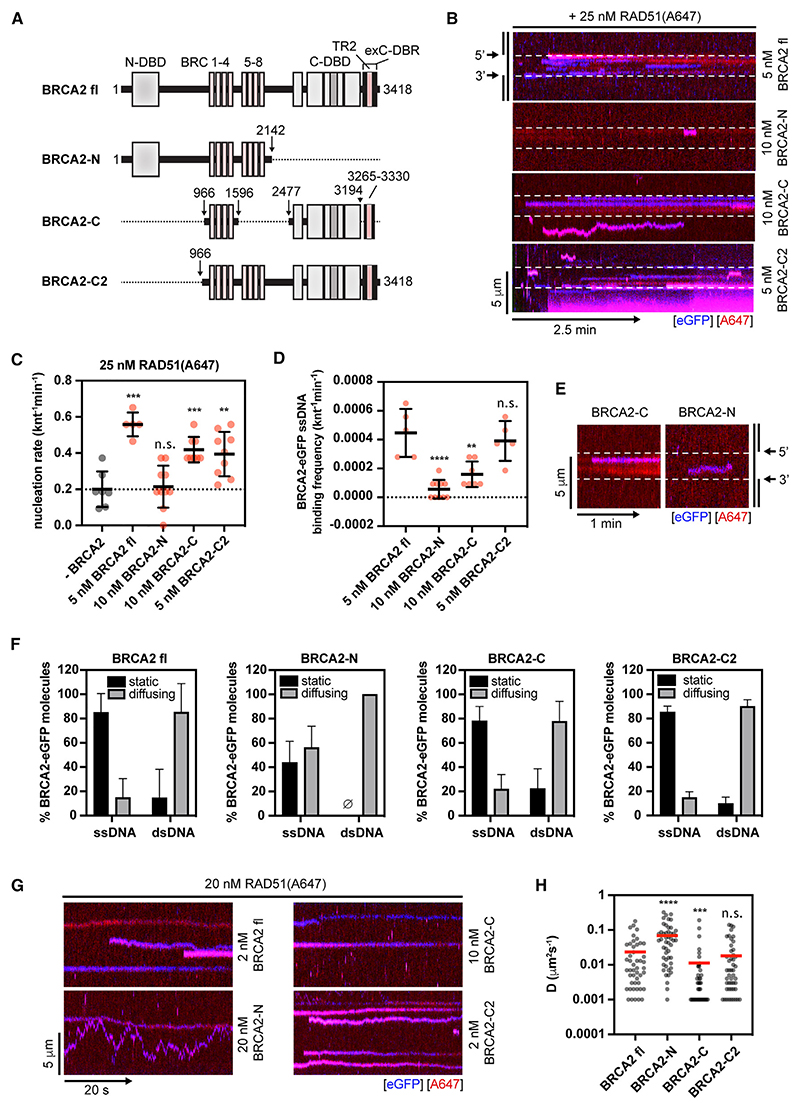
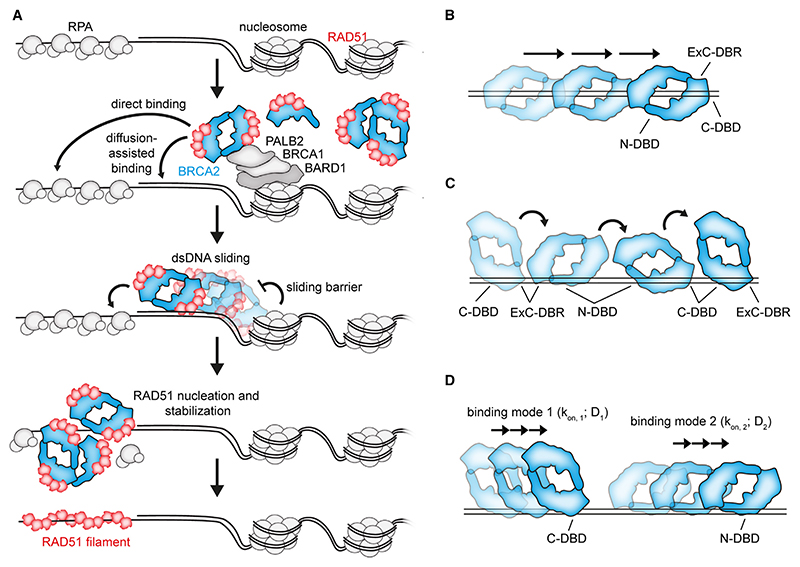
Homologous recombination (HR) is essential for error-free repair of DNA double-strand breaks, perturbed replication forks (RFs), and post-replicative single-stranded DNA (ssDNA) gaps. To initiate HR, the recombination mediator and tumor suppressor protein BRCA2 facilitates nucleation of RAD51 on ssDNA prior to stimulation of RAD51 filament growth by RAD51 paralogs. Although ssDNA binding by BRCA2 has been implicated in RAD51 nucleation, the function of double-stranded DNA (dsDNA) binding by BRCA2 remains unclear. Here, we exploit single-molecule (SM) imaging to visualize BRCA2-mediated RAD51 nucleation in real time using purified proteins. We report that BRCA2 nucleates and stabilizes RAD51 on ssDNA either directly or through an unappreciated diffusion-assisted delivery mechanism involving binding to and sliding along dsDNA, which requires the cooperative action of multiple dsDNA-binding modules in BRCA2. Collectively, our work reveals two distinct mechanisms of BRCA2-dependent RAD51 loading onto ssDNA, which we propose are critical for its diverse functions in maintaining genome stability and cancer suppression.

Keywords: BRCA2; DNA damage and repair; Rad51 filament formation; homologous recombination; single-molecule analysis; tumor suppressor protein.


Conflict of interest statement

Declaration of interests S.J.B. is a co-founder, VP Science Strategy, and a shareholder of Artios Pharma Ltd. S.J.B. is also a member of the advisory board of Molecular Cell.

Figures

Graphical abstract
Graphical abstract
Figure 1
Figure 1. Single-molecule imaging of RAD51 nucleation by full-length human BRCA2
(A) Purification of full-length human BRCA2-eGFP. (B) Schematic of the protocol used to generate gapped λ DNA (gDNA) substrates. (C) Representative image of an asymmetrically positioned ssDNA gap within λ DNA held at 10 pN force. (D) Kymograph showing the binding of 25 nM RAD51(A647) (red) to gDNA in the presence/absence of 5 nM BRCA2-eGFP (blue) and/or 1.25 nM RPA in the presence of 5 nM SYTOX Orange, 100 mM NaCl, 2 mM MgCl2, 1 mM CaCl2, and 2 mM ATP at ~5 pN force. Position of the ssDNA gap is indicated by dashed lines. (E) Zoom in on the ssDNA gap region from kymographs in (D). (F) Quantification of apparent RAD51(A647) nucleation rates in the indicated conditions (n = 5–21 molecules). Dots represent mean. Error bars represent SEM. p values by Student’s t test. n.s., p > 0.05; *p ≤ 0.05; **p ≤ 0.01. (G) Histograms of dwell times of RAD-51(A647) in the absence (N = 104 clusters) or presence of BRCA2-eGFP (N = 62 clusters). Lines represent exponential fits. See also Figure S1.
Figure 2
Figure 2. BRCA2 and RAD51 bind to DNA as a complex
(A) Examples of different orders of binding events observed for BRCA2-eGFP and RAD51(A647). (B) Quantification of different BRCA2-eGFP/RAD51(A647) binding events in the absence (n = 7 molecules, N = 76 events) or presence (n = 9 molecules, N = 29 events) of 1.25 nM RPA. Error bars represent SEM. (C) Schematic of RAD51 filament binding experiment, in which λ gDNA was pre-incubated with a 1:1 mixture of labeled and unlabeled RAD51 and then moved to a channel containing BRCA2-eGFP to monitor BRCA2 binding. (D) Kymographs showing the binding of 2 BRCA2-eGFP (blue) to gDNA or gDNA pre-coated with 50 nM RAD51 and 50 nM RAD51(A647) in the presence of 100 mM NaCl, 2 mM MgCl2, 1 mM CaCl2, and 2 mM ATP held at ~5 pN force. Position of the ssDNA gap is indicated. (E)Quantification of BRCA2 binding frequencies on λ gDNA or λ gDNA pre-coated with RAD51. Lines represent mean. Error bars represent SD. p values by Student’s t test. n.s., p > 0.05; *p ≤ 0.05; **p ≤ 0.01. See also Figure S2.
Figure 3
Figure 3. BRCA2 nucleates RAD51 at the edges of ssDNA gap in the presence of RPA
(A) Schematic of 5.374 knt-long ssDNA embedded within λ dsDNA. (B) Positional analysis of RAD51(A647) (red) binding along the length of 5.374 knt ssDNA gap. 200 nt bins. n = 5 molecules. Error bars represent SEM. 200 nt bins. (C) Position analysis of RAD51(A647) (red) or BRCA2-eGFP (blue) binding along the length of 5.374 knt ssDNA gap in the absence of RPA. n = 6 molecules. Error bars represent SEM. 200 nt bins. (D) Position analysis of RAD51(A647) (red) or BRCA2-eGFP (blue) binding along the length of 5.374 knt ssDNA gap in the presence of 1.25 nM RPA. n = 11 molecules. Error bars represent SEM. 200 nt bins. (E) Per-bin normalized A647 signal frequency for 3’ and 5’ ds-ssDNA junction (3 and 3 bins) or middle of the ssDNA gap (21 bins) in the indicated conditions. Error bars represent SEM. p values by Student’s t test. n.s., p > 0.05; *p ≤ 0.05; **p ≤ 0.01. See also Figure S2.
Figure 4
Figure 4. BRCA2 moves along dsDNA arms via normal diffusion
(A) A representative kymograph showing diffusion-driven delivery of BRCA2-RAD51 complexes to ssDNA in the vicinity of the ds-ssDNA junction. Static BRCA2-eGFP molecules bound directly to the ssDNA gap or mobile BRCA2-eGFP molecules diffusing along dsDNA are indicated by arrows. 25 nM RAD51(A466) (red) was incubated with gDNA in the presence of 5 nM BRCA2-eGFP (blue) and 1.25 nM RPA in the presence of 5 nM SYTOX Orange. Position of the ssDNA gap is indicated by dashed lines. (B) Fraction of diffusive or static BRCA2-eGFP molecules on ss-(n = 9) or dsDNA (n = 15). Error bars represent SD. (C) Relative contribution of diffusion-assisted RAD51 delivery to RAD51 accumulation at the ssDNA gap in the presence (n = 15) or absence of RPA (n = 10). Error bars represent SD. (D) Mean square displacement (MSD) as a function of tau to estimate the mode of particle movement from the shape of the curve. (E) An example of MSD analysis of a moving BRCA2-eGFP molecule on dsDNA showing a linear relationship/normal diffusion. (F) Diffusion coefficient (D) calculated from MSD analysis for BRCA2-RAD51 complexes moving on dsDNA. 2 nM BRCA2-eGFP, 20 nM RAD51(A647), 10 pN force, 25 mM NaCl, 2 mM MgCl2, and 2 mM ATP. Bin size = 0.01 mm2s−1. N = 33 molecules. (G) Schematic of the force-pulling experiment, where the position of an optical trap is changed to exert tension on gDNA. (H) ssDNA-binding frequency of BRCA2-eGFP as a function of force. 2 nM BRCA2-eGFP, 20 nM RAD51(A647). 100 mM NaCl, 2 mM MgCl2, 1 mM CaCl2, and 2 mM ATP. Red line represents linear regression. Error bars represent SEM. n = 2–6 molecules. (I) dsDNA-binding frequency of BRCA2-eGFP as a function of force. 2 nM BRCA2-eGFP, 20 nM RAD51(A647). 100 mM NaCl. Red line represents linear regression. Error bars represent SEM. n = 3–6 molecules. (J) Diffusion coefficient of BRCA2-eGFP as a function of force. 2 nM BRCA2-eGFP, 20 nM RAD51(A647). 50 mM NaCl, 2 mM MgCl2, and 2 mM ATP. Red line represents linear regression. Error bars represent SEM. N = 36–50 molecules. See also Figure S3.
Figure 5
Figure 5. BRCA2 moves by sliding along dsDNA backbone
(A) Target search models for DNA-binding proteins. Increasing ionic strength increases the diffusion coefficient during hopping but not sliding. (B) Representative kymographs demonstrating diffusion of BRCA2-RAD51 complex along λ dsDNA at 10 pN at the indicated salt concentrations. 2 nM BRCA2-eGFP (blue), 20 nM RAD51(A647) (red). (C) Binding frequency (n = 9–11) calculated for BRCA2-RAD51 complexes as a function of salt concentration. Error bars represent SEM. (D) Corrected diffusion coefficient (N = 8–24, exclusion of fraction in 0.01 mm2s−1 bin) calculated for BRCA2-RAD51 complexes as a function of salt concentration. Error bars represent SEM. (E) Representative kymographs demonstrating collision between fast-moving and slow-moving BRCA2-RAD51 complex along λ dsDNA held at 10 pN force. 2 nM BRCA2-eGFP (blue), 20 nM RAD51(A647) (red), 50 mM NaCl, 2 mM MgCl2, and 2 mM ATP. (F) Sparsely chromatinized λ DNA substrate (F = 5 pN). Nucleosomes are fluorescently labeled on H4-E63C with Alexa Fluor 647. (G) Representative kymographs showing BRCA2/RAD51 complex collisions with labeled nucleosomes. 2 nM BRCA2-eGFP (blue), 20 nM RAD51 (dark), labeled nucleosomes in red. F = 5 pN. 50 mM NaCl, 2 mM MgCl2, and 2 mM ATP. (H) Frequency of collision outcomes for BRCA2-eGFP/RAD51 complexes with labeled nucleosomes on individual chromatinized γ DNA molecules (n = 8). BRCA2 cannot bypass a nucleosome barrier, indicating a tight association with dsDNA during sliding. Error bars represent SD. p values by Student’s t test. n.s., p > 0.05; *p ≤ 0.05; **p ≤ 0.01; ***p ≤ 0.001; ****p ≤ 0.0001. See also Figure S4.
Figure 6
Figure 6. Analysis of BRCA2 mutants
(A) A schematic of full-length BRCA2 and deletion mutants. DNA and RAD51 interaction sites are shown. Dotted line represents deleted regions. (B) Representative kymograph showing the binding of 25 nM RAD51(A466) (red) to λ gDNA in the presence/absence of the indicated concentration of full-length (fl) BRCA2 or mutants fused to eGFP (blue) in the presence of 5 nM SYTOX Orange, 100 mM NaCl, 2 mM MgCl2, 1 mM CaCl2, and 2 mM ATP at 15 pN force. Position of the ssDNA gap is indicated by dashed lines. (C) Quantification of apparent RAD51(A647) nucleation rates in the first 120 s of imaging in the indicated conditions. Error bars represent SD. p values by Student’s t test. (D) ssDNA-binding frequency of BRCA2-eGFP fl and mutants in the first 120 s window at indicated concentrations in the presence of 20 nM RAD51(A647), 100 mM NaCl, 2 mM MgCl2, 1 mM CaCl2, and 2 mM ATP. Error bars represent SD. p values by Student’s t test. (E) Representative kymograph demonstrating the unstable (mobile) nature of BRCA2-N binding to ssDNA. (F) Fraction of diffusive or static BRCA2-eGFP molecules for different constructs on ss- (n = 8 for BRCA2-N, n = 11 for BRCA2-C, and n = 11 for BRCA2-C2) or dsDNA (n = 2 for BRCA2-N, n = 6 for BRCA2-C, and n = 8 for BRCA2-C2). Error bars represent SEM. Data for BRCA2 fl are the same as in Figure 4B. (G) Representative kymographs showing BRCA2 fl/RAD51, BRCA2-C/RAD51, or BRCA2-N/RAD51 complex diffusion on dsDNA. BRCA2-eGFP concentration is indicated (blue) and 20 nM RAD51 (red). F = 10 pN. 50 mM NaCl, 2 mM MgCl2, and 2 mM ATP. (H) Diffusion coefficient (D) calculated from MSD analysis for BRCA2 fl or mutant-RAD51 complexes moving on dsDNA. BRCA2-eGFP concentration is indicated, 20 nM RAD51(A647), 10 pN force, 50 mM NaCl, 2 mM MgCl2, and 2 mM ATP. N = 48–60 molecules. Mann-Whitney test. Red line represents mean. (C–I) n.s., p > 0.05; *p ≤ 0.05; **p ≤ 0.01; ***p ≤ 0.001; ****p ≤ 0.0001. See also Figure S5.
Figure 7
Figure 7. Model for RAD51 nucleation and dsDNA sliding by human BRCA2
(A) BRCA2-RAD51 complex is recruited to the proximity of DSBs. BRCA2 then either nucleates RAD51 directly on RPA-coated ssDNA or slides on the dsDNA arm. During sliding, proximal nucleosomes serve as a diffusion barrier, restricting the sliding of BRCA2 toward resected RPA-coated ssDNA. RAD51 is nucleated and stabilized on ssDNA by BRCA2 and grows into a filament. (B) A hypothetical model of BRCA2 sliding via dsDNA passing through a central channel within the BRCA2 structure. (C) A hypothetical model of BRCA2 sliding via multivalent dsDNA interactions, where dsDNA is shuttled between the different BRCA2 DNA-binding modules. (D) A hypothetical model of BRCA2 sliding on dsDNA via individual DNA-binding modules with different sliding rates and DNA affinities. A mixed mode of movement, where hopping has a contribution, is also possible. (A–D) For simplicity, BRCA2 is shown as a dimer. However, BRCA2 could engage in the proposed sliding mechanisms in monomeric form or as a heterogeneous oligomer.

References

    1. Chapman JR, Taylor MR, Boulton SJ. Playing the end game: DNA double-strand break repair pathway choice. Mol Cell. 2012;47:497–510. doi: 10.1016/j.molcel.2012.07.029. - DOI - PubMed
    1. Carreira A, Kowalczykowski SC. Two classes of BRC repeats in BRCA2 promote RAD51 nucleoprotein filament function by distinct mechanisms. Proc Natl Acad Sci USA. 2011;108:10448–10453. doi: 10.1073/pnas.1106971108. - DOI - PMC - PubMed
    1. Carreira A, Hilario J, Amitani I, Baskin RJ, Shivji MK, Venkitaraman AR, Kowalczykowski SC. The BRC repeats of BRCA2 modulate the DNA-binding selectivity of RAD51. Cell. 2009;136:1032–1043. doi: 10.1016/j.cell.2009.02.019. - DOI - PMC - PubMed
    1. Davies AA, Masson JY, McIlwraith MJ, Stasiak AZ, Stasiak A, Venkitaraman AR, West SC. Role of BRCA2 in control of the RAD51 recombination and DNA repair protein. Mol Cell. 2001;7:273–282. doi: 10.1016/s1097-2765(01)00175-7. - DOI - PubMed
    1. Yang H, Jeffrey PD, Miller J, Kinnucan E, Sun Y, Thoma NH, Zheng N, Chen PL, Lee WH, Pavletich NP. BRCA2 function in DNA binding and recombination from a BRCA2-DSS1-ssDNA structure. Science. 2002;297:1837–1848. doi: 10.1126/science.297.5588.1837. - DOI - PubMed

Publication types