. 2023 Aug 21;33(16):3398-3408.e7.
doi: 10.1016/j.cub.2023.06.086. Epub 2023 Jul 26.

VIP interneurons in sensory cortex encode sensory and action signals but not direct reward signals

Affiliations

VIP interneurons in sensory cortex encode sensory and action signals but not direct reward signals

Deepa L Ramamurthy et al. Curr Biol. .

Abstract

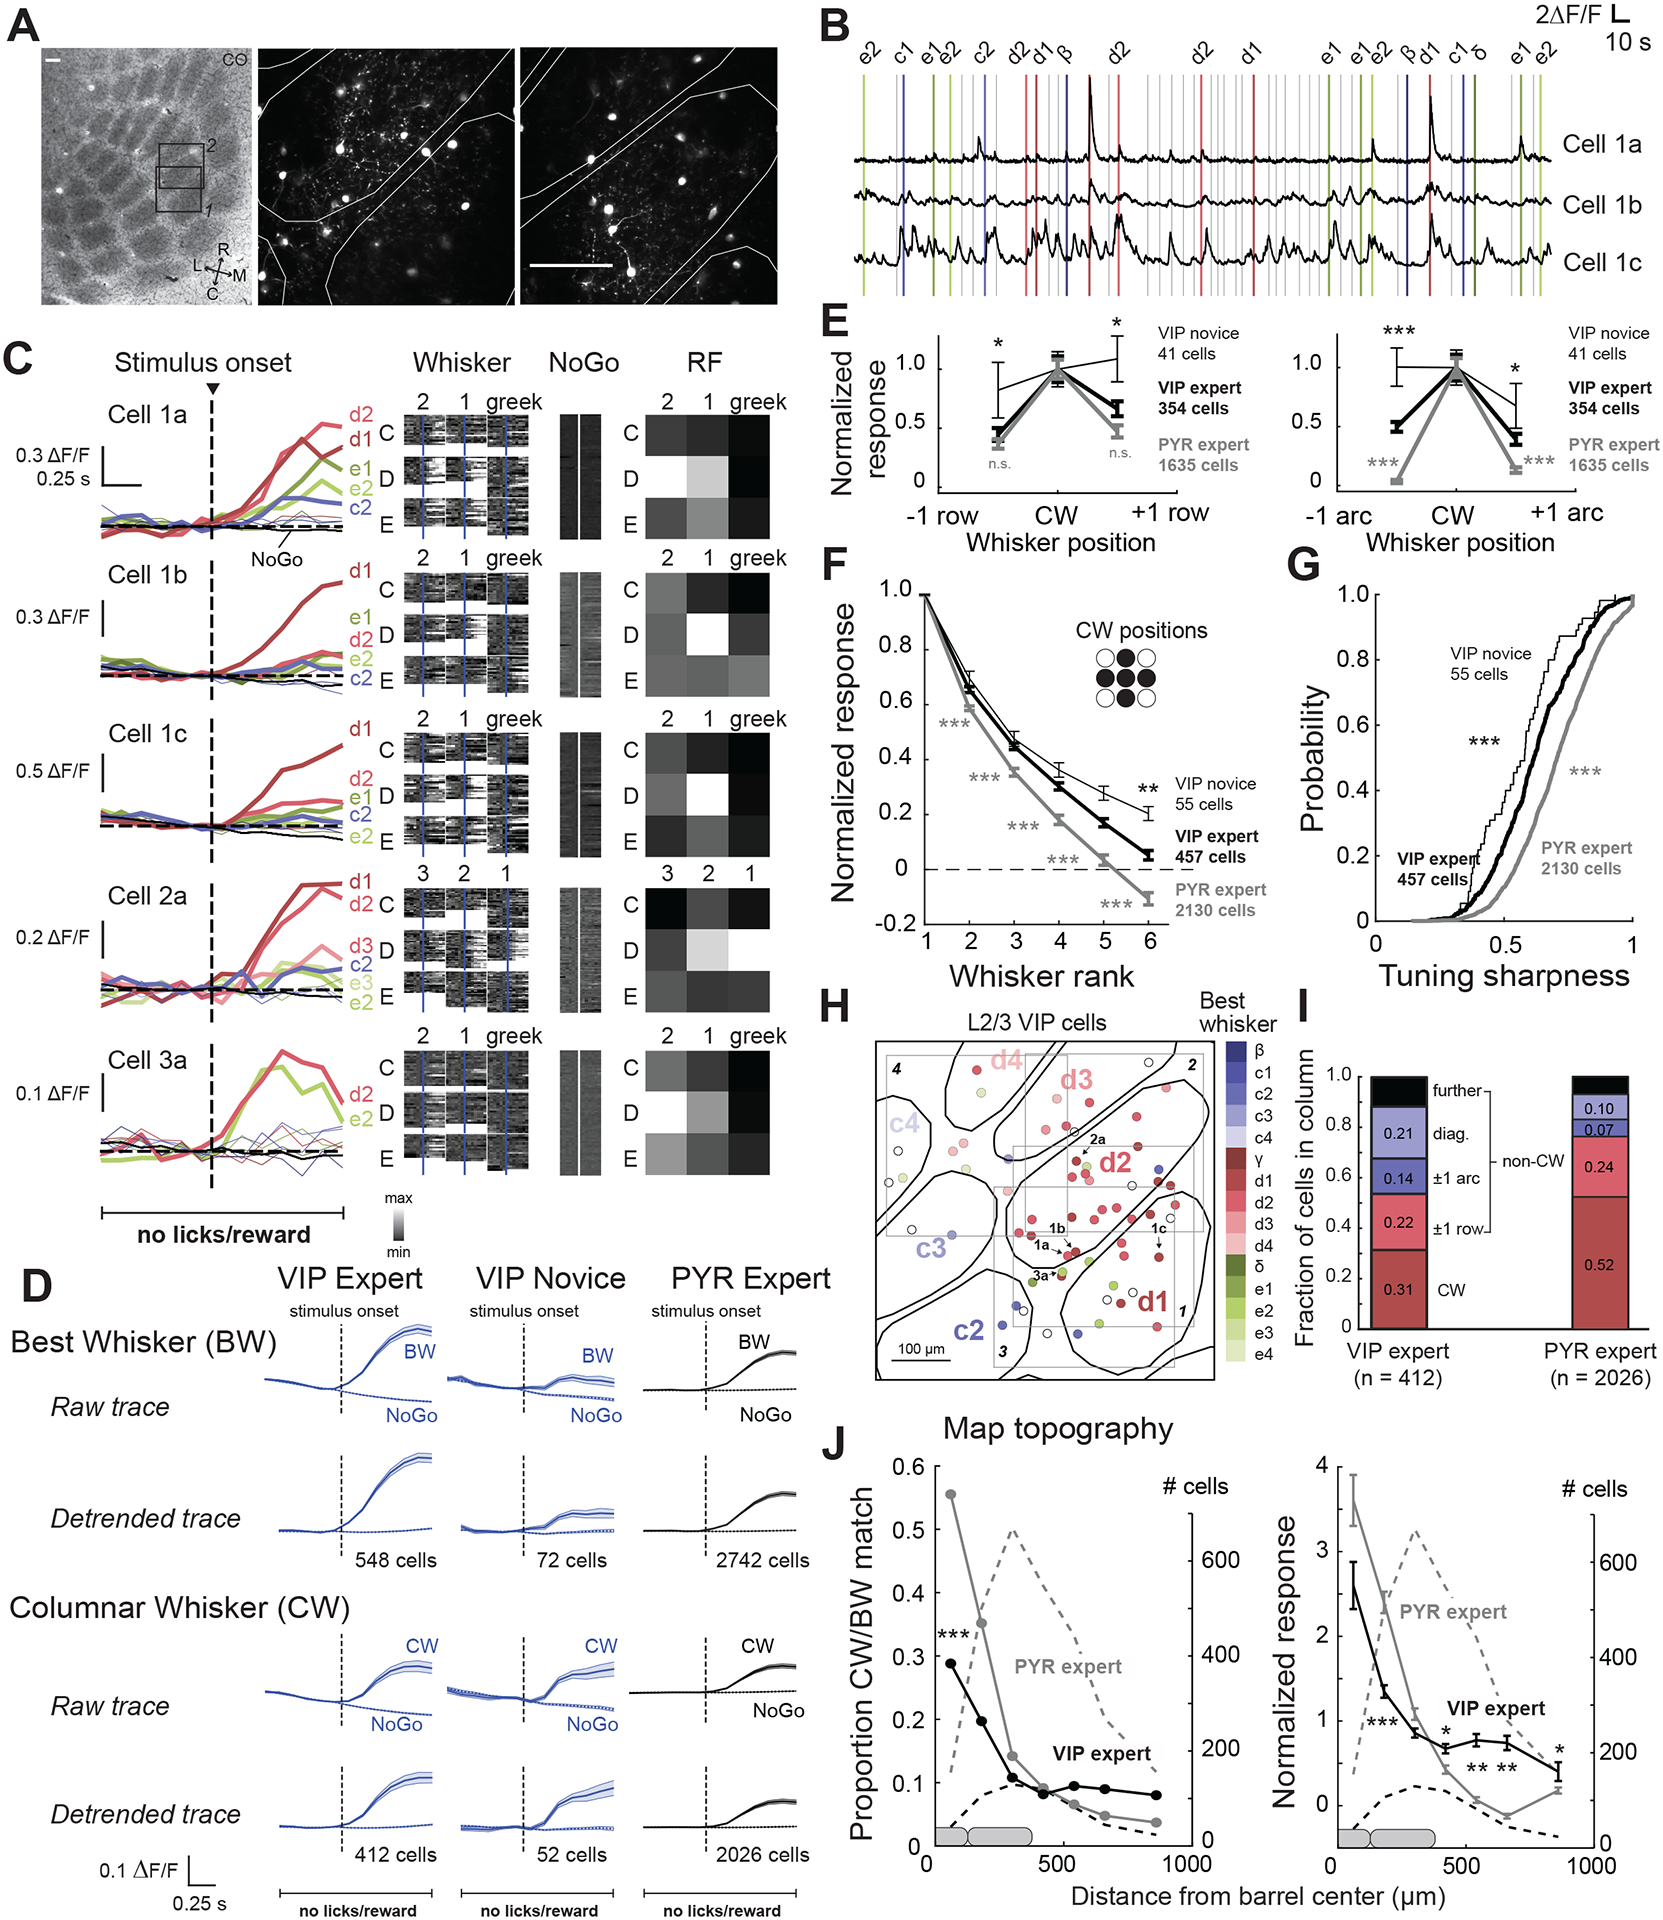
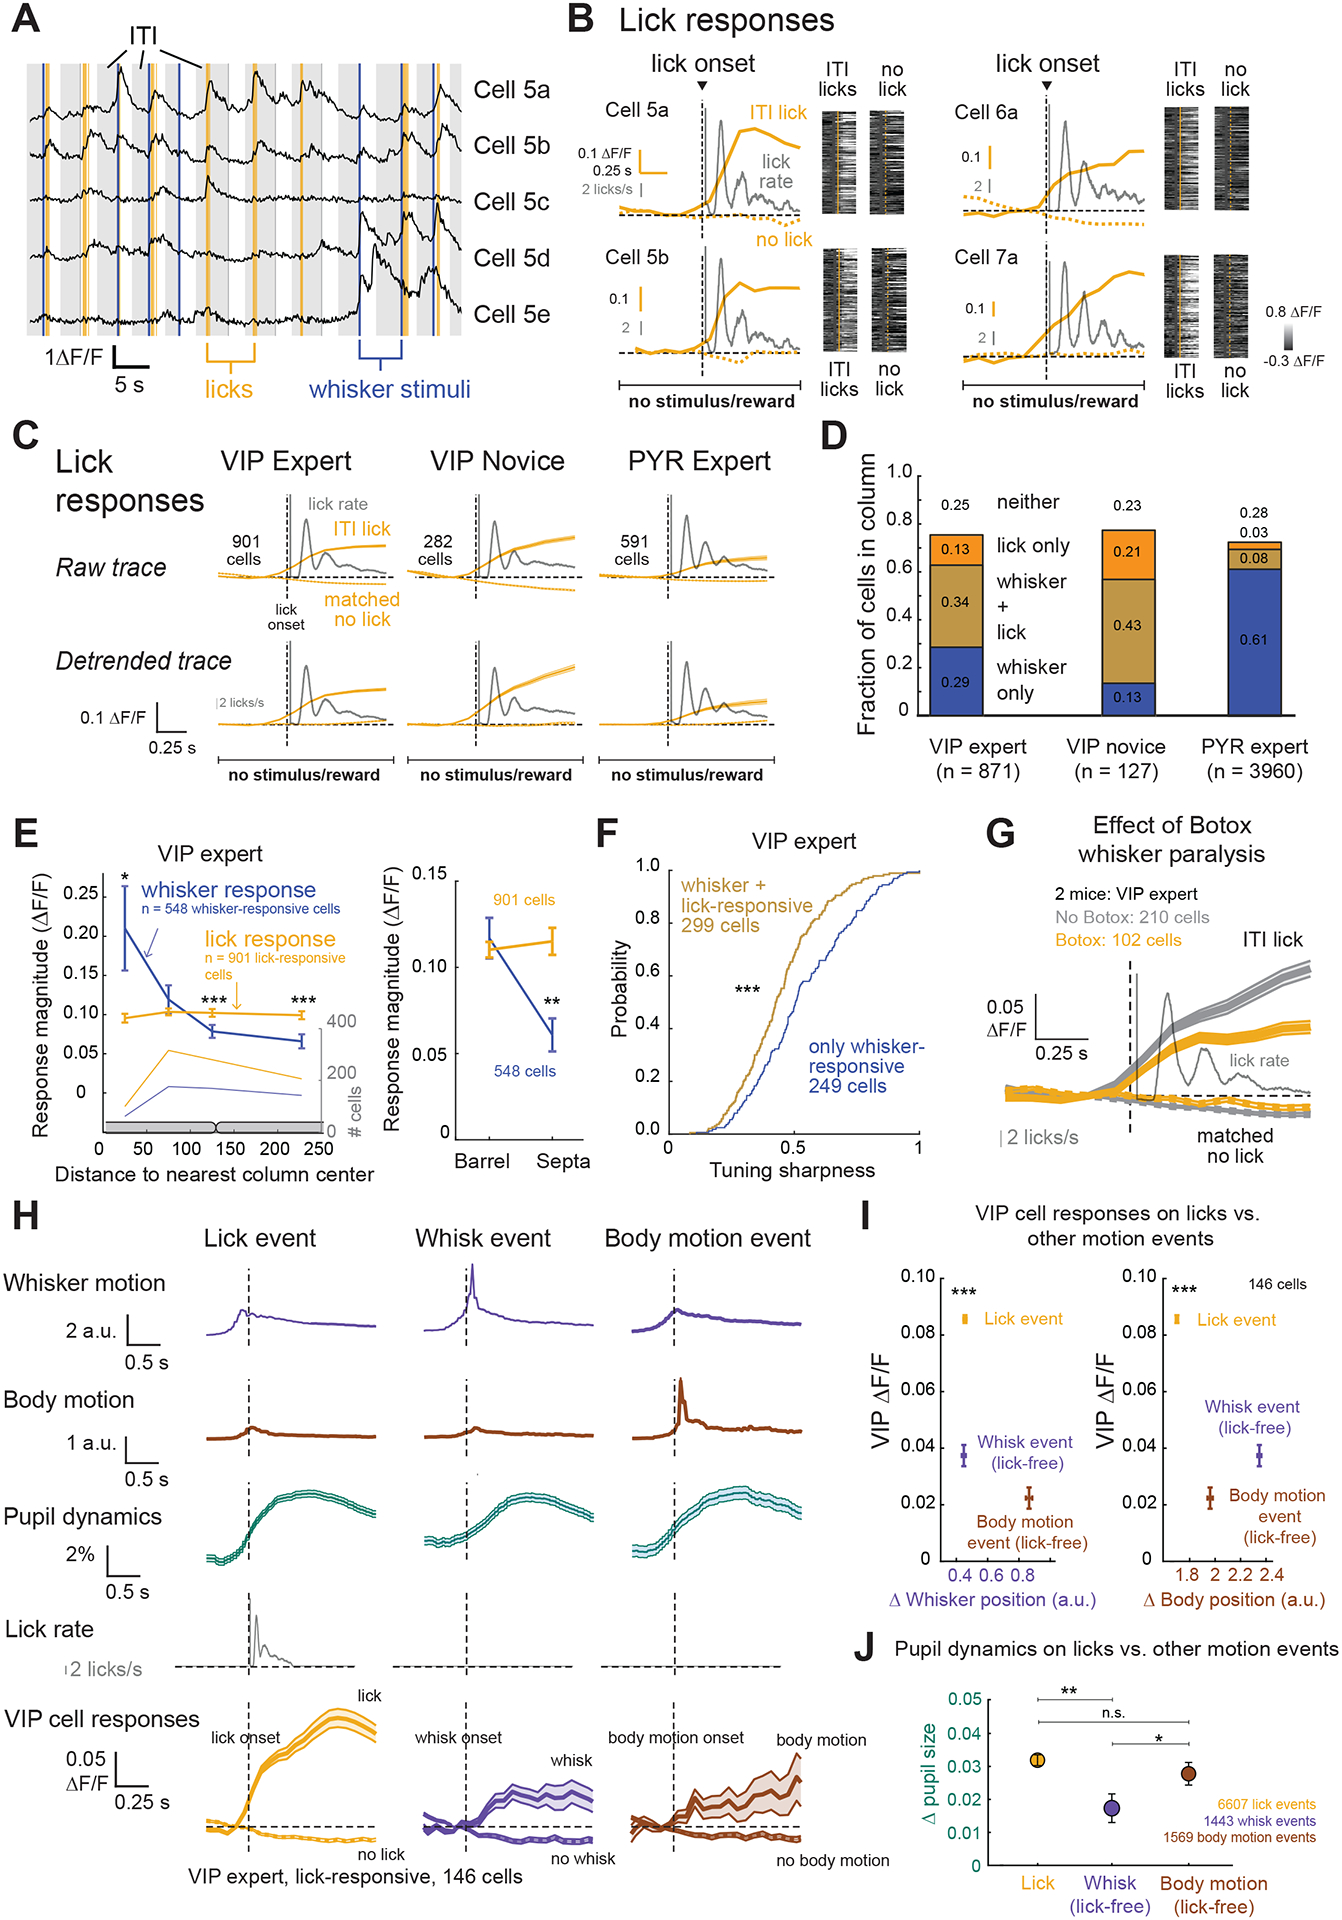
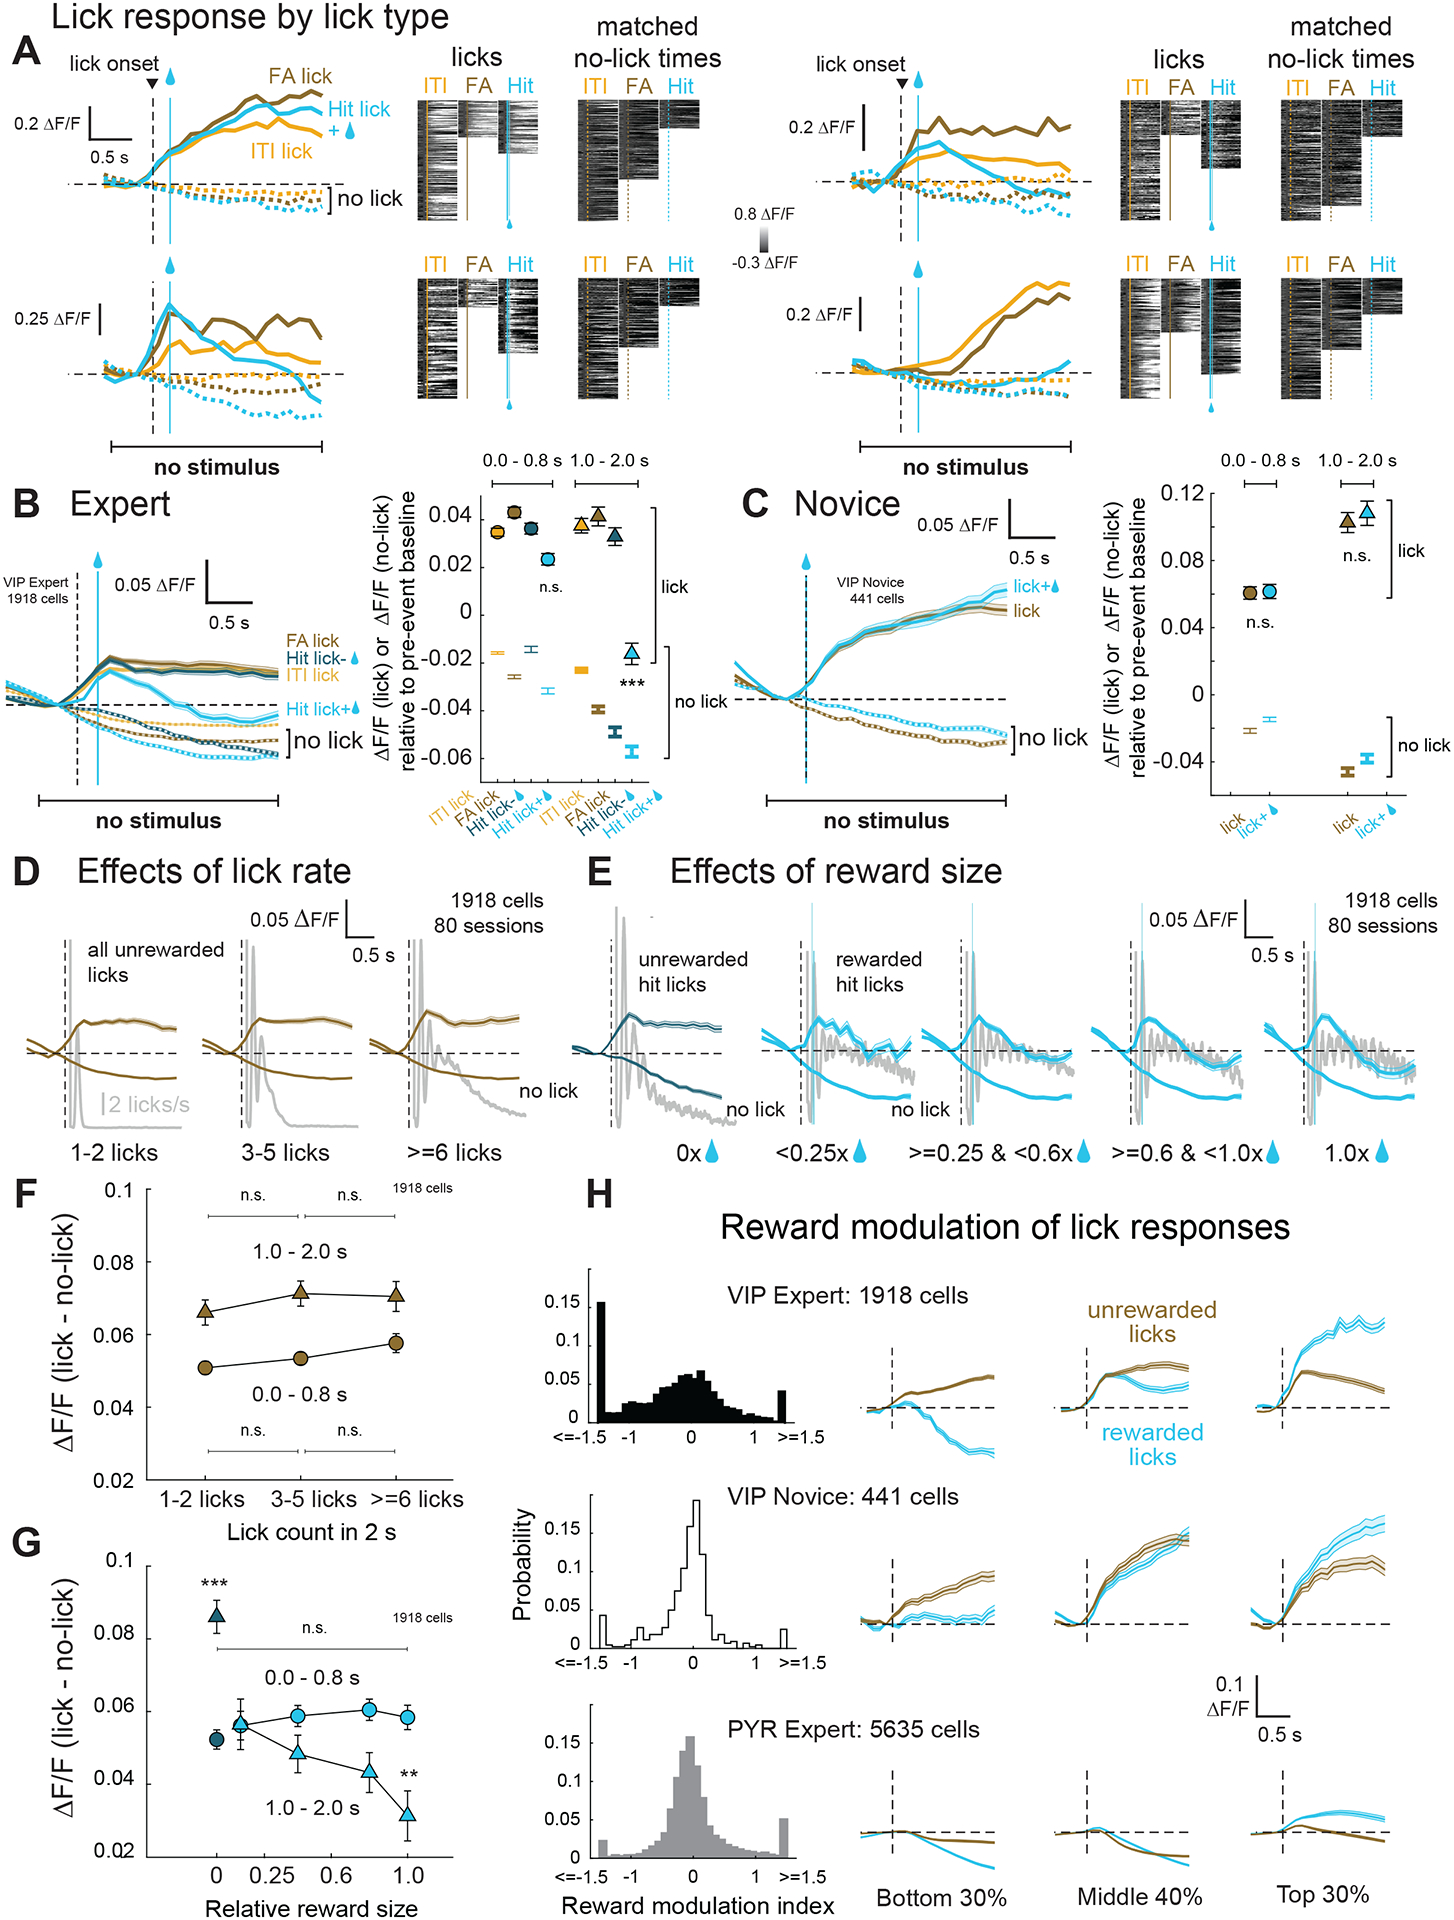
Vasoactive intestinal peptide (VIP) interneurons in sensory cortex modulate sensory responses based on global exploratory behavior and arousal state, but their function during non-exploratory, goal-directed behavior is not well understood. In particular, whether VIP cells are activated by sensory cues, reward-seeking actions, or directly by reinforcement is unclear. We trained mice on a Go/NoGo whisker touch detection task that included a delay period and other features designed to separate sensory-evoked, action-related, and reward-related neural activity. Mice had to lick in response to a whisker stimulus to receive a variable-sized reward. Using two-photon calcium imaging, we measured ΔF/F responses of L2/3 VIP neurons in whisker somatosensory cortex (S1) during behavior. In both expert and novice mice, VIP cells were strongly activated by whisker stimuli and goal-directed actions (licking), but not by reinforcement. VIP cells showed somatotopic whisker tuning that was spatially organized relative to anatomical columns in S1, unlike lick-related signals which were spatially widespread. In expert mice, lick-related VIP responses were suppressed, not enhanced, when a reward was delivered, and the amount of suppression increased with reward size. This reward-related suppression was not seen in novice mice, where reward delivery was not yoked to licking. These results indicate that besides arousal and global state variables, VIP cells are activated by local sensory features and goal-directed actions, but not directly by reinforcement. Instead, our results are consistent with a role for VIP cells in encoding the expectation of reward associated with motor actions.

Keywords: GABAergic neurons; barrel cortex; goal-directed behavior; sensory maps; vibrissa.


Conflict of interest statement

Declaration of interests The authors declare no competing interests.

Figures

Figure 1.
Figure 1.. Whisker detection task with a delay period.
A. Behavioral setup for head-fixed mice. B. Trial types and behavioral outcomes. Hits were rewarded, while miss, correct rejection and false alarm trials were neither rewarded nor punished. C. Trial structure. Either a short or a long delay period separated stimulus presentation from the response window. Blue trace shows reward size, which varied based on time of first response lick. Windows for image analysis were aligned to (1) stimulus onset, (2) first lick in the response window and (3) first lick for each lick bout in the intertrial interval. D. Median time of first lick across all imaging sessions, for each mouse. Bullseye is the median across sessions. Small circles are outliers (> 1.5 x interquartile range). E. Number of sessions (after initial acclimation) to reach expert performance, for mice trained with short or long delay periods. F–H. Hit and false alarm rates (F), mean d-prime (G), and fraction of trials aborted due to early licks (H) across imaging sessions for expert mice. Gray boxes, ±SEM; open boxes, ±SD. I. Cumulative distributions of reward size (fraction of maximum reward) obtained per hit trial by each mouse. Mice obtained an average of ~45% of the maximum reward across trials and obtained the maximum reward on ~16% of trials per session. J. Experimental design showing number of mice per imaging condition. See also Video S1.
Figure 2.
Figure 2.. Sensory-evoked activity of VIP interneurons.
A. Two L2/3 imaging fields from a VIP-Cre; Ai162D mouse, localized relative to CO-stained barrels in L4. White contours are column boundaries. B. ΔF/F traces from 3 VIP cells from one field. Bars show time of whisker deflections on Go trials (color-coded by whisker identity) or NoGo trials (gray bars), which contained dummy piezo movement but no whisker deflection. C. Whisker receptive fields for 5 VIP cells, including those in (B). Left, median ΔF/F trace for each whisker (color) and dummy (NoGo) stimulus (gray). Middle, ΔF/F traces for each trial for each stimulus type. Right, Normalized response magnitude across whiskers. D. Mean whisker stimulus-aligned ΔF/F trace for all VIP and PYR cells with significant whisker responses. For columnar whisker responses, cells located in septa were excluded. Detrended traces were linearly detrended by prestimulus baseline (0.666 s). Error bars show mean±SEM. E. Mean responses to CW and same-row or same-arc surround whisker (SWs), for all whisker-responsive cells for which the CW and at least 5 SWs were tested. F. Mean rank-ordered receptive field for all whisker-responsive cells. Same data as (E). G. Distribution of tuning sharpness, calculated as (RBW−RW)/(RBW + RW), where RBW = mean ΔF/F to BW, and RW = mean ΔF/F for all other whiskers. Same data as (E) and (F). H. VIP cells from 4 imaging fields in one mouse. Color indicates best whisker, open circles are non-whisker responsive. Arrows, example cells from (B) & (C). I. Identity of best whiskers for cells located within a barrel column (septal cells excluded). J. Proportion of cells tuned to a reference whisker, as a function of distance from the reference whisker column. Dashed lines, cell count in each spatial bin. K. Same, but showing mean response to a reference whisker. See also Figure S1 and Table S1.
Figure 3.
Figure 3.. Lick-related activity of VIP interneurons.
A. Example ΔF/F traces from 5 VIP cells in one imaging field, aligned to whisker deflection (blue), dummy piezo movement on NoGo trials (gray), and licks (yellow). Light gray is intertrial interval (ITI). B. Lick-related activity for 4 VIP cells. Left, median ΔF/F trace for licks and matched no-lick times, overlaid on lick time histogram (gray; 1 ms bins, smoothed by 50 ms moving average). Right, ΔF/F traces for each trial aligned to lick events (yellow) and matched no-lick times (gray). C. Mean ΔF/F trace for all cells with significant lick-related activity, aligned to lick bout onset and matched no-lick times. Detrended traces were linearly detrended from the prestimulus baseline (0.666 s). Lick time histogram (gray) plotted as in (B). Error bars show mean ± SEM for all panels. D. Proportion of L2/3 VIP cells that were whisker-responsive, lick-responsive, or neither. E. Left, mean whisker-evoked and lick-evoked response (ΔF/F) of VIP cells as a function of cell location from the nearest column center. Right, Same, averaged across all cells in barrel column vs. septa compartments. F. Tuning sharpness for solely whisker-responsive, or whisker- and lick-responsive cells. G. Mean ΔF/F trace aligned to lick onset and no-lick times for VIP cells during Botox sessions and non-Botox sessions in the same mice. Thin trace is lick time histogram. H. Mean change in whisker position, body position and pupil size, across lick events, spontaneous whisk events and spontaneous body motion events. Bottom, mean ΔF/F trace for all VIP cells with significant lick-related activity in sessions with DeepLabCut tracking, aligned to lick events, spontaneous whisk events, or spontaneous body motion events. I. Magnitude of VIP activity evoked by lick vs. whisk or body motion events, plotted relative to mean change in whisker position (left) or body position (right) within the response analysis window. J. Mean change in pupil size (0–0.799 s window) following lick events, vs. spontaneous whisking or body motion events with matched magnitude of whisker/body motion. See also Figure S2 and Table S1.
Figure 4.
Figure 4.. Reward modulation of VIP interneuron activity.
A. Lick- and reward-related activity for 4 VIP cells. Left, median ΔF/F trace for different licks and matched no-lick times. Right, ΔF/F traces for each trial aligned to lick times or matched no-lick times. Blue bar, median time of reward on Hit trials. B. Left, mean ΔF/F trace across VIP cells in expert mice aligned to lick onset for different types of licks, or matched no-lick times. Rewarded licks on Hit trials are light blue, and licks on unrewarded Hit trials are dark blue. Error bars show mean ±SEM for all panels. Right, mean ΔF/F magnitude within early and late windows following lick bout onset (<0.8 s, circles; 1 – 2 s, triangles). Matched no-lick activity for each lick type is shown as a markerless error bar in the corresponding color. C. Same as (B), but for novice mice, where spontaneous licks were rewarded randomly. D. Relationship of VIP cell activity to lick rate in expert mice. Mean ΔF/F traces are aligned to lick onset, for trials with different numbers of licks, and with no licks. Gray shows lick time histogram, plotted as in Fig. 3B. E. Relationship of VIP cell activity to reward size in expert mice. Mean ΔF/F traces are aligned to lick onset or matched no-lick times, for trials with different reward sizes (expressed as fraction of maximum reward size). 0x represents unrewarded hits. F. Quantification of effects in (D) during early (<0.8 s; circles) and late (1–2 s; triangles) windows. The y-axis is the difference between lick and no-lick ΔF/F in Panel B. G. Quantification of effects in (E). Dark blue, unrewarded hits, light blue, rewarded hits. H. Distribution of reward modulation index (RMI) for VIP and PYR cells. RMI was calculated from baseline-detrended traces as the difference in late window (1.0 – 2.0 s) lick-evoked activity between rewarded and unrewarded licks, divided by the absolute value of their sum: RMI = (ΔF/F rewarded - ΔF/F unrewarded)/|ΔF/F rewarded + ΔF/F unrewarded|. To visualize reward modulation, we plot average lick-evoked ΔF/F traces (after subtracting no-lick traces) on rewarded vs. non-rewarded trials. Left, center and right columns are cells with RMI values in the bottom 30%, middle 40% and top 30% of the population. See also Figure S3 and Table S1.

Comment in

References

    1. Tremblay R, Lee S, Rudy B (2016). GABAergic Interneurons in the Neocortex: From Cellular Properties to Circuits. Neuron 91:260–292. - PMC - PubMed
    1. Pfeffer CK, Xue M, He M, Huang ZJ, Scanziani M (2013). Inhibition of inhibition in visual cortex: the logic of connections between molecularly distinct interneurons. Nature neuroscience 16:1068–1076. - PMC - PubMed
    1. Lee S, Kruglikov I, Huang ZJ, Fishell G, Rudy B (2013). A disinhibitory circuit mediates motor integration in the somatosensory cortex. Nat Neurosci 16:1662–1670. - PMC - PubMed
    1. Fu Y, Tucciarone JM, Espinosa JS, Sheng N, Darcy DP, Nicoll RA, Huang ZJ, Stryker MP (2014). A cortical circuit for gain control by behavioral state. Cell 156:1139–1152. - PMC - PubMed
    1. Pi HJ, Hangya B, Kvitsiani D, Sanders JI, Huang ZJ, Kepecs A (2013). Cortical interneurons that specialize in disinhibitory control. Nature 503:521–524. - PMC - PubMed

Publication types

Substances