. 2023 Oct 1;18(10):1272-1282.
doi: 10.2215/CJN.0000000000000239. Epub 2023 Jul 27.

Early Risk Stratification for Natural Disease Course in Fabry Patients Using Plasma Globotriaosylsphingosine Levels

Affiliations

Early Risk Stratification for Natural Disease Course in Fabry Patients Using Plasma Globotriaosylsphingosine Levels

Sanne J van der Veen et al. Clin J Am Soc Nephrol. .

Abstract

Background: Fabry disease is a very heterogeneous X-linked lysosomal storage disease. Disease manifestations in the kidneys, heart, and brain vary greatly, even between patients of the same sex and with the same disease classification (classical or nonclassical). A biomarker with a strong association with the development of disease manifestations is needed to determine the need for Fabry-specific treatment and appropriate frequency of follow-up because clinical manifestations of the disorder may take decennia to develop.

Methods: We investigated the levels of plasma lysoGb3 levels over time and its association with disease manifestations and disease course in 237 untreated patients with Fabry disease (median age 42 years, 38% male) using linear mixed-effect models.

Results: LysoGb3 levels are stable over time in plasma of untreated patients with Fabry disease. Higher levels of lysoGb3 were associated with steeper decline in eGFR ( P = 0.05) and a faster increase in albuminuria (measured as the urinary albumin-to-creatinine ratio, P < 0.001), left ventricular mass (measured on echocardiography, P < 0.001), left atrial volume index ( P = 0.003), and Fazekas score ( P = 0.003). In addition, regardless of age, higher lysoGb3 levels were associated with higher relative wall thickness ( P < 0.001) and unfavorable functional markers on echocardiography, including septal mitral annular early diastolic velocity (e', P < 0.001) and the ratio of early transmitral velocity (E) to e' (E/e', P = 0.001).

Conclusions: In an individual patient with Fabry disease, the plasma lysoGb3 level reached a specific level in early childhood which, in the absence of Fabry-specific treatment, remained stable throughout life. The level of lysoGb3 in untreated patients was associated with nearly all Fabry-specific disease manifestations, regardless of the sex of the patient.


Conflict of interest statement

M.M. Brands reports research funding from Intrabio and serving as principal investigator at the Amsterdam site for the study: N-Acetyl-L-Leucine for Niemann-Pick Disease, Type C (NPC). M. el Sayed is involved in a premarketing study with Indorses; all financial arrangements are made through AMC Research BV. CH.E. Hollak and M. Langeveld are involved in premarketing studies with Genzyme, Idorsia, and Protalix. S.J. van der Veen was involved in premarketing studies with Chiesi/Protalix; financial arrangements were made through AMC Research BV. A.B.P. van Kuilenburg reports research funding from Biosidus. L. Vogt reports consultancy for AstraZeneca Netherlands, Bayer BV Netherlands, and Vifor Pharma Netherlands; research funding from Dutch Kidney Foundation and Health Holland; and role as an Associate Editor of BMC Nephrology. All remaining authors have nothing to disclose.

Figures

None
Graphical abstract
Figure 1
Figure 1
Plasma lysoGb3 levels in patients with Fabry disease with different phenotypes. Dotted lines represent upper range of normal (0.5 nmol/L), best cut-off value to differentiate between classical and nonclassical Fabry in female patients (2.3 nmol/L) and the best cut-off value to differentiate between classical and nonclassical Fabry in male patients (40). Figure 1 can be viewed in color online at www.cjasn.org.
Figure 2
Figure 2
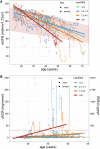
Relation between lysoGb3 and the progression of disease manifestations in the kidneys in untreated patients with Fabry disease. All analyses are performed with actual plasma lysoGb3 levels (after log10 transformation). Grouping is performed for visualization purposes only. (A) Association between plasma lysoGb3 and eGFR slope in untreated patients, the shaded reference area visualizes the approximate 95th percentile eGFR range in healthy individuals, extrapolated from Baba et al. (B) Association between plasma lysoGb3 levels and progression of albuminuria in untreated patients with Fabry disease. Values are depicted both in mg/mmol (on the left axis) and as mg/g (on the right axis). UACR, urinary albumin-to-creatinine ratio. Figure 2 can be viewed in color online at www.cjasn.org.
Figure 3
Figure 3
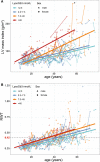
Association of plasma lysoGb3 and cardiac morphology. (A) Relation between lysoGb3 and the increase (slope) of left ventricular mass over time in untreated patients with Fabry disease. Reference ranges of normal left ventricular mass index are 49–115 g/m2 for males and 43–95 for females; >149 g/m2 is considered grossly abnormal in males and >122 g/m2 for females. (B) Association of plasma lysoGb3 with relative wall thickness on echocardiography in untreated patients with Fabry disease. Relative wall thickness was higher in patients with higher lysoGb3 values, but there was no difference in slope over time. Values above >0.42 suggest concentric remodeling. All analyses are performed with actual plasma lysoGb3 levels (after log10 transformation). LysoGb3 levels are grouped for visualization purposes only as described in the legend. *The patient suffered severe cardiac decompensation between first and last assessment. The patient was repeatedly admitted to the intensive care unit after last assessment and passed away 2 years later (due to heart failure). In addition, quality of the echocardiograms in this patient was described as suboptimal. Removing the patient from analyses did not change the outcome of the analysis. LV, left ventricular; RWT, relative wall thickness. Figure 3 can be viewed in color online at www.cjasn.org.
Figure 4
Figure 4
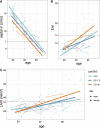
Association between plasma lysoGb3 levels and functional parameters on echocardiography in untreated patients with Fabry disease. (A) Association of plasma lysoGb3 with e′ (P < 0.001). e′ represents the velocity of mitral annular motion during early diastole and is a marker for myocardial relaxation. Patients with higher lysoGb3 values had lower e′ (suggesting stiffer LV) at any age, and there was no difference in slope. (B) Association of plasma lysoGb3 with E/e′ (P < 0.001). E/e′ indicates the ratio between mitral inflow velocity during early diastole (E) and e′ and represents a marker for left atrial filling pressure. Patients with higher lysoGb3 values had higher E/e′ (suggesting higher filling pressure) at any age, and there was no difference in slope. (C) Association of plasma lysoGb3 and LAVI. Higher lysoGb3 levels were associated with a faster increase over time (P = 0.003). The dotted lines in every figure represent the cut-off values for diastolic dysfunction as recommended by the EACVI/ASE. In a healthy heart, relaxation of the LV causes a high velocity of the mitral annulus during early diastole (high e′) resulting in blood being “sucked” from the LA into the LV. Under these circumstances, E/e′ is low, usually <8. In the presence of diastolic dysfunction due to LV hypertrophy and stiffening, the LV does not relax properly (e′ becomes lower), and as a result, E/e′ increases. E/e′ >14 is highly suggestive of elevated filling pressures. Chronic elevated pressure in the left atrium results in dilatation, as indicated by an increased LAVI. All analyses are performed with actual plasma lysoGb3 levels (after log10 transformation). LysoGb3 levels are grouped for visualization purposes only as described in the legend. ASE, American Society of Echocardiography; e′, mitral annular early diastolic velocity; E/e′, the ratio between early mitral inflow velocity and mitral annular early diastolic velocity; EACVI, European Association of Cardiovascular Imaging; LA, left atrial; LAVI, left atrial volume index; LV, left ventricle. Figure 4 can be viewed in color online at www.cjasn.org.
Figure 5
Figure 5
Association of plasma lysoGb3 with the progression of white matter lesions (measured using the Fazekas score) on MRI in untreated patients (n=77). MRI, magnetic resonance imaging. Figure 5 can be viewed in color online at www.cjasn.org.

References

    1. Arends M Wanner C Hughes D, et al. . Characterization of classical and nonclassical fabry disease: a multicenter study. J Am Soc Nephrol. 2017;28(5):1631–1641. doi:10.1681/ASN.2016090964 - DOI - PMC - PubMed
    1. El Sayed M Hirsch A Boekholdt M, et al. . Influence of sex and phenotype on cardiac outcomes in patients with Fabry disease. Heart. 2021;107(23):1889–1897. doi:10.1136/heartjnl-2020-317922 - DOI - PMC - PubMed
    1. Najafian B Svarstad E Bostad L, et al. . Progressive podocyte injury and globotriaosylceramide (GL-3) accumulation in young patients with Fabry disease. Kidney Int. 2011;79(6):663–670. doi:10.1038/ki.2010.484 - DOI - PMC - PubMed
    1. Sanchez-Nino MD Sanz AB Carrasco S, et al. . Globotriaosylsphingosine actions on human glomerular podocytes: implications for Fabry nephropathy. Nephrol Dial Transplant. 2011;26(6):1797–1802. doi:10.1093/ndt/gfq306 - DOI - PubMed
    1. Tuttolomondo A Pecoraro R Simonetta I, et al. . Neurological complications of Anderson-Fabry disease. Curr Pharm Des. 2013;19(33):6014–6030. doi:10.2174/13816128113199990387 - DOI - PubMed

Publication types