Review
. 2023 Nov:97:101206.
doi: 10.1016/j.preteyeres.2023.101206. Epub 2023 Jul 26.

Optical coherence tomography angiography in diabetic retinopathy

Affiliations
Review

Optical coherence tomography angiography in diabetic retinopathy

Nadia K Waheed et al. Prog Retin Eye Res. 2023 Nov.

Abstract

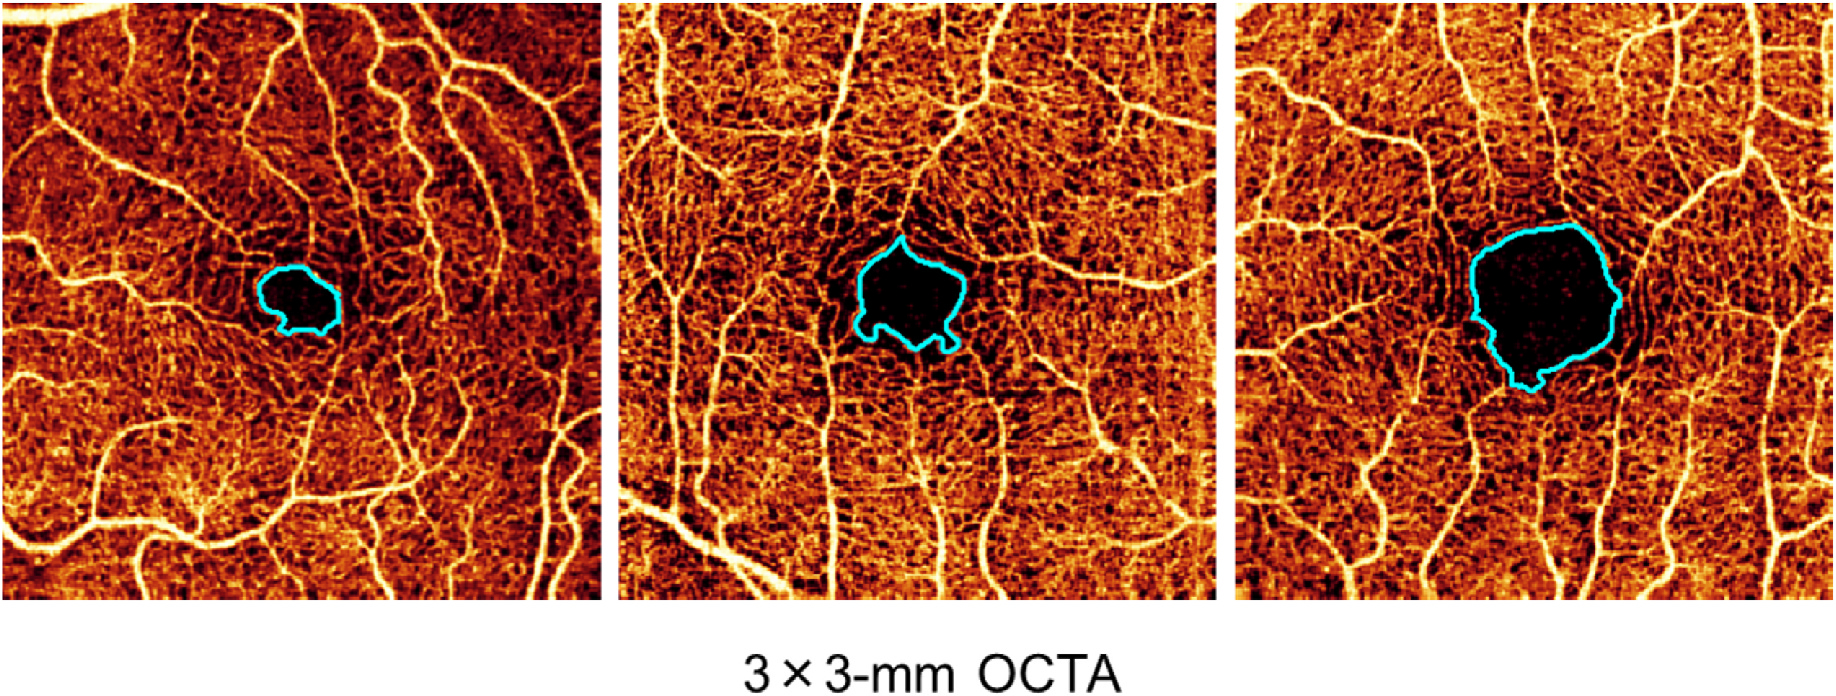
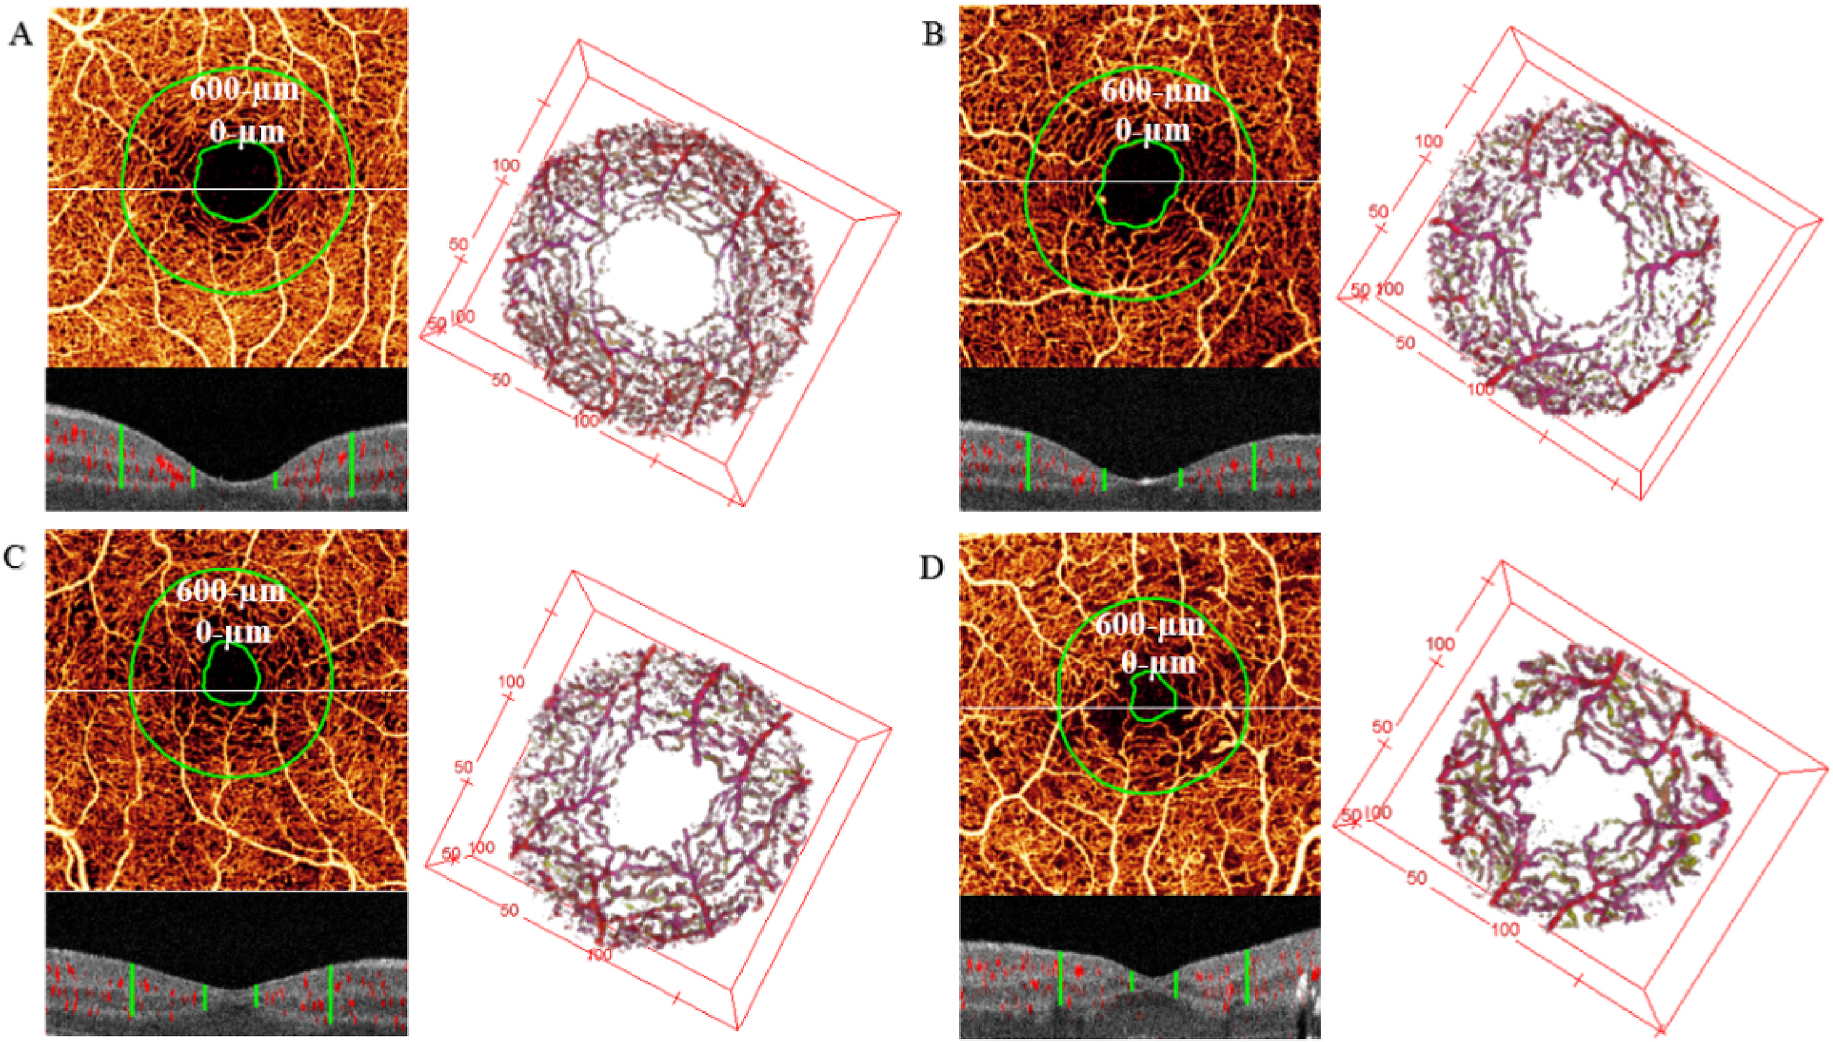
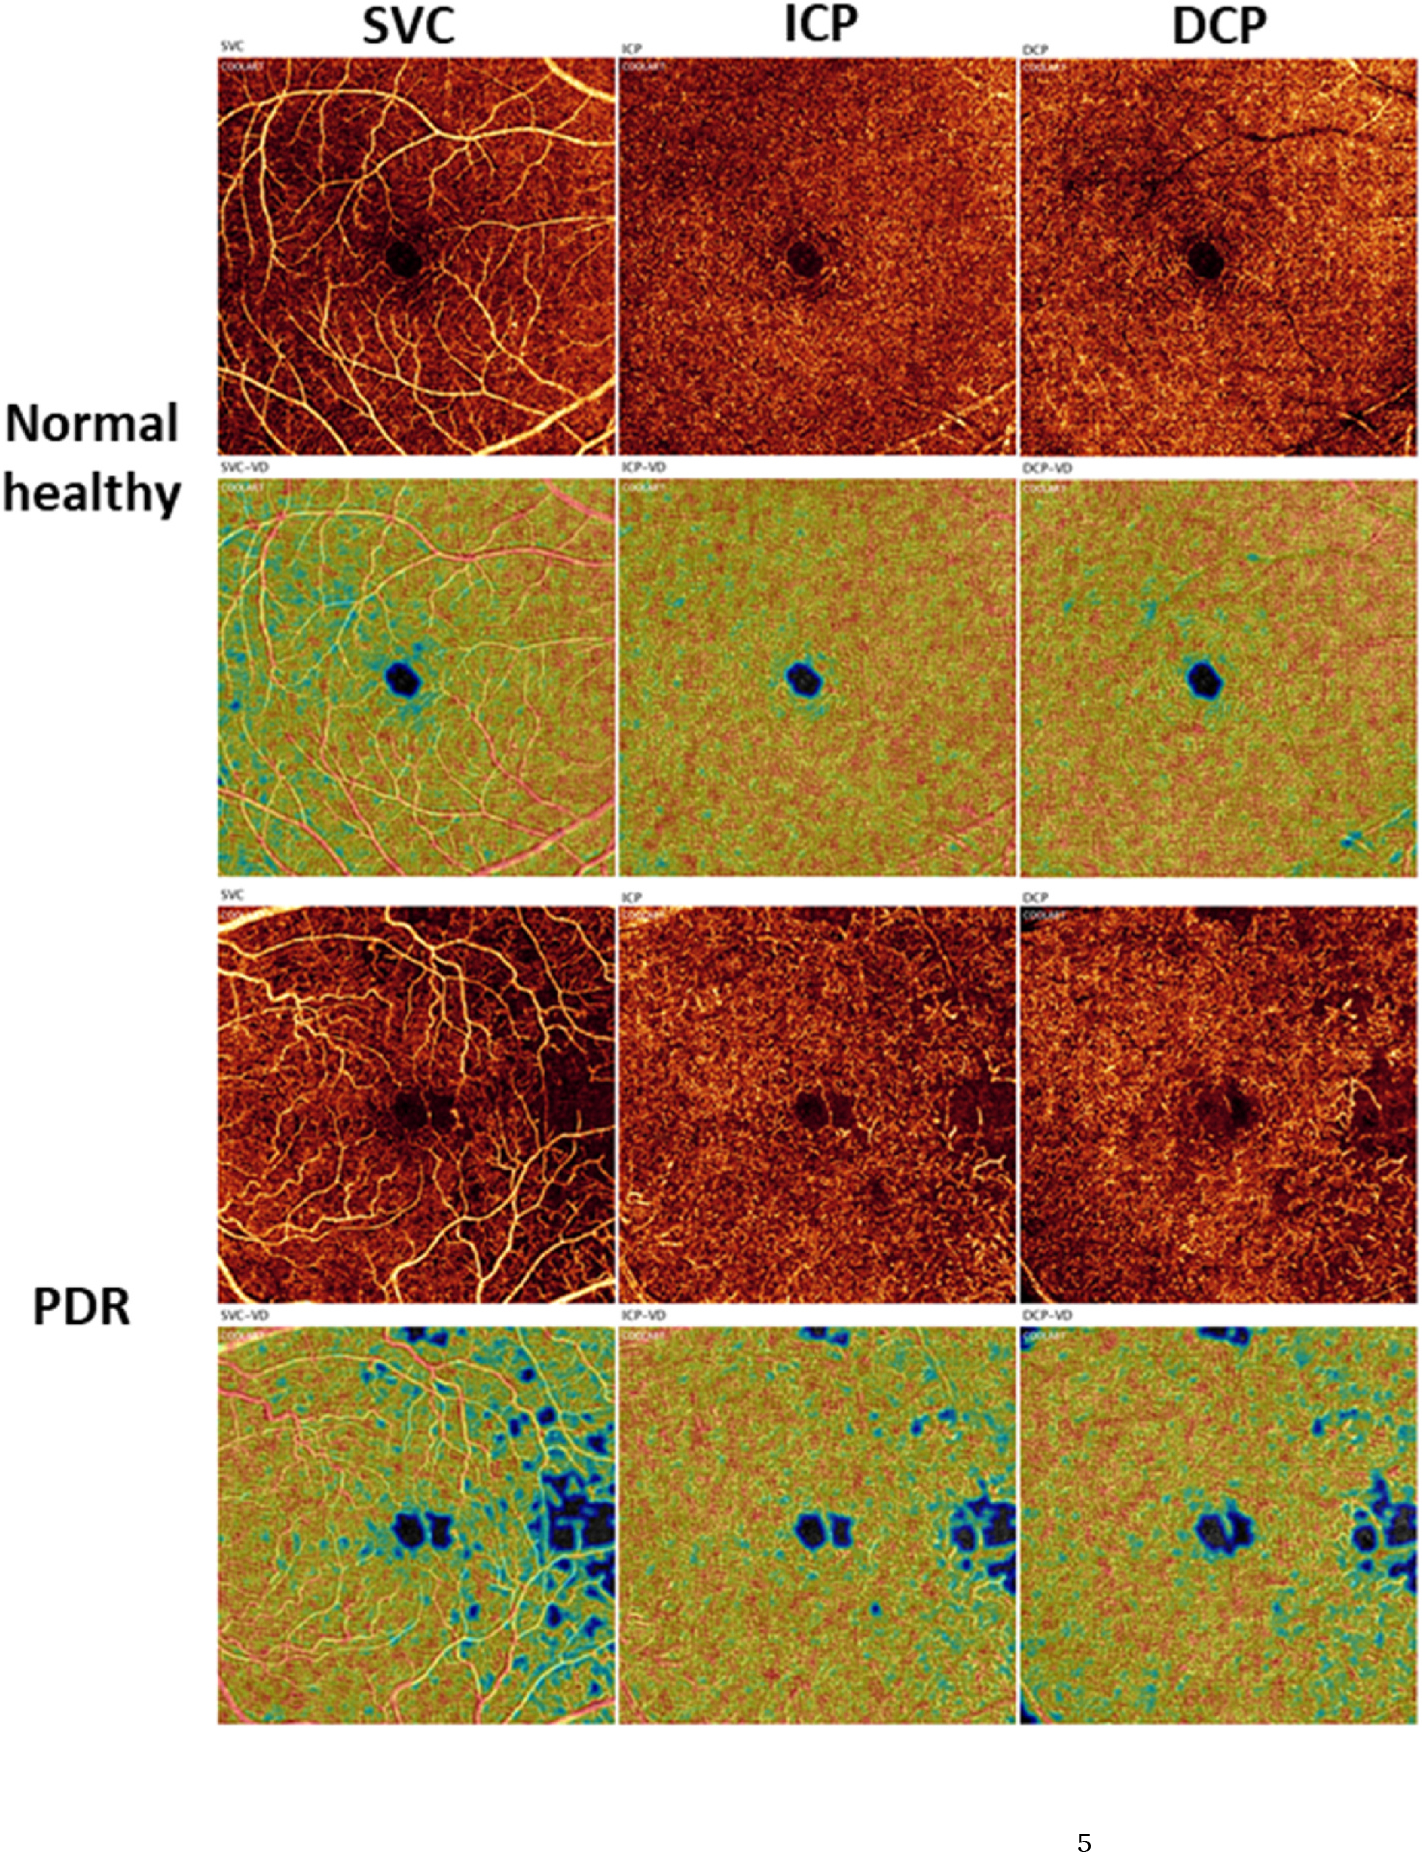
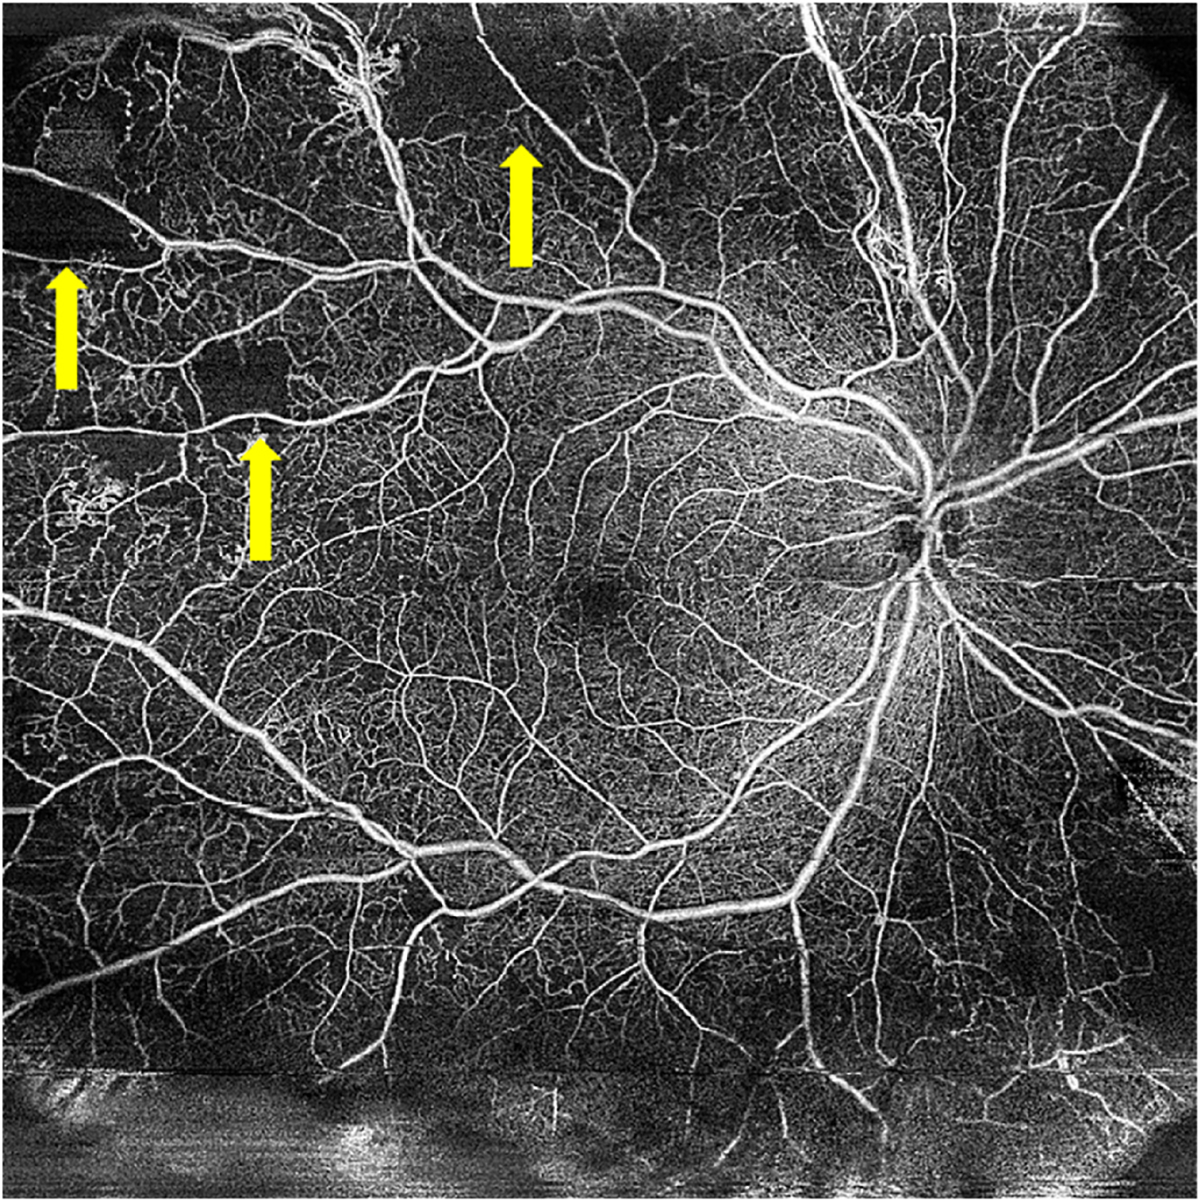
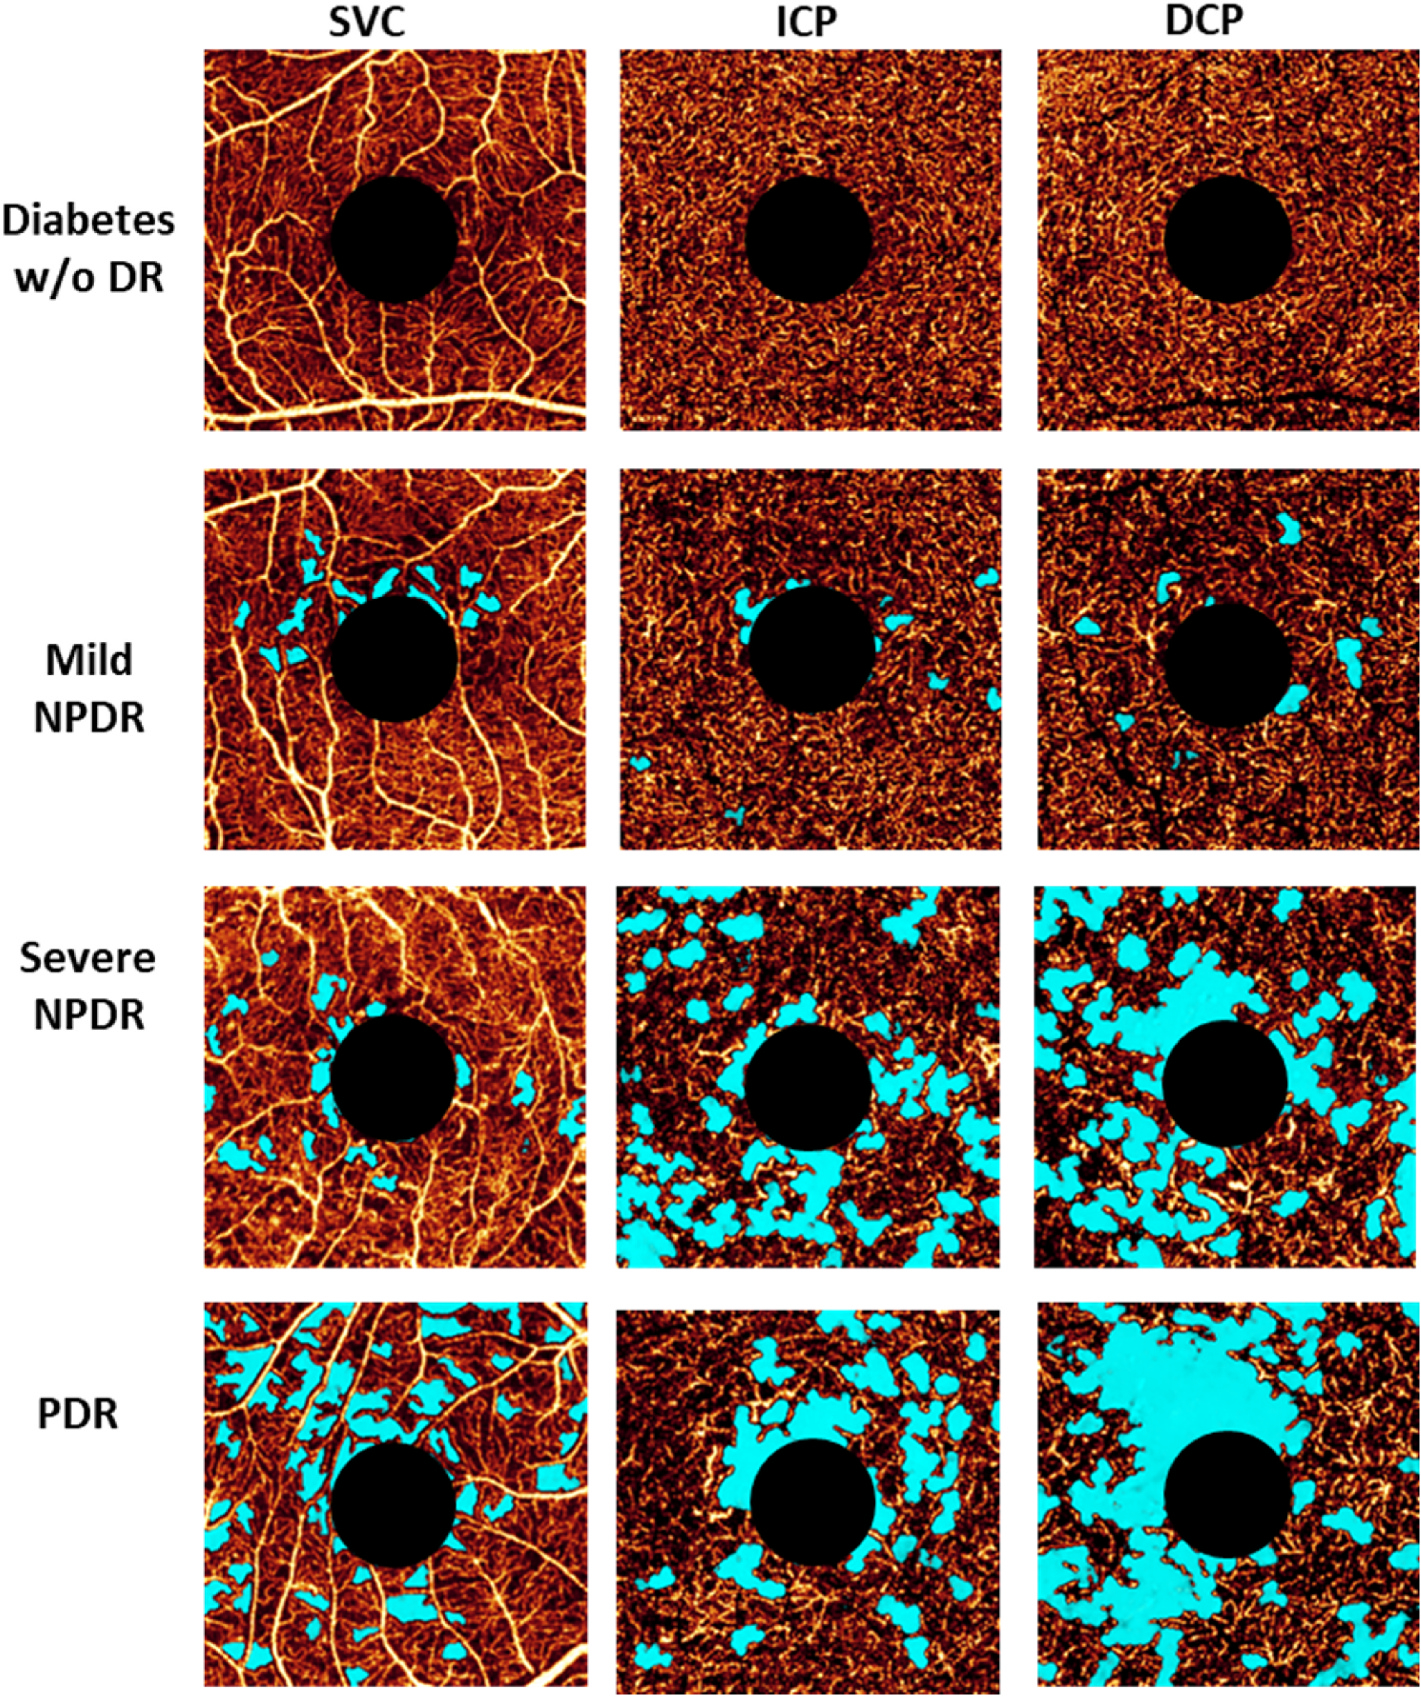
There remain many unanswered questions on how to assess and treat the pathology and complications that arise from diabetic retinopathy (DR). Optical coherence tomography angiography (OCTA) is a novel and non-invasive three-dimensional imaging method that can visualize capillaries in all retinal layers. Numerous studies have confirmed that OCTA can identify early evidence of microvascular changes and provide quantitative assessment of the extent of diseases such as DR and its complications. A number of informative OCTA metrics could be used to assess DR in clinical trials, including measurements of the foveal avascular zone (FAZ; area, acircularity, 3D para-FAZ vessel density), vessel density, extrafoveal avascular zones, and neovascularization. Assessing patients with DR using a full-retinal slab OCTA image can limit segmentation errors and confounding factors such as those related to center-involved diabetic macular edema. Given emerging data suggesting the importance of the peripheral retinal vasculature in assessing and predicting DR progression, wide-field OCTA imaging should also be used. Finally, the use of automated methods and algorithms for OCTA image analysis, such as those that can distinguish between areas of true and false signals, reconstruct images, and produce quantitative metrics, such as FAZ area, will greatly improve the efficiency and standardization of results between studies. Most importantly, clinical trial protocols should account for the relatively high frequency of poor-quality data related to sub-optimal imaging conditions in DR and should incorporate time for assessing OCTA image quality and re-imaging patients where necessary.

Keywords: Diabetic macular edema; Diabetic macular ischemia; Diabetic retinopathy; Optical coherence tomography; Optical coherence tomography angiography.


Figures

Fig. 1.
Fig. 1.
Variance of FAZ size (light blue outline) in three different healthy volunteers; left to right, FAZ size is 0.15 mm2, 0.20 mm2, and 0.44 mm2. The size of the FAZ is highly variable in healthy eyes. FAZ, foveal avascular zone; OCTA, optical coherence tomography angiography.
Fig. 2.
Fig. 2.
Three-dimensional para-FAZ vessel density in the eyes of a healthy control (A), with diabetes without retinopathy (B), with mild-to-moderate non-proliferative diabetic retinopathy (C), and with proliferative diabetic retinopathy (D). Upper left panels of (A–D): en face maximum projection of inner-retinal angiogram. The inner green line represents the tbFAZ boundary; the outer green line represents 600 μm distances from the tbFAZ boundary in the transverse direction. The white horizontal line indicates the position of the representative B-scan in the panel below. Lower left panels of (A–D): cross-sectional B-scan overlaid with angiographic signal (red). The green vertical lines indicate the analytic para-FAZ volume boundary locations in the inner retina. Right panels of (A–D): corresponding volumetric para-FAZ optical coherence tomography angiography. FAZ, foveal avascular area; tbFAZ, theoretical baseline FAZ. Reproduced with permission from Wang, B. et al., 2019. Biomed Opt Express 10, 3522.
Fig. 3.
Fig. 3.
Projection-resolved 6 × 6-mm optical coherence tomography angiograms (1st and 3rd rows) and corresponding vessel density heat maps (2nd and 4th rows) of a healthy eye and an eye with PDR in the SVC (1st column), ICP (2nd column), and DCP (3rd column) (previously unpublished data; the published method can be found in (Hagag et al., 2019). Am J Ophthalmol 204, 70–79). DCP, deep capillary plexus; ICP, intermediate capillary plexus; PDR, proliferative diabetic retinopathy; SVC, superficial vascular complex.
Fig. 4.
Fig. 4.
15 × 15 mm Optical coherence tomography angiography image showing areas of extrafoveal capillary dropout (yellow arrows), indicating extrafoveal avascular regions in a patient with proliferative diabetic retinopathy.
Fig. 5.
Fig. 5.
Presentation of the avascular area (light blue) in eyes with different DR severity. Images are projection-resolved 3 × 3-mm optical coherence tomography angiograms of a diabetic eye without retinopathy and of eyes with mild NPDR, severe NPDR, and PDR. The SVC, ICP, and DCP are presented in separate en face angiograms. DCP, deep capillary plexus; DR, diabetic retinopathy; ICP, intermediate capillary plexus; NPDR, non-proliferative diabetic retinopathy; PDR, proliferative diabetic retinopathy; SVC, superficial vascular complex; w/o, without. Adapted with permission from You et al., 2020a. Am J Ophthalmol 217, 268–277.
Fig. 6.
Fig. 6.
Example of IRMAs in one patient with proliferative diabetic retinopathy.(A) 15 × 15 mm Optical coherence tomography angiography image showing IRMA in a full-retinal slab, highlighted in an inset yellow box; (B) B-scan with segmentation lines in the same patient, taken as a cross-section from the blue line in (A), with intraretinal flow highlighted in the inset yellow box. The ILM and hyaloid face are not breached, thus differentiating the IRMA from neovascularization. ILM, inner limiting membrane; IRMA, intraretinal microvascular abnormality.
Fig. 7.
Fig. 7.
Parafoveal vessel density measured using OCTA at different retinal plexuses during ambient light transition for controls, patients with diabetes but no DR, and patients with mild NPDR. (A) Vessel density in the SCP; (B) vessel length density; (C) vessel density in the middle capillary plexus; (D) vessel density in the deep capillary plexus. Statistically significant differences between diabetic and control conditions (p < 0.05) are indicated with an asterisk (*). DCP, deep capillary plexus; DM, diabetes mellitus; DR, diabetic retinopathy; ICP, intermediate capillary plexus; NPDR, non-proliferative diabetic retinopathy; OCTA, optical coherence tomography angiography; SCP, superficial capillary plexus. Adapted from Zhang, Y.S. et al., 2020. J Clin Med 9, 3523.
Fig. 8.
Fig. 8.
(A) Example of bulk motion artifacts in the superficial vascular complex from an AngioVue (Optovue, USA) optical coherence tomography device. (B) Optical coherence tomography angiography images with vascular marking: shadow artifact (top) and eye movement artifact (bottom). (C) Vascular density map of the same images as in (B): shadow artifact (top) and eye movement artifact (bottom). White arrowheads in B and C indicate movement lines. Adapted from Hormel, Teo et al., 2021. Quant Imaging Med Surg 11(3), 1120–1133.
Fig. 9.
Fig. 9.
Example of a scan decentration artifact: optical coherence tomography angiography image (left) and vascular density map (right). Superior shift of the fovea when centering the scan results in the loss of the inner subfield (indicated by the white arrowhead). Adapted from Hormel, Teo et al., 2021. Quant Imaging Med Surg 11(3), 1120–1133.
Fig. 10.
Fig. 10.
Algorithm for distinguishing non-perfusion areas from signal-reduction artifacts on OCTA. With an intelligent combination of structural OCT and OCTA data as the input, the convolutional neural network developed by Guo et al. can accurately distinguish between the real avascular area (blue) and shadow artifacts (yellow). OCT, optical coherence tomography; OCTA, optical coherence tomography angiography. Adapted from Guo, Y. et al., 2019. Biomed Opt Express 10 (7), 3257–3268.

References

    1. Abdelshafy M, Abdelshafy A, 2020. Functional and structural changes of the retinal nerve fiber layer and ganglion cell complex in heavy smokers. Clin. Ophthalmol. 14, 397–404. - PMC - PubMed
    1. Acton JH, Greenstein VC, 2013. Fundus-driven perimetry (microperimetry) compared to conventional static automated perimetry: similarities, differences, and clinical applications. Can. J. Ophthalmol. 48, 358–363. - PMC - PubMed
    1. Agemy SA, Scripsema NK, Shah CM, Chui T, Garcia PM, Lee JG, Gentile RC, Hsiao YS, Zhou Q, Ko T, Rosen RB, 2015. Retinal vascular perfusion density mapping using optical coherence tomography angiography in normals and diabetic retinopathy patients. Retina 35, 2353–2363. - PubMed
    1. Al-Sheikh M, Falavarjani KG, Tepelus TC, Sadda SR, 2017. Quantitative comparison of swept-source and spectral-domain OCT angiography in healthy eyes. Ophthalmic Surg. Lasers Imaging Retina 48, 385–391. - PubMed
    1. Alibhai AY, De Pretto LR, Moult EM, Or C, Arya M, McGowan M, Carrasco-Zevallos O, Lee B, Chen S, Baumal CR, Witkin AJ, Reichel E, de Freitas AZ, Duker JS, Fujimoto JG, Waheed NK, 2020. Quantification of retinal capillary nonperfusion in diabetics using wide-field optical coherence tomography angiography. Retina 40, 412–420. - PubMed

Publication types