. 2024 Jun:60:93-110.
doi: 10.1016/j.jare.2023.07.010. Epub 2023 Jul 25.

Hsa_circ_0001402 alleviates vascular neointimal hyperplasia through a miR-183-5p-dependent regulation of vascular smooth muscle cell proliferation, migration, and autophagy

Affiliations

Hsa_circ_0001402 alleviates vascular neointimal hyperplasia through a miR-183-5p-dependent regulation of vascular smooth muscle cell proliferation, migration, and autophagy

Jia-Jie Lin et al. J Adv Res. 2024 Jun.

Erratum in

Abstract

Introduction: Vascular neointimal hyperplasia, a pathological process observed in cardiovascular diseases such as atherosclerosis and pulmonary hypertension, involves the abundant presence of vascular smooth muscle cells (VSMCs). The proliferation, migration, and autophagy of VSMCs are associated with the development of neointimal lesions. Circular RNAs (circRNAs) play critical roles in regulating VSMC proliferation and migration, thereby participating in neointimal hyperplasia. However, the regulatory roles of circRNAs in VSMC autophagy remain unclear.

Objectives: We aimed to identify circRNAs that are involved in VSMC autophagy-mediated neointimal hyperplasia, as well as elucidate the underlying mechanisms.

Methods: Dual-luciferase reporter gene assay was performed to validate two competing endogenous RNA axes, hsa_circ_0001402/miR-183-5p/FKBP prolyl isomerase like (FKBPL) and hsa_circ_0001402/miR-183-5p/beclin 1 (BECN1). Cell proliferation and migration analyses were employed to investigate the effects of hsa_circ_0001402, miR-183-5p, or FKBPL on VSMC proliferation and migration. Cell autophagy analysis was conducted to reveal the role of hsa_circ_0001402 or miR-183-5p on VSMC autophagy. The role of hsa_circ_0001402 or miR-183-5p on neointimal hyperplasia was evaluated using a mouse model of common carotid artery ligation.

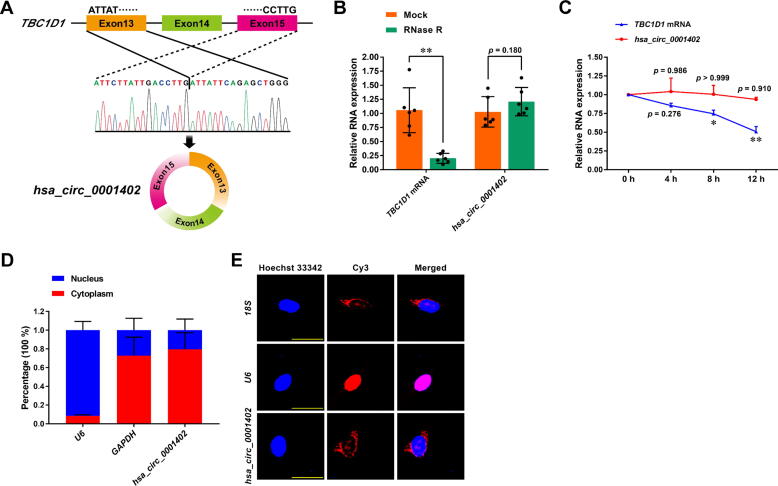
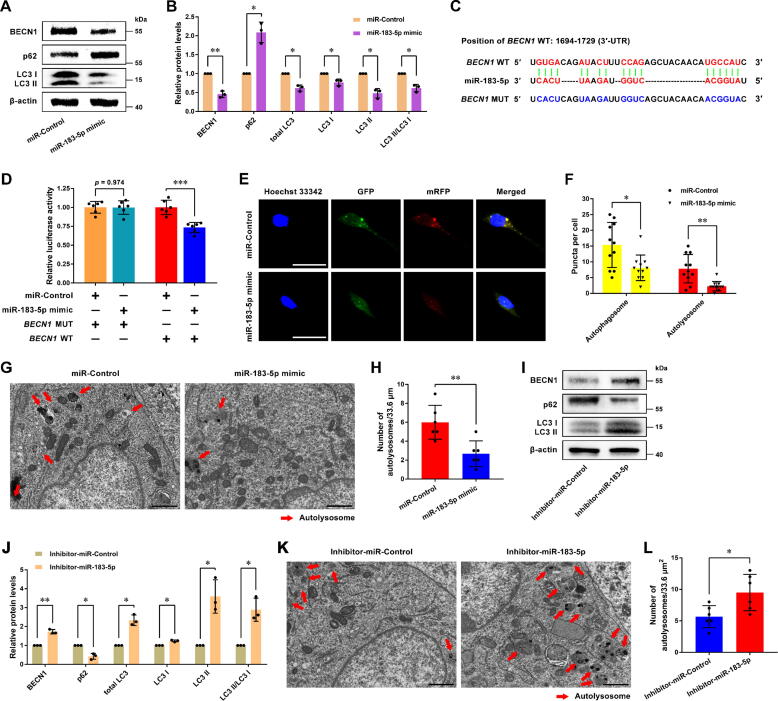
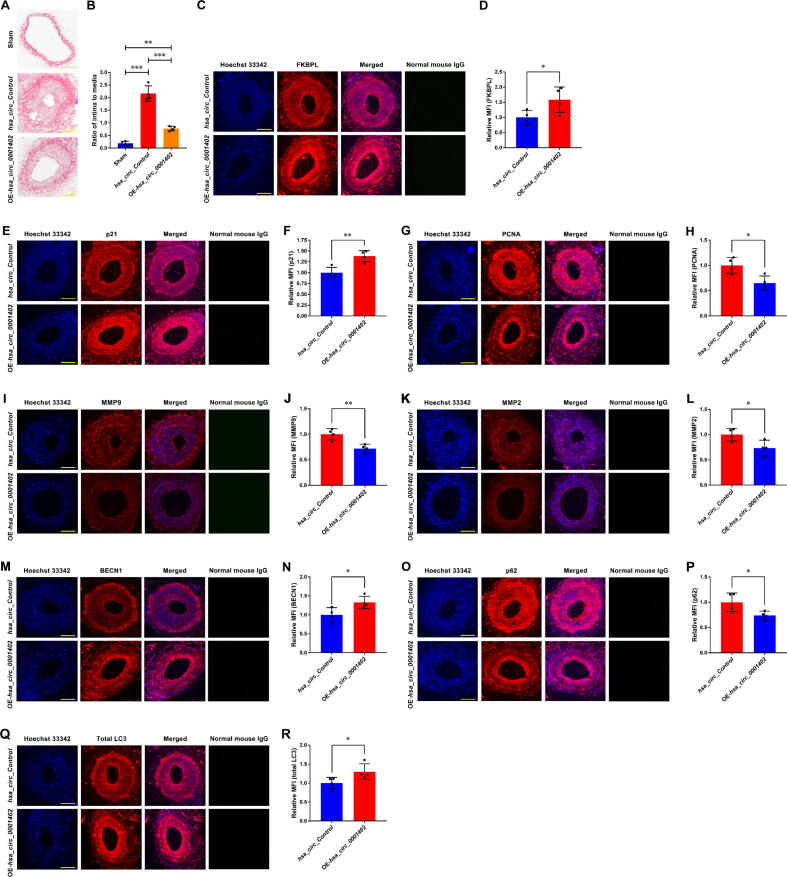
Results: Hsa_circ_0001402 acted as a sponge for miR-183-5p, leading to the suppression of miR-183-5p expression. Through direct interaction with the coding sequence (CDS) of FKBPL, miR-183-5p promoted VSMC proliferation and migration by decreasing FKBPL levels. Besides, miR-183-5p reduced BECN1 levels by targeting the 3'-untranslated region (UTR) of BECN1, thus inhibiting VSMC autophagy. By acting as a miR-183-5p sponge, overexpression of hsa_circ_0001402 increased FKBPL levels to inhibit VSMC proliferation and migration, while simultaneously elevating BECN1 levels to activate VSMC autophagy, thereby alleviating neointimal hyperplasia.

Conclusion: Hsa_circ_0001402, acting as a miR-183-5p sponge, increases FKBPL levels to inhibit VSMC proliferation and migration, while enhancing BECN1 levels to activate VSMC autophagy, thus alleviating neointimal hyperplasia. The hsa_circ_0001402/miR-183-5p/FKBPL axis and hsa_circ_0001402/miR-183-5p/BECN1 axis may offer potential therapeutic targets for neointimal hyperplasia.

Keywords: Autophagy; Migration; Neointima hyperplasia; Proliferation; Vascular smooth muscle cell; hsa_circ_0001402; miR-183-5p.


Conflict of interest statement

Declaration of Competing Interest The authors declare that they have no known competing financial interests or personal relationships that could have appeared to influence the work reported in this paper.

Figures

None
Graphical abstract
Fig. 1
Fig. 1
Expression pattern of hsa_circ_0001402 in VSMCs. (A) The schematic diagram of circularization of exons 13, 14, and 15 of the TBC1D1 gene to form hsa_circ_0001402. (B) qRT-PCR analysis of hsa_circ_0001402 and TBC1D1 mRNA expression in total RNA with or without RNase R (3 U/μg) treatment. The TBC1D1 mRNA served as an RNase R-sensitive control. Data are shown as mean ± SD (n = 6, **p < 0.01 vs. mock group, two-tailed unpaired t-test followed by Welch's correction (left), two-tailed Mann-Whitney U test (right). (C) qRT-PCR analysis of hsa_circ_0001402 and TBC1D1 mRNA expression in HASMCs treated with 2 μg/mL actinomycin D. Data are shown as mean ± SD (n = 3 at different points in time, *p < 0.05, **p < 0.01 vs. TBC1D1 mRNA group, two-way ANOVA followed by Sidak's multiple comparisons test). (D) qRT-PCR analysis of the nucleoplasmic distribution of hsa_circ_0001402 in HASMCs. U6: nuclear positive control; GAPDH: cytoplasmic positive control. Data are shown as mean ± SD. (E) RNA FISH analysis of the nucleoplasmic distribution of hsa_circ_0001402 in HASMCs. U6: nuclear positive control; 18S: cytoplasmic positive control. The red fluorescence represents the anti-sense probe (U6, 18S, or hsa_circ_0001402) labeled with Cy3. The blue fluorescence (Hoechst 33342) represents the cell nucleus. The scale bar is 25 µm. (For interpretation of the references to colour in this figure legend, the reader is referred to the web version of this article.)
Fig. 2
Fig. 2
Overexpression of hsa_circ_0001402 inhibits VSMC proliferation and migration, while promoting VSMC autophagy. (A) Western blot analysis of PCNA after 48 h of transfection of the expression vector of hsa_circ_Control or hsa_circ_0001402 in HASMCs. Data are shown as mean ± SD (n = 4, ***p < 0.001 vs. hsa_circ_Control group, two-tailed paired t-test). (B) EdU incorporation analysis of DNA synthesis after 48 h of transfection of the expression vector of hsa_circ_Control or hsa_circ_0001402 in HASMCs. Blue fluorescence (Hoechst 33342) represents the cell nuclei, while red fluorescence (EdU) represents HASMCs with DNA synthesis. The scale bar is 10 µm. (C) The proportion of EdU-positive HASMCs. Data are shown as mean ± SD (n = 5, ***p < 0.001 vs. hsa_circ_Control group, two-tailed unpaired t-test). (D) CCK-8 analysis of cell viability of HASMCs transfected with the expression vector of hsa_circ_Control or hsa_circ_0001402. Data are shown as mean ± SD (n = 6, *p < 0.05, ***p < 0.001 vs. hsa_circ_Control group at the corresponding point in time, two-way ANOVA followed by Sidak's multiple comparisons test). (E-F) Western blot analysis of MMP9 and MMP2 after 48 h of transfection of the expression vector of hsa_circ_Control or hsa_circ_0001402 in MOVAS cells. Data are shown as mean ± SD (n = 3, *p < 0.05 vs. hsa_circ_Control group, two-tailed paired t-test). (G) Migration analysis of MOVAS cells transfected with the expression vector of hsa_circ_Control or hsa_circ_0001402. The scale bar is 500 µm. (H) Quantify the migration area using ImageJ. Data are shown as mean ± SD (n = 4, **p < 0.01, ***p < 0.001, two-tailed unpaired t-test). (I-J) Western blot analysis of p62 and LC3 after 48 h of transfection of the expression vector of hsa_circ_Control or hsa_circ_0001402 in HASMCs. Data are shown as mean ± SD (n = 4, *p < 0.05 vs. hsa_circ_Control group, two-tailed paired t-test). (K-L) Fluorescence images (K) of HASMCs co-transfected with mRFP-GFP-LC3 plasmid and the expression vector of either hsa_circ_Control or hsa_circ_0001402 for 48 h. Blue fluorescence (Hoechst 33342) represents the cell nuclei. The scale bar is 50 μm. Quantitative data (L) represents the number of autophagosomes (yellow dots) and autolysosomes (red dots) in the merged images. Data are shown as mean ± SD (n = 11 HASMCs, *p < 0.05, **p < 0.01 vs. hsa_circ_Control group, two-tailed unpaired t-test). (M) TEM analysis of autolysosomes after 48 h of transfection of the expression vector of hsa_circ_Control or hsa_circ_0001402 in MOVAS cells. The scale bar is 1 μm. (N) Quantify the number of autolysosomes. Data are shown as mean ± SD (n = 6, **p < 0.01 vs. hsa_circ_Control group, two-tailed paired t-test). (For interpretation of the references to colour in this figure legend, the reader is referred to the web version of this article.)
Fig. 3
Fig. 3
MiR-183-5p promotes VSMC proliferation and migration by reducing FKBPL levels. (A) Venn diagram analysis of miRNAs that hsa_circ_0001402 might interact with. (B-C) Western blot analysis of FKBPL, p21, PCNA, MMP9, and MMP2 after 48 h of transfection of miR-Control or miR-183-5p mimic in HASMCs. Data are shown as mean ± SD (n = 3, *p < 0.05, **p < 0.01 vs. miR-Control group, two-tailed paired t-test). (D) The binding site between the CDS region of FKBPL or Fkbpl mRNA and miR-183-5p. (E) Dual-luciferase reporter gene analysis of the interaction between miR-183-5p and FKBPL. WT: wild-type; MUT: mutant. Data are shown as mean ± SD (n = 6, ***p < 0.001, two-tailed unpaired t-test). (F) EdU incorporation analysis of DNA synthesis after 48 h of transfection of miR-Control or miR-183-5p mimic in HASMCs. Blue fluorescence (Hoechst 33342) represents the cell nuclei, while red fluorescence (EdU) represents HASMCs with DNA synthesis. The scale bar is 10 µm. (G) The proportion of EdU-positive HASMCs. Data are shown as mean ± SD (n = 5, *p < 0.05 vs. miR-Control group, two-tailed unpaired t-test with Welch's correction). (H) CCK-8 analysis of cell viability of HASMCs transfected with miR-Control or miR-183-5p mimic. Data are shown as mean ± SD (n = 6, ***p < 0.001 vs. miR-Control group at the corresponding point in time, two-way ANOVA followed by Sidak's multiple comparisons test). (I) Migration analysis of MOVAS cells transfected with miR-Control or miR-183-5p mimic. The scale bar is 500 µm. (J) Quantify the migration area using ImageJ. Data are shown as mean ± SD (n = 4, ***p < 0.001, two-tailed unpaired t-test). (K-L) Western blot analysis of FKBPL, p21, PCNA, MMP9, and MMP2 after 48 h of transfection of miR-Control or miR-183-5p inhibitor in MOVAS cells. Data are shown as mean ± SD (n = 4 or 3, **p < 0.01 vs. inhibitor-miR-Control group, two-tailed paired t-test). (M) CCK-8 analysis of cell viability of MOVAS cells transfected with miR-Control or miR-183-5p inhibitor. Data are shown as mean ± SD (n = 9, ***p < 0.001 vs. inhibitor-miR-Control group at the corresponding point in time, two-way ANOVA followed by Sidak's multiple comparisons test). (N) EdU incorporation analysis of DNA synthesis after 48 h of transfection of miR-Control or miR-183-5p inhibitor in MOVAS cells. Blue fluorescence (Hoechst 33342) represents the cell nuclei, while red fluorescence (EdU) represents MOVAS cells with DNA synthesis. The scale bar is 10 µm. (O) The proportion of EdU-positive MOVAS cells. Data are shown as mean ± SD (n = 5, ***p < 0.001 vs. inhibitor-miR-Control group, two-tailed unpaired t-test). (P) Migration analysis of MOVAS cells transfected with miR-Control or miR-183-5p inhibitor. The scale bar is 500 µm. (Q) Quantify the migration area using ImageJ. Data are shown as mean ± SD (n = 4, **p < 0.01, two-tailed unpaired t-test). (For interpretation of the references to colour in this figure legend, the reader is referred to the web version of this article.)
Fig. 4
Fig. 4
MiR-183-5p inhibits VSMC autophagy by decreasing BECN1 levels. (A-B) Western blot analysis of BECN1, p62, and LC3 after 48 h of transfection of miR-Control or miR-183-5p mimic in HASMCs. Data are shown as mean ± SD (n = 3, *p < 0.05, **p < 0.01 vs. miR-Control group, two-tailed paired t-test). (C) The binding site between the 3′-UTR region of BECN1 mRNA and miR-183-5p. (D) Dual-luciferase reporter gene analysis of the interaction between miR-183-5p and BECN1. WT: wild-type; MUT: mutant. Data are shown as mean ± SD (n = 6, ***p < 0.001, two-tailed unpaired t-test). (E-F) Fluorescence images (E) of HASMCs co-transfected with mRFP-GFP-LC3 plasmid and either miR-Control or miR-183-5p mimic for 48 h. Blue fluorescence (Hoechst 33342) represents the cell nuclei. The scale bar is 50 μm. Quantitative data (F) represents the number of autophagosomes (yellow dots) and autolysosomes (red dots) in the merged images. Data are shown as mean ± SD (n = 11 cells, *p < 0.05, **p < 0.01 vs. miR-Control group, two-tailed Mann-Whitney U test). (G) TEM analysis of autolysosomes after 48 h of transfection of miR-Control or miR-183-5p mimic in MOVAS cells. The scale bar is 1 μm. (H) Quantify the number of autolysosomes. Data are shown as mean ± SD (n = 6, **p < 0.01 vs. miR-Control group, two-tailed paired t-test). (I-J) Western blot analysis of BECN1, p62, and LC3 after 48 h of transfection of miR-Control or miR-183-5p inhibitor in MOVAS cells. Data are shown as mean ± SD (n = 3, *p < 0.05, **p < 0.01 vs. inhibitor-miR-Control group, two-tailed paired t-test). (K) TEM analysis of autolysosomes after 48 h of transfection of miR-Control or miR-183-5p inhibitor in MOVAS cells. The scale bar is 1 μm. (L) Quantify the number of autolysosomes. Data are shown as mean ± SD (n = 6, *p < 0.05 vs. inhibitor-miR-Control group, two-tailed paired t-test). (For interpretation of the references to colour in this figure legend, the reader is referred to the web version of this article.)
Fig. 5
Fig. 5
Overexpression of miR-183-5p aggravates neointimal hyperplasia by decreasing FKBPL and BECN1 levels. (A) The cross-sectional H&E staining images of the ligated mouse common carotid arteries after 21 days of treatment with Sham Control, miR-Control agomir, or miR-183-5p agomir. The scale bar is 100 µm. (B) Morphometric measurement of the intimal/media ratio in the mouse common carotid arterial sections (n = 4 mice). Data are shown as mean ± SD (***p < 0.001, one-way ANOVA followed by Tukey's multiple comparisons test). (C) Immunofluorescence of FKBPL after 21 days of in situ delivery of miR-Control or miR-183-5p agomir in ligated mouse common carotid arteries. The scale bar is 100 µm. (D) The quantification of FKBPL levels in the ligated mouse common carotid arteries (n = 4 mice). Data are shown as mean ± SD (**p < 0.01 vs. miR-Control agomir group, two-tailed unpaired t-test). (E) Immunofluorescence of p21 after 21 days of in situ delivery of miR-Control or miR-183-5p agomir in ligated mouse common carotid arteries. The scale bar is 100 µm. (F) The quantification of p21 levels in the ligated mouse common carotid arteries (n = 4 mice). Data are shown as mean ± SD (*p < 0.05 vs. miR-Control agomir group, two-tailed unpaired t-test). (G) Immunofluorescence of PCNA after 21 days of in situ delivery of miR-Control or miR-183-5p agomir in ligated mouse common carotid arteries. The scale bar is 100 µm. (H) The quantification of PCNA levels in the ligated mouse common carotid arteries (n = 4 mice). Data are shown as mean ± SD (*p < 0.05 vs. miR-Control agomir group, two-tailed unpaired t-test). (I) Immunofluorescence of MMP9 after 21 days of in situ delivery of miR-Control or miR-183-5p agomir in ligated mouse common carotid arteries. The scale bar is 100 µm. (J) The quantification of MMP9 levels in the ligated mouse common carotid arteries (n = 4 mice). Data are shown as mean ± SD (*p < 0.05 vs. miR-Control agomir group, two-tailed unpaired t-test). (K) Immunofluorescence of MMP2 after 21 days of in situ delivery of miR-Control or miR-183-5p agomir in ligated mouse common carotid arteries. The scale bar is 100 µm. (L) The quantification of MMP2 levels in the ligated mouse common carotid arteries (n = 4 mice). Data are shown as mean ± SD (*p < 0.05 vs. miR-Control agomir group, two-tailed unpaired t-test). (M) Immunofluorescence of BECN1 after 21 days of in situ delivery of miR-Control or miR-183-5p agomir in ligated mouse common carotid arteries. The scale bar is 100 µm. (N) The quantification of BECN1 levels in the ligated mouse common carotid arteries (n = 4 mice). Data are shown as mean ± SD (*p < 0.05 vs. miR-Control agomir group, two-tailed unpaired t-test). (O) Immunofluorescence of p62 after 21 days of in situ delivery of miR-Control or miR-183-5p agomir in ligated mouse common carotid arteries. The scale bar is 100 µm. (P) The quantification of p62 levels in the ligated mouse common carotid arteries (n = 4 mice). Data are presented as mean ± SD (*p < 0.05 vs. miR-Control agomir group, two-tailed unpaired t-test). (Q) Immunofluorescence of total LC3 after 21 days of in situ delivery of miR-Control or miR-183-5p agomir in ligated mouse common carotid arteries. The scale bar is 100 µm. (R) The quantification of total LC3 levels in the ligated mouse common carotid arteries (n = 4 mice). Data are shown as mean ± SD (*p < 0.05 vs. miR-Control agomir group, two-tailed unpaired t-test). Normal mouse IgG was used as a negative control. MFI: mean fluorescent intensity.
Fig. 6
Fig. 6
Silencing of miR-183-5p alleviates neointimal hyperplasia by increasing FKBPL and BECN1 levels. (A) The cross-sectional H&E staining images of the ligated mouse common carotid arteries after 21 days of treatment with Sham Control, miR-Control antagomir, or miR-183-5p antagomir. The scale bar is 100 µm. (B) Morphometric measurement of the intimal/media ratio in the mouse common carotid arterial sections (n = 4 mice). Data are shown as mean ± SD (**p < 0.01, ***p < 0.001, one-way ANOVA followed by Tukey's multiple comparisons test). (C) Immunofluorescence of FKBPL after 21 days of in situ delivery of miR-Control or miR-183-5p antagomir in ligated mouse common carotid arteries. The scale bar is 100 µm. (D) The quantification of FKBPL levels in the ligated mouse common carotid arteries (n = 4 mice). Data are shown as mean ± SD (***p < 0.001 vs. miR-Control antagomir group, two-tailed unpaired t-test). (E) Immunofluorescence of p21 after 21 days of in situ delivery of miR-Control or miR-183-5p antagomir in ligated mouse common carotid arteries. The scale bar is 100 µm. (F) The quantification of p21 levels in the ligated mouse common carotid arteries (n = 4 mice). Data are shown as mean ± SD (*p < 0.05 vs. miR-Control antagomir group, two-tailed unpaired t-test). (G) Immunofluorescence of PCNA after 21 days of in situ delivery of miR-Control or miR-183-5p antagomir in ligated mouse common carotid arteries. The scale bar is 100 µm. (H) The quantification of PCNA levels in the ligated mouse common carotid arteries (n = 4 mice). Data are shown as mean ± SD (**p < 0.01 vs. miR-Control antagomir group, two-tailed unpaired t-test). (I) Immunofluorescence of MMP9 after 21 days of in situ delivery of miR-Control or miR-183-5p antagomir in ligated mouse common carotid arteries. The scale bar is 100 µm. (J) The quantification of MMP9 levels in the ligated mouse common carotid arteries (n = 4 mice). Data are shown as mean ± SD (**p < 0.01 vs. miR-Control antagomir group, two-tailed unpaired t-test). (K) Immunofluorescence of MMP2 after 21 days of in situ delivery of miR-Control or miR-183-5p antagomir in ligated mouse common carotid arteries. The scale bar is 100 µm. (L) The quantification of MMP2 levels in the ligated mouse common carotid arteries (n = 4 mice). Data are shown as mean ± SD (*p < 0.05 vs. miR-Control antagomir group, two-tailed unpaired t-test). (M) Immunofluorescence of BECN1 after 21 days of in situ delivery of miR-Control or miR-183-5p antagomir in ligated mouse common carotid arteries. The scale bar is 100 µm. (N) The quantification of BECN1 levels in the ligated mouse common carotid arteries (n = 4 mice). Data are shown as mean ± SD (**p < 0.01 vs. miR-Control antagomir group, two-tailed unpaired t-test). (O) Immunofluorescence of p62 after 21 days of in situ delivery of miR-Control or miR-183-5p antagomir in ligated mouse common carotid arteries. The scale bar is 100 µm. (P) The quantification of p62 levels in the ligated mouse common carotid arteries (n = 6 mice). Data are shown as mean ± SD (*p < 0.05 vs. miR-Control antagomir group, two-tailed unpaired t-test). (Q) Immunofluorescence of total LC3 after 21 days of in situ delivery of miR-Control or miR-183-5p antagomir in ligated mouse common carotid arteries. The scale bar is 100 µm. (R) The quantification of total LC3 levels in the ligated mouse common carotid arteries (n = 6 mice). Data are shown as mean ± SD (*p < 0.05 vs. miR-Control antagomir group, two-tailed unpaired t-test). Normal mouse IgG was used as a negative control. MFI: mean fluorescent intensity.
Fig. 7
Fig. 7
Overexpression of hsa_circ_0001402 increases FKBPL and BECN1 levels by sponging miR-183-5p. (A) qRT-PCR analysis of miR-183-5p expression in HASMCs transfected with the expression vector of hsa_circ_Control or hsa_circ_0001402, normalized to U6. Data are shown as mean ± SD (n = 12, ***p < 0.001 vs. hsa_circ_Control group, two-tailed unpaired t-test). (B) The binding site between hsa_circ_0001402 and miR-183-5p. (C) Dual-luciferase reporter gene analysis of the interaction between hsa_circ_0001402 and miR-183-5p. Data are shown as mean ± SD [n = 6, **p < 0.01, two-tailed unpaired t-test (left), two-tailed Mann-Whitney U test (right)]. (D-E) Western blot analysis of PCNA, MMP9, and MMP2 in HASMCs co-transfected with hsa_circ_0001402 expression vector and either miRNA-Control or miR-183-5p mimic for 48 h. Data are shown as mean ± SD (n = 4, *p < 0.05, **p < 0.01 vs. control group, two-tailed paired t-test). (F) EdU incorporation analysis of DNA synthesis in MOVAS cells co-transfected with hsa_circ_0001402 expression vector and either miRNA-Control or miR-183-5p mimic for 48 h. Blue fluorescence (Hoechst 33342) represents the cell nuclei, while red fluorescence (EdU) represents MOVAS cells with DNA synthesis. The scale bar is 10 µm. (G) The proportion of EdU-positive MOVAS cells. Data are shown as mean ± SD (n = 6, ***p < 0.001 vs. control group, two-tailed unpaired t-test). (H) CCK-8 analysis of cell viability of MOVAS cells co-transfected with hsa_circ_0001402 expression vector and either miRNA-Control or miR-183-5p mimic. Data are shown as mean ± SD (n = 9, **p < 0.01, ***p < 0.001 vs. control group at the corresponding point in time, two-way ANOVA followed by Sidak's multiple comparisons test). (I) Migration analysis of MOVAS cells co-transfected with hsa_circ_0001402 expression vector and either miRNA-Control or miR-183-5p mimic. The scale bar is 500 µm. (J) Quantify the migration area using ImageJ. Data are shown as mean ± SD (n = 4, *p < 0.05, **p < 0.01, two-tailed unpaired t-test). (K-L) Western blot analysis of FKBPL and p21 after 48 h of transfection of the expression vector of hsa_circ_Control or hsa_circ_0001402 in HASMCs. Data are shown as mean ± SD (n = 3, *p < 0.05 vs. hsa_circ_Control group, two-tailed paired t-test). (M) Overexpression of hsa_circ_0001402 competitively binds to miR-183-5p to reduce the latter's inhibition of FKBPL-WT luciferase activity. Data are shown as mean ± SD (n = 6, ***p < 0.001, one-way ANOVA followed by Tukey's multiple comparisons test). (N) EdU incorporation analysis of DNA synthesis in MOVAS cells co-transfected with hsa_circ_0001402 expression vector and either Control or Fkbpl siRNA for 48 h. Blue fluorescence (Hoechst 33342) represents the cell nuclei, while red fluorescence (EdU) represents MOVAS cells with DNA synthesis. The scale bar is 10 µm. (O) The proportion of EdU-positive MOVAS cells. Data are shown as mean ± SD (n = 6, ***p < 0.001 vs. siRNA-Control group, two-tailed unpaired t-test). (P) CCK-8 analysis of cell viability of MOVAS cells co-transfected with hsa_circ_0001402 expression vector and either Control or Fkbpl siRNA. Data are shown as mean ± SD (n = 9, ***p < 0.001 vs. siRNA-Control group at the corresponding point in time, two-way ANOVA followed by Sidak's multiple comparisons test). (Q) Migration analysis of MOVAS cells co-transfected with hsa_circ_0001402 expression vector and either Control or Fkbpl siRNA. The scale bar is 500 µm. (R) Quantify the migration area using ImageJ. Data are shown as mean ± SD (n = 4, **p < 0.01, two-tailed unpaired t-test). (S-T) Western blot analysis of LC3 in MOVAS cells co-transfected with hsa_circ_0001402 expression vector and either miRNA-Control or miR-183-5p mimic for 48 h. Data are shown as mean ± SD (n = 4, *p < 0.05, ***p < 0.001 vs. control group, two-tailed paired t-test). (U) TEM analysis of autolysosomes in MOVAS cells co-transfected with hsa_circ_0001402 expression vector and either miRNA-Control or miR-183-5p mimic for 48 h. The scale bar is 1 μm. (V) Quantify the number of autolysosomes. Data are shown as mean ± SD (n = 6, *p < 0.05 vs. control group, two-tailed paired t-test). (W) Western blot analysis of BECN1 after 48 h of transfection of the expression vector of hsa_circ_Control or hsa_circ_0001402 in HASMCs. Data are shown as mean ± SD (n = 3, *p < 0.05 vs. hsa_circ_Control group, two-tailed paired t-test). (X) Overexpression of hsa_circ_0001402 competitively binds to miR-183-5p to reduce the latter's inhibition of BECN1-WT luciferase activity. Data are shown as mean ± SD (n = 6, *p < 0.05, **p < 0.01, Kruskal-Wallis test followed by Dunn's multiple comparisons test). (For interpretation of the references to colour in this figure legend, the reader is referred to the web version of this article.)
Fig. 8
Fig. 8
Overexpression of hsa_circ_0001402 alleviates neointimal hyperplasia by increasing FKBPL and BECN1 levels. (A) The cross-sectional H&E staining images of the ligated mouse common carotid arteries after 21 days of treatment with Sham Control, hsa_circ_Control lentivirus, or hsa_circ_0001402 lentivirus. The scale bar is 100 µm. (B) Morphometric measurement of the intimal/media ratio in the mouse common carotid arterial sections (n = 4 mice). Data are shown as mean ± SD (**p < 0.01, ***p < 0.001, one-way ANOVA followed by Tukey's multiple comparisons test). (C) Immunofluorescence of FKBPL after 21 days of in situ delivery of hsa_circ_Control or hsa_circ_0001402 lentivirus in ligated mouse common carotid arteries. The scale bar is 100 µm. (D) The quantification of FKBPL levels in the ligated mouse common carotid arteries (n = 4 mice). Data are shown as mean ± SD (*p < 0.05 vs. hsa_circ_Control lentivirus group, two-tailed unpaired t-test). (E) Immunofluorescence of p21 after 21 days of in situ delivery of hsa_circ_Control or hsa_circ_0001402 lentivirus in ligated mouse common carotid arteries. The scale bar is 100 µm. (F) The quantification of p21 levels in the ligated mouse common carotid arteries (n = 4 mice). Data are shown as mean ± SD (**p < 0.01 vs. hsa_circ_Control lentivirus group, two-tailed unpaired t-test). (G) Immunofluorescence of PCNA after 21 days of in situ delivery of hsa_circ_Control or hsa_circ_0001402 lentivirus in ligated mouse common carotid arteries. The scale bar is 100 µm. (H) The quantification of PCNA levels in the ligated mouse common carotid arteries (n = 4 mice). Data are shown as mean ± SD (*p < 0.05 vs. hsa_circ_Control lentivirus group, two-tailed unpaired t-test). (I) Immunofluorescence of MMP9 after 21 days of in situ delivery of hsa_circ_Control or hsa_circ_0001402 lentivirus in ligated mouse common carotid arteries. The scale bar is 100 µm. (J) The quantification of MMP9 levels in the ligated mouse common carotid arteries (n = 4 mice). Data are shown as mean ± SD (**p < 0.01 vs. hsa_circ_Control lentivirus group, two-tailed unpaired t-test). (K) Immunofluorescence of MMP2 after 21 days of in situ delivery of hsa_circ_Control or hsa_circ_0001402 lentivirus in ligated mouse common carotid arteries. The scale bar is 100 µm. (L) The quantification of MMP2 levels in the ligated mouse common carotid arteries (n = 4 mice). Data are shown as mean ± SD (*p < 0.05 vs. hsa_circ_Control lentivirus group, two-tailed unpaired t-test). (M) Immunofluorescence of BECN1 after 21 days of in situ delivery of hsa_circ_Control or hsa_circ_0001402 lentivirus in ligated mouse common carotid arteries. The scale bar is 100 µm. (N) The quantification of BECN1 levels in the ligated mouse common carotid arteries (n = 4 mice). Data are shown as mean ± SD (*p < 0.05 vs. hsa_circ_Control lentivirus group, two-tailed unpaired t-test). (O) Immunofluorescence of p62 after 21 days of in situ delivery of hsa_circ_Control or hsa_circ_0001402 lentivirus in ligated mouse common carotid arteries. The scale bar is 100 µm. (P) The quantification of p62 levels in the ligated mouse common carotid arteries (n = 4 mice). Data are shown as mean ± SD (*p < 0.05 vs. hsa_circ_Control lentivirus group, two-tailed unpaired t-test). (Q) Immunofluorescence of total LC3 after 21 days of in situ delivery of hsa_circ_Control or hsa_circ_0001402 lentivirus in ligated mouse common carotid arteries. The scale bar is 100 µm. (R) The quantification of total LC3 levels in the ligated mouse common carotid arteries (n = 4 mice). Data are shown as mean ± SD (*p < 0.05 vs. hsa_circ_Control lentivirus group, two-tailed unpaired t-test). Normal mouse IgG was used as a negative control. MFI: mean fluorescent intensity.

References

    1. Huxley R.R., Perkovic V. The modifiable burden of worldwide mortality from cardiovascular diseases. Lancet Diabetes Endocrinol. 2014 doi: 10.1016/S2213-8587(14)70040-3. - DOI - PubMed
    1. Melnik T., Jordan O., Corpataux J.M., Delie F., Saucy F. Pharmacological prevention of intimal hyperplasia: A state-of-the-art review. Pharmacol Ther. 2022 doi: 10.1016/j.pharmthera.2022.108157. - DOI - PubMed
    1. Newby A.C., Zaltsman A.B. Molecular mechanisms in intimal hyperplasia. J Pathol. 2000 doi: 10.1002/(SICI)1096-9896(200002)190:3<300::AID-PATH596>3.0.CO;2-I. - DOI - PubMed
    1. Bennett M.R., Sinha S., Owens G.K. Vascular Smooth Muscle Cells in Atherosclerosis. Circ Res. 2016 doi: 10.1161/CIRCRESAHA.115.306361. - DOI - PMC - PubMed
    1. Owens G.K., Kumar M.S., Wamhoff B.R. Molecular regulation of vascular smooth muscle cell differentiation in development and disease. Physiol Rev. 2004 doi: 10.1152/physrev.00041.2003. - DOI - PubMed

LinkOut - more resources