. 2023 Jul 27;14(1):4524.
doi: 10.1038/s41467-023-40170-8.

A small molecule inhibitor of PTP1B and PTPN2 enhances T cell anti-tumor immunity

Affiliations

A small molecule inhibitor of PTP1B and PTPN2 enhances T cell anti-tumor immunity

Shuwei Liang et al. Nat Commun. .

Abstract

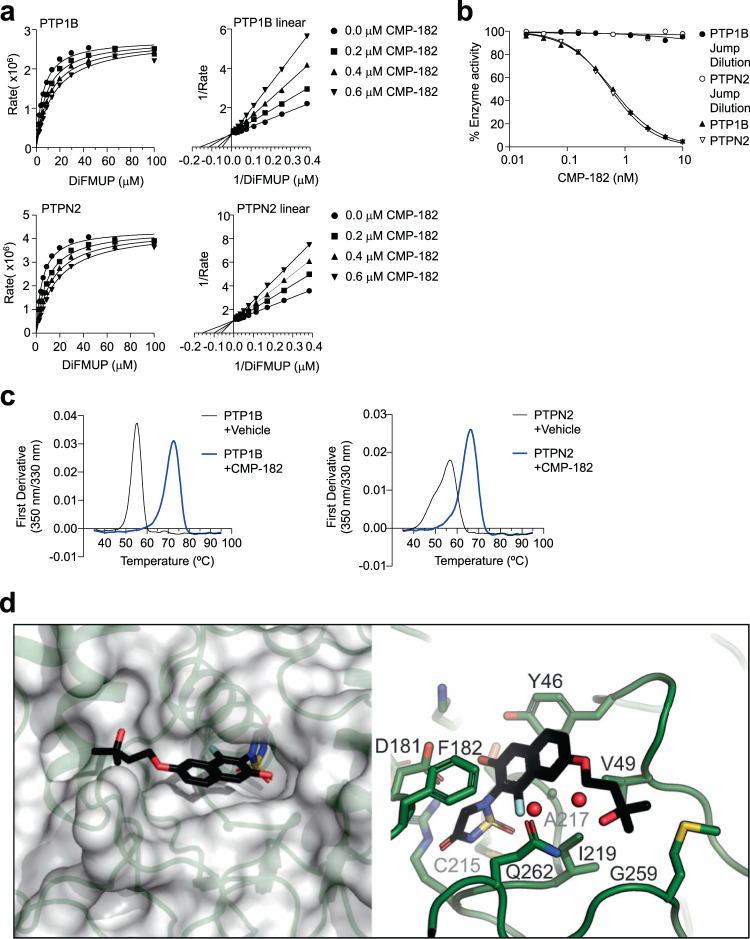
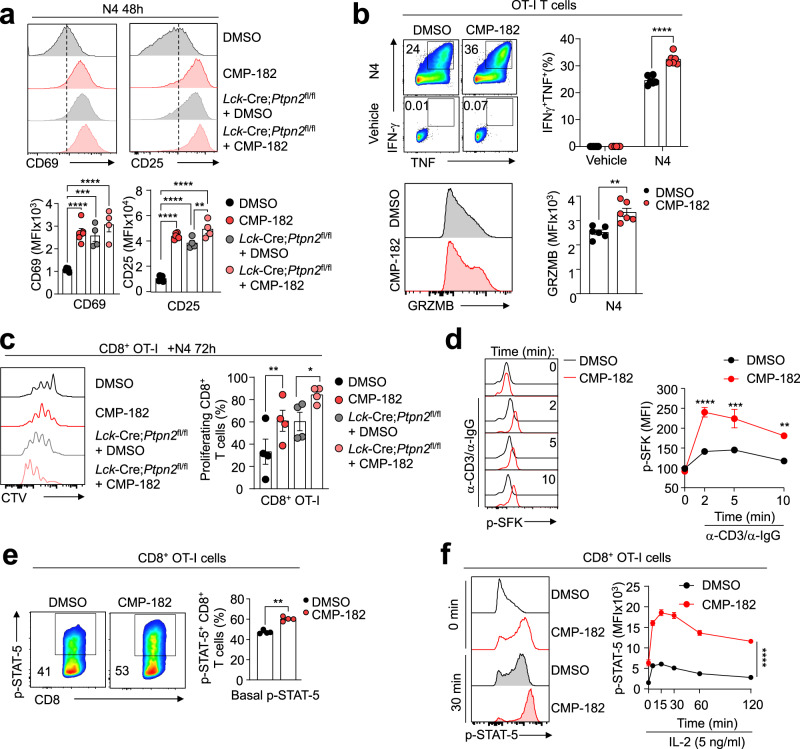
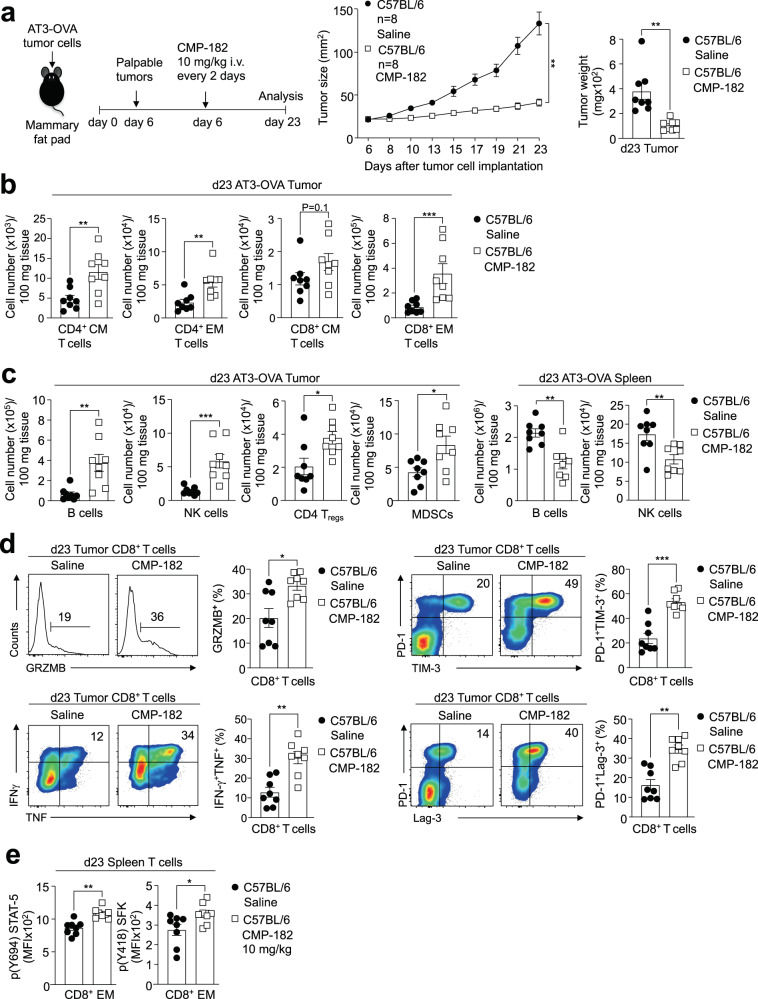
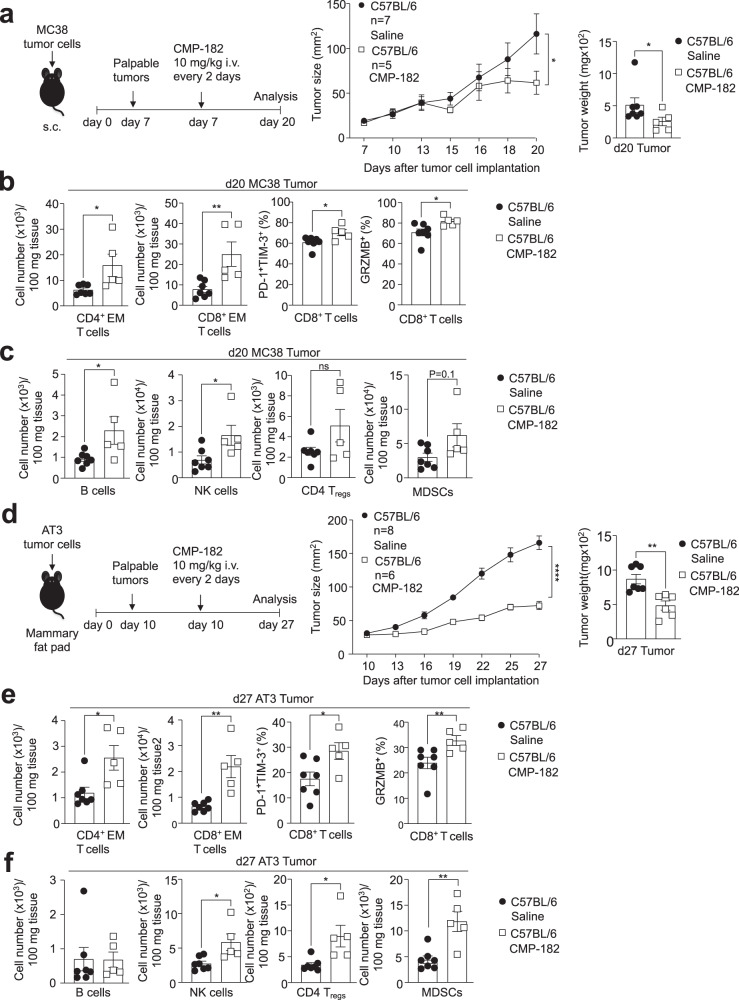
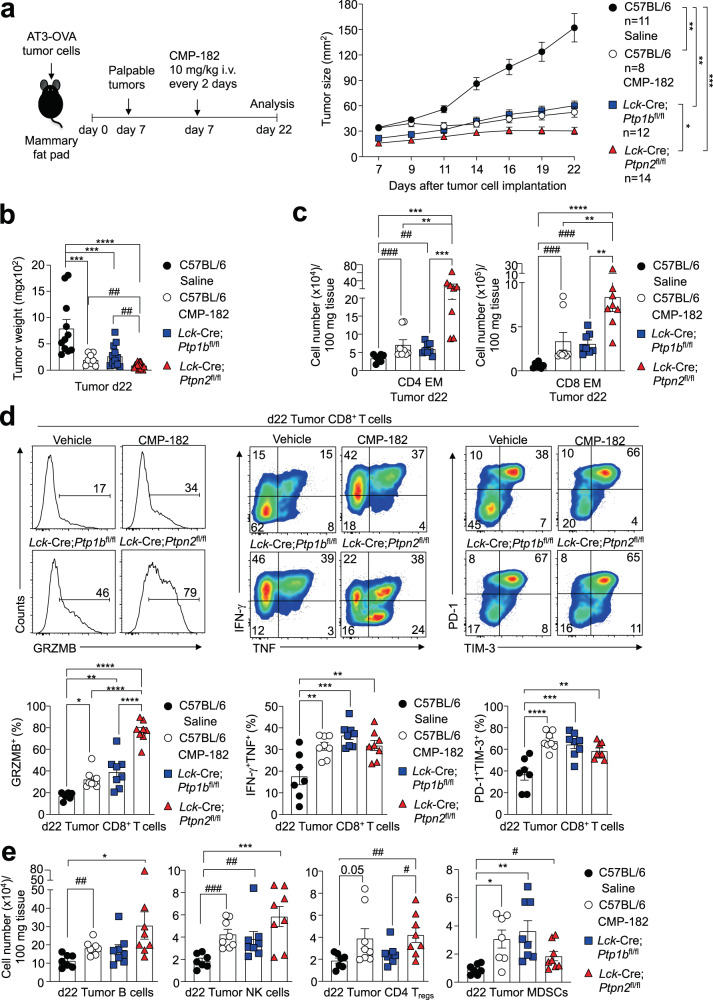
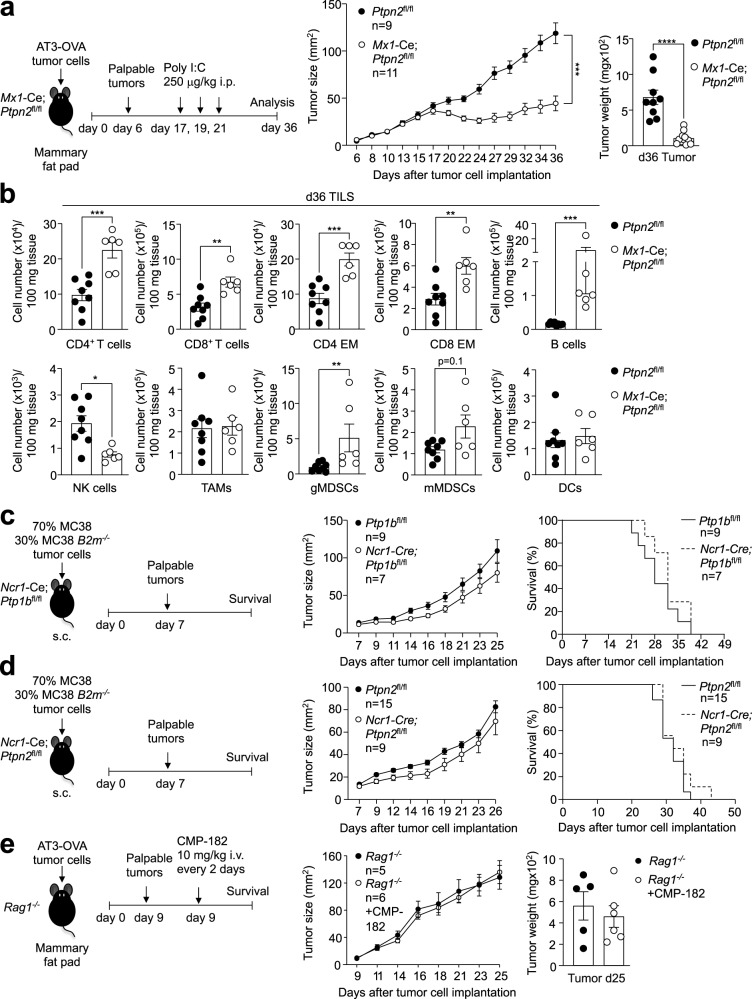
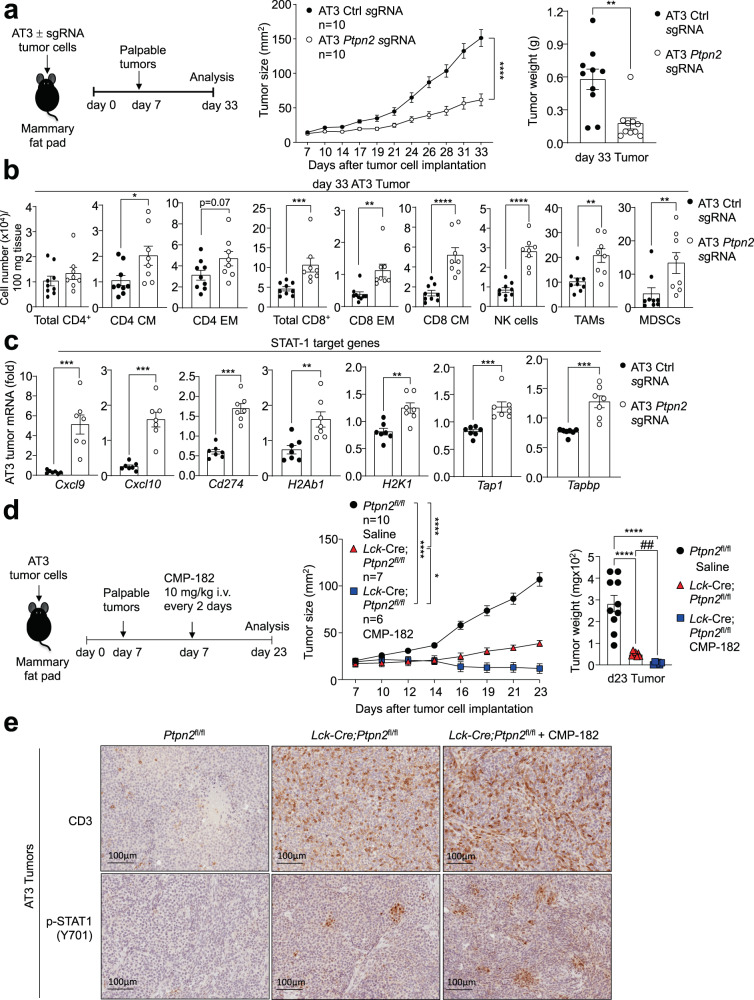
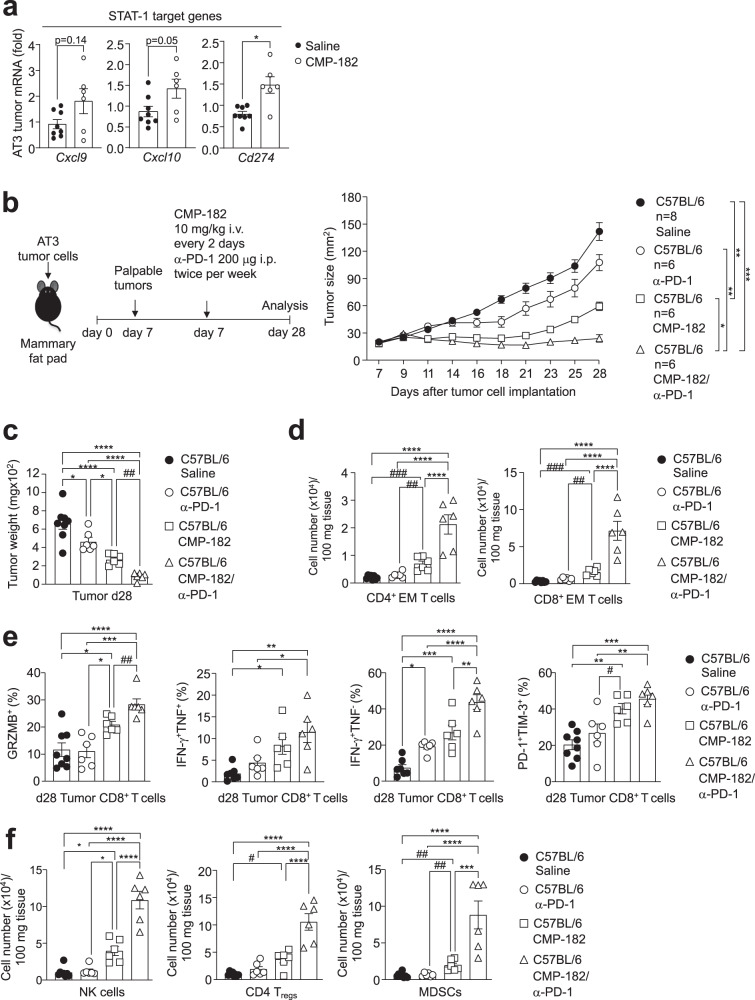
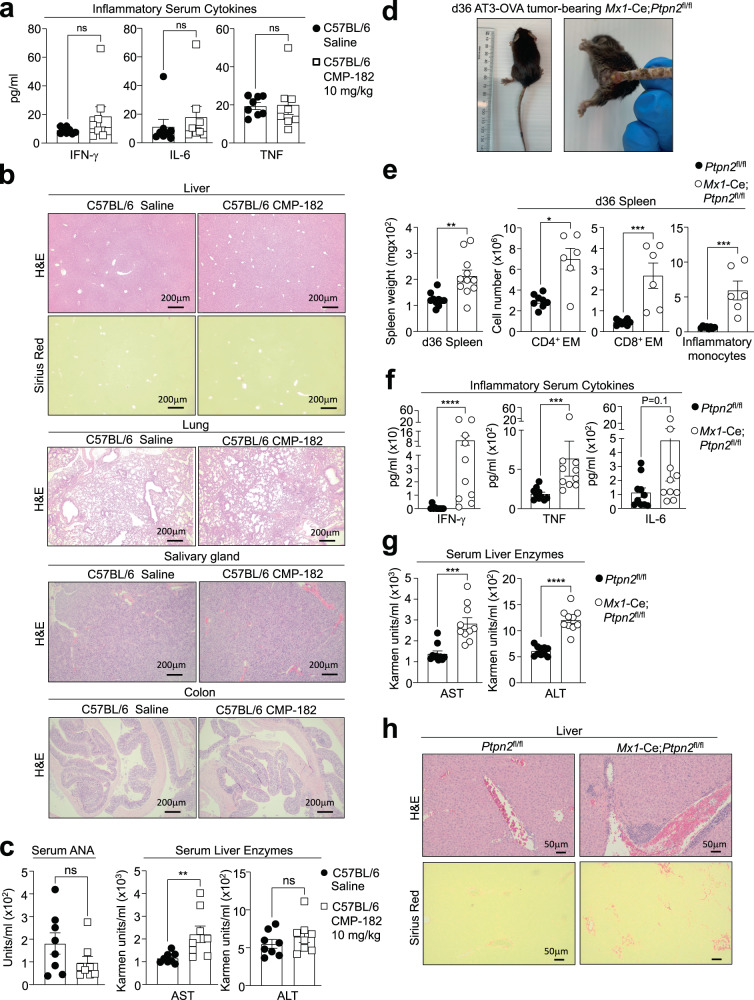
The inhibition of protein tyrosine phosphatases 1B (PTP1B) and N2 (PTPN2) has emerged as an exciting approach for bolstering T cell anti-tumor immunity. ABBV-CLS-484 is a PTP1B/PTPN2 inhibitor in clinical trials for solid tumors. Here we have explored the therapeutic potential of a related small-molecule-inhibitor, Compound-182. We demonstrate that Compound-182 is a highly potent and selective active site competitive inhibitor of PTP1B and PTPN2 that enhances T cell recruitment and activation and represses the growth of tumors in mice, without promoting overt immune-related toxicities. The enhanced anti-tumor immunity in immunogenic tumors can be ascribed to the inhibition of PTP1B/PTPN2 in T cells, whereas in cold tumors, Compound-182 elicited direct effects on both tumor cells and T cells. Importantly, treatment with Compound-182 rendered otherwise resistant tumors sensitive to α-PD-1 therapy. Our findings establish the potential for small molecule inhibitors of PTP1B and PTPN2 to enhance anti-tumor immunity and combat cancer.


Conflict of interest statement

F.W. and T.T. are inventors on pending patents related to this work filed by Monash University and the Peter MacCallum Cancer Centre. T.T. is on the scientific advisory board of DepYmed. Z.Y.Z. is a co-founder and serves on the scientific advisory board of Tyligand Bioscience. N.D.H. is a founder and shareholder in oNKo-Innate. N.D.H. serves on an advisory board for Bristol Myers Squibb. The remaining authors declare no competing interests.

Figures

Fig. 1
Fig. 1. Compound 182 is a reversible, competitive, active site inhibitor of PTP1B and PTPN2.
a, b Effect of Compound 182 (CMP-182) on PTP1B- and PTPN2-catalyzed 6,8-Difluoro-4-methylumbelliferyl phosphate (DiFMUP) hydrolysis. In (a) CMP-182 concentrations were 0 (●), 0.2 (■), 0.4(▲), and 0.6 nM (▼), respectively. b PTP1B- (●) and PTPN2- (o) catalyzed DiFMUP hydrolysis before and after jump dilution. c nanoDSF thermal shift first-derivative curves of 5 µM PTP1B or PTPN2 (black) and 5 µM PTP1B or PTPN2 + 50 µM CMP-182 (blue). d The structure of CMP-182 bound to PTP1B. Left, CMP-182 (stick representation) is shown bound to PTP1B (semi-transparent surface). The thiadiazolidinone group mimics phosphotyrosine (pTyr) and is located deep in the active site, while the tail of CMP-182 is located in a shallow groove on the surface of the protein. Right, close-up view of CMP-182 in the active site. The thiadiazolidinone moiety lies above the catalytic Cys215. The napthalene core of the compound sits on a hydrophobic surface of the protein with Phe182 from the WPD loop closed over the top. The methyl-butoxy tail is directed towards Gly259. In (ac) representative results from two independent experiments are shown.
Fig. 2
Fig. 2. Compound 182 promotes T cell signaling.
a OT-I cells isolated from wild type OT-I;Ptpn2fl/fl (n = 5–6) versus OT-I;Lck-Cre;Ptpn2fl/fl (n = 4) mice were stimulated with 1 nM of the cognate ovalbumin (OVA) peptide antigen SIINFEKL (N4) in the presence of vehicle (1% v/v DMSO) or Compound 182 (CMP-182; 1 μM) for 48 h and CD25 and CD69 mean fluorescent intensities (MFIs) in CD8+ OT-I cells were determined by flow cytometry. b OT-I cells (n = 6) were activated with 1 nM N4 for 16 h and rested in media supplemented with IL-2 (5 ng/ml) and IL-7 (0.2 ng/ml) for 2 days. On day 3, T cells were pre-treated with vehicle or 1 μM CMP-182 overnight and stimulated with 1 nM N4 plus/minus 1 μM CMP-182 in the presence of GolgiPlug™/GolgiStop™. IFN-γ+, TNF+ or Granzyme B+ (GRZMB) CD8+ T cells were analyzed by flow cytometry. c OT-I T cells isolated from wild-type OT-I; Ptpn2fl/fl (n = 4) versus OT-I;Lck-Cre; Ptpn2fl/fl (n = 4) mice were stained with CTV and stimulated with 0.5 nM N4 plus/minus 1 μM CMP-182 for 3 days and CTV dilution monitored by flow cytometry. d Naive CD8+ T cells (C57BL6) (n = 3) were preincubated with 10 μM CMP-182 for 4 h, the TCR cross-linked with α-mouse CD3ε (5 μg/ml) and goat anti-hamster IgG (20 μg/ml) and Y418 phosphorylated and activated SFK (p-SFK) MFIs determined by flow cytometry. e OT-I cells (C57BL/6) (n = 4) were stimulated with 1 nM N4 for 16 h, incubated plus/minus of 1 μM CMP-182 for 1 h and Y694 phosphorylated STAT-5 (p-STAT-5) in CD8+ OT-I cells assessed by flow cytometry. f OT-I cells (C57BL/6) (n = 6) were stimulated with 1 nM N4 for 16 h, incubated plus/minus 1 μM CMP-182 for 1 h, and then stimulated with IL-2 (5 ng/ml) plus/minus 1 μM CMP-182 and p-STAT-5 MFIs in CD8+ OT-I cells determined by flow cytometry. In (af) representative results (means ± SEM) from at least two independent experiments are shown. Significances in (a, c) were determined using a 1-way ANOVA Test and in (b, e) using a 2-tailed Mann-Whitney U Test. In (d, f) significances were determined using a 2-way ANOVA Test.
Fig. 3
Fig. 3. Compound 182 represses AT3-OVA mammary tumor growth.
AT3-OVA mammary tumor cells were injected into the fourth inguinal mammary fat pads of 8-week-old C57BL/6 female mice. Mice were treated with Compound 182 (CMP-182; 10 mg/kg i.v.; n = 8) or saline (n = 8) on days (d) 6, 8, 10, 12, 14, 16, 18 and 21 after tumor cell implantation. a Tumor growth was monitored and tumor weights measured. b, c Tumor-infiltrating lymphocytes or splenocytes including CD44hiCD62Lhi CD8+ and CD4+ central memory (CM) T cells, CD44hiCD62Llo CD8+ and CD4+ effector/memory (EM) T cells, CD19+ B cells, NK1.1+TCRβ (NK) cells, CD4+CD25+FoxP3+ regulatory T cells (Tregs) and granulocytic and monocytic CD11b+F4/80hi/loLy6C+Ly6G+/−myeloid-derived suppressor cells (MDSCs) were analyzed by flow cytometry. d Tumor-infiltrating T cells from (a) were stimulated with PMA/Ionomycin in the presence of Golgi Stop/Plug and stained for intracellular IFN-γ and TNF. Intracellular granzyme B (GRZMB), surface PD-1, TIM-3, and Lag-3 were detected in unstimulated tumor-infiltrating CD8+ T cells. e p-STAT-5 and p-SFK MFIs were assessed in splenic CD8 + EM T cells. In (ae) representative results (means ± SEM) from at least two independent experiments are shown. Significance for tumor sizes in (a) was determined using a 2-way ANOVA Test and for tumor weights in (a) using a 2-tailed Mann-Whitney U Test. In (be) significances were determined using a 2-tailed Mann–Whitney U Test.
Fig. 4
Fig. 4. Compound 182 represses MC38 and AT3 tumor growth.
ac MC38 colon tumor cells were xenografted into the flanks of 8-week-old C57BL/6 male mice. Mice were treated with Compound 182 (CMP-182; 10 mg/kg i.v.; n = 5) or saline (n = 7) on days (d) 7, 9, 11, 13, 15, 17, and 19 after tumor cell implantation. a Tumor growth was monitored and tumor weights were measured. b, c Tumor-infiltrating lymphocytes (TILs) including CD44hiCD62Llo CD8+ and CD4+ effector/memory (EM) T cells, CD19+ B cells, NK1.1+TCRβ (NK) cells, CD4+CD25+FoxP3+ regulatory T cells (Tregs) and granulocytic and monocytic CD11b+F4/80hi/loLy6C+Ly6G+/− myeloid-derived suppressor cells (MDSCs) were analyzed by flow cytometry. In (b) intracellular granzyme B (GRZMB) and cell surface PD-1 and TIM-3 were detected in unstimulated tumor-infiltrating CD8+ T cells. df AT3 mammary tumor cells were injected into the fourth inguinal mammary fat pads of 8-week-old C57BL/6 female mice. Mice were treated with CMP-182 (10 mg/kg i.v.; n = 6) or saline (n = 8) on days (d) 10, 12, 14, 16, 18, 20, 22, 24, and 26 after tumor cell implantation. d Tumor growth was monitored and tumor weights measured. e, f TILs (CMP-182: n = 5; Saline: n = 7) including CD4+ EM T cells, CD19+ B cells, NK cells, Tregs and MDSCs were analyzed by flow cytometry. In (e) intracellular GRZMB and cell surface PD-1 and TIM-3 were detected in unstimulated tumor-infiltrating CD8+ T cells. In (af) representative results (means ± SEM) from at least two independent experiments are shown. Significance for tumor sizes in (a, d) was determined using a 2-way ANOVA Test and for tumor weights in (a, d) using a 2-tailed Mann–Whitney U Test. In (b, c, e, f) significances were determined using a 2-tailed Mann–Whitney U Test.
Fig. 5
Fig. 5. Comparable anti-tumor immunity induced by Compound 182 and the deletion of PTP1B or PTPN2 in T cells.
AT3-OVA mammary tumor cells were injected into the fourth inguinal mammary fat pads of 8-week-old C57BL/6 (n = 8–11 in each group), Lck-Cre;Ptp1bfl/fl (C57BL/6) (n = 12) and Lck-Cre;Ptpn2fl/fl (C57BL/6) (n = 14) female mice. Mice were treated with Compound 182 (CMP-182; 10 mg/kg i.v.; n = 8) or saline (n = 11) on days (d) 7, 9, 11, 13, 15, 17, 19, and 21 after tumor cell implantation. a Tumor growth was monitored and b tumor weights were measured. ce Tumor-infiltrating lymphocytes (TILs) (CMP-182: n = 8; Saline: n = 7; Lck-Cre;Ptp1bfl/fl: n = 8; Lck-Cre;Ptpn2fl/fl: n = 8) including CD44hiCD62Llo CD8+ and CD4+ effector/memory (EM) T cells, CD19+ B cells, NK1.1+TCRβ (NK) cells, CD4+CD25+FoxP3+ regulatory T cells (Tregs) and granulocytic and monocytic CD11b+F4/80hi/loLy6C+Ly6G+/−myeloid-derived suppressor cells (MDSCs) were analyzed by flow cytometry. In (d) Tumor-infiltrating T cells were stimulated with PMA/Ionomycin in the presence of Golgi Stop/Plug and stained for intracellular IFN-γ and TNF. Intracellular granzyme B (GRZMB), surface PD-1 and TIM-3 were detected in unstimulated tumor-infiltrating CD8+ T cells. In (ae) representative results (means ± SEM) from at least two independent experiments are shown. Significance for tumor sizes in (a) was determined using a 2-way ANOVA Test and for tumor weights in (b) and for TILs in (ce) using a 1-way ANOVA Test. In (b, c, e) significances were determined using a 2-tailed Mann–Whitney U Test (#p < 0.05, ##p < 0.01, ###p < 0.001) where indicated.
Fig. 6
Fig. 6. The effects of Compound 182 on anti-tumor immunity are reliant on T cells but not NK cells.
AT3-OVA mammary tumor cells were injected into the fourth inguinal mammary fat pads of 8-week-old Mx1-Cre;Ptpn2fl/fl (C57BL/6) female mice (n = 9-11 in each group). Mice were treated with poly I:C (250 μg/kg i.v.) to inducibly delete PTPN2 on days (d) 17, 19, and 21 after tumor cell implantation. a Tumor growth was monitored and tumor weights were measured. b Tumor-infiltrating lymphocytes (TILs) (Ptpn2fl/fl: n = 8; Mx1-Cre;Ptpn2fl/fl: n = 6) including CD4+ and CD8+ T cells, CD44hiCD62Llo CD8+ and CD4+ effector/memory (EM) T cells, CD19+ B cells, NK1.1+TCRβ (NK) cells, CD11b+F4/80hiLy6CLy6Gtumor-associated macrophages (TAMs), granulocytic CD11b+F4/80hi/loLy6CintLy6G+(gMDSCs) and monocytic CD11b+F4/80hi/lo Ly6C+Ly6G(mMDSCs) myeloid-derived suppressor cells and CD11c+ (DCs) dendritic cells were analyzed by flow cytometry. c, d Wild type MC38 (70%) and B2m−/− MC38 (30%) tumor cells were xenografted into the flanks (subcutaneous; s.c.) of either 8-week-old c) Ncr1-Cre;Ptp1bfl/fl (C57BL/6) or d) 8 week-old Ncr1-Cre;Ptpn2fl/fl (C57BL/6) male mice or the corresponding floxed control mice and tumor growth and survival (Ptp1bfl/fl: n = 9; Ncr-Cre;Ptp1bfl/fl: n = 7; Ptpn2fl/fl: n = 15; Ncr1-Cre;Ptpn2fl/fl: n = 9) monitored. e AT3-OVA mammary tumor cells were injected into the fourth inguinal mammary fat pads of 8-week-old Rag1−/− (C57BL/6) female mice. Mice were treated with Compound 182 (CMP-182; 10 mg/kg i.v.; n = 6) or saline (n = 6) on days 9, 11, 13, 15, 17, 19, and 21 after tumor cell implantation and tumor growth was monitored. In (ae) representative results (means ± SEM) from at least two independent experiments are shown. Significance for tumor sizes in (a, ce) was determined using a 2-way ANOVA Test and for tumor weights in (a) using a 2-tailed Mann–Whitney U Test. In (b) significance was determined using a 2-tailed Mann–Whitney U Test.
Fig. 7
Fig. 7. Effects of Compound 182 on AT3-OVA mammary tumor growth, STAT-1 signaling and T cell infiltrates in Lck-Cre;Ptpn2fl/fl mice.
af AT3-OVA mammary tumor cells were injected into the fourth inguinal mammary fat pads of 8 week-old Ptpn2fl/fl (n = 6) and Lck-Cre;Ptpn2fl/fl (C57BL/6) (n = 5-6 in each group) female mice. Mice were treated with Compound 182 (CMP-182; 10 mg/kg i.v.; n = 6) or saline (n = 6) on days (d) 7, 9, 11, 13, 15, 17, 19 and 21 after tumor cell implantation. a Tumor growth was monitored and b tumor weights were measured. c Tumor-infiltrating lymphocytes including CD44hiCD62Llo CD8+ and CD4+ effector/memory (EM) T cells, CD19+ B cells, NK1.1+TCRβ (NK) cells, CD4+CD25+FoxP3+ regulatory T cells (Tregs) and granulocytic and monocytic CD11b+F4/80hi/loLy6C+Ly6G+/−myeloid-derived suppressor cells (MDSCs) were analyzed by flow cytometry. d Tumor-infiltrating T cells from (a) were stimulated with PMA/Ionomycin in the presence of Golgi Stop/Plug and stained for intracellular IFN-γ and TNF. Intracellular granzyme B (GRZMB) was detected in unstimulated tumor-infiltrating CD8+ T cells. AT3-OVA tumors were processed for e immunohistochemistry staining for p-STAT-1, or CD3 (counterstained with hematoxylin) or f qPCR monitoring for the expression of STAT-1 target genes. g AT3-OVA mammary tumor cells were injected into the fourth inguinal mammary fat pads of C57BL/6 mice. Mice were treated with CMP-182 (10 mg/kg i.v.) or saline on days 6, 8, 10, 12, 14, 16, 18, and 21 after tumor cell implantation; the resultant tumor growth curves are shown in Fig. 4a. The resulting AT3-OVA tumors were processed for immunohistochemistry staining for STAT-1 Y701 phosphorylation (p-STAT-1), or CD3 (counterstained with hematoxylin). In (ad, f) representative results (means ± SEM) from at least two independent experiments are shown. In (e, g) micrographs are representative of two independent experiments with 5 mice per group. Significance for tumor sizes in (a) was determined using a 2-way ANOVA Test and for tumor weights in (b) using a 1-way ANOVA Test. In (c, d) significances were determined using a 1-way ANOVA Test and a 2-tailed Mann–Whitney U Test (#p < 0.05, ##p < 0.01) where indicated. In (f) significances were determined using a 1-way ANOVA Test.
Fig. 8
Fig. 8. Compound 182 promotes STAT-1 signaling and increases T cell infiltrates in AT3 tumors.
a AT3 control cells (Ctl sgRNA: n = 10) or those in which PTPN2 had been deleted by CRISPR RNP (Ptpn2 sgRNA: n = 10) were injected into the fourth inguinal mammary fat pads of 8-week-old female C57BL/6 mice and tumor growth was monitored. b Tumor-infiltrating lymphocytes (Ctl sgRNA: n = 9; Ptpn2 sgRNA: n = 8) including total CD4+ and CD8+ T cells, CD44hiCD62Lhi CD8+ and CD4+ central memory (CM) T cells, CD44hiCD62Llo CD8+ and CD4+ effector/memory (EM) T cells, NK1.1+TCRβ (NK) cells, CD11b+F4/80hiLy6CLy6Gtumor-associated macrophages (TAMs) and granulocytic and monocytic CD11b+F4/80hi/loLy6C+Ly6G+/−myeloid-derived suppressor cells (MDSCs) were analyzed by flow cytometry. c AT3 tumors were processed for qPCR monitoring for the expression of STAT-1 target genes (Ctl sgRNA: n = 7; Ptpn2 sgRNA: n = 7). d, e AT3 mammary tumor cells were injected into the fourth inguinal mammary fat pads of 8 week-old Ptpn2fl/fl (n = 10) and Lck-Cre;Ptpn2fl/fl (n = 6–7 per group) (C57BL/6) female mice. Mice were treated with CMP-182 (10 mg/kg i.v.; n = 6) or saline (n = 7) on days 7, 9, 11, 13, 15, 17, 19 and 21 after tumor cell implantation. d Tumor growth was monitored and tumor weights were measured. e The resulting AT3 tumors were processed for immunohistochemistry staining for p-STAT-1 (Y701) and CD3 (counterstained with hematoxylin). In (ad) representative results (means ± SEM) from at least two independent experiments are shown. In (e) micrographs are representative from two independent experiments with 5 mice per group. Significance for tumor sizes in (a, d) was determined using a 2-way ANOVA Test and for tumor weights in a) using a 2-tailed Mann–Whitney U Test and (d) using a 1-way ANOVA Test. In (b-c and where indicated by ## p < 0.01) significances were determined using a 2-tailed Mann–Whitney U Test.
Fig. 9
Fig. 9. Compound 182 sensitizes AT3 tumors to PD-1 checkpoint blockade.
a AT3 mammary tumor cells were injected into the fourth inguinal mammary fat pads of 8-week-old C57BL/6 female mice. Mice were treated with Compound 182 (CMP-182; 10 mg/kg i.v.; n = 6) or saline (n = 8) on days 10, 12, 14, 16, 18, 20, 22, 24, and 26 after tumor cell implantation; tumor growth curves are shown in Fig. 4d. The resulting AT3 tumors were processed for qPCR monitoring for the expression of STAT-1 target genes. bf AT3 mammary tumor cells were injected into the fourth inguinal mammary fat pads of 8-week-old C57BL/6 female mice (n = 6–8 per group). Mice were treated with CMP-182 (10 mg/kg i.v.; n = 6) or saline (n = 8) on days 7, 9, 11, 13, 15, 17, 19, 21, 23, 25, and 27 and α-PD-1 (n = 6) twice per week (200 μg i.p.) after tumor cell implantation. b Tumor growth was monitored and c tumor weights were measured. df Tumor-infiltrating lymphocytes including d, f CD44hiCD62Llo CD8+ and CD4+ effector/memory (EM) T cells, NK1.1+TCRβ (NK) cells, CD4+CD25+FoxP3+ regulatory T cells (Tregs) and granulocytic and monocytic CD11b+F4/80hi/loLy6C+Ly6G+/−myeloid-derived suppressor cells (MDSCs) were analyzed by flow cytometry. In (e) tumor-infiltrating T cells from (b) were stimulated with PMA/Ionomycin in the presence of Golgi Stop/Plug and stained for intracellular IFN-γ and TNF. Intracellular granzyme B (GRZMB), PD-1, and TIM-3 were detected in unstimulated tumor-infiltrating CD8+ T cells. In (af) representative results (means ± SEM) from at least two independent experiments are shown. Significance for tumor sizes in (b) was determined using a 2-way ANOVA Test and for tumor weights in (c) using a 1-way ANOVA Test. In (df) significances were determined using a 1-way ANOVA Test and a 2-tailed Mann–Whitney U Test (#p < 0.05, ##p < 0.01, ###p < 0.001) where indicated.
Fig. 10
Fig. 10. Compound 182 does not promote systemic inflammation and autoimmunity.
ac AT3-OVA mammary tumor cells were implanted into the fourth inguinal mammary fat pads of 8-week-old C57BL/6 female mice. Mice were treated with Compound 182 (CMP-182; 10 mg/kg i.v.; n = 8) or saline (n = 8) on days 6, 8, 10, 12, 14, 16, 18, and 21 after tumor cell implantation. a Serum cytokines were determined by flow cytometry using a BD Cytokine Bead Array (BD Biosciences. b Livers, lungs, salivary glands, and colons were fixed in formalin and processed for histological assessment (hematoxylin and eosin: H&E). Livers were also processed for Sirius Red staining. c Serum anti-nuclear antibodies (ANA) and serum liver enzymes AST and ALT in CMP-182-treated mice. dh AT3-OVA mammary tumor cells were implanted into the fourth inguinal mammary fat pads of Mx1-Cre;Ptpn2fl/fl mice. Mice were treated with poly I:C (250 μg/kg i.v.) to inducible delete PTPN2 on day 7, 9, and 11 after tumor cell implantation; the resultant tumor growth curves are shown in Fig. 6a. d Gross phenotype of Mx1-Cre;Ptpn2fl/fl mice. e Spleen weight (n = 9-11 per group) and splenic CD44hiCD62Llo CD8+ and CD4+ effector/memory (EM) T cells and inflammatory monocytes in Mx1-Cre;Ptpn2fl/fl (n = 6-8 per group) mice. f Serum cytokines in Mx1-Cre;Ptpn2fl/fl mice (n = 10 per group) were determined by flow cytometry using a BD Cytokine Bead Array (BD Biosciences). g Serum liver enzymes AST and ALT in Mx1-Cre;Ptpn2fl/fl mice (n = 10 per group). h Livers from Mx1-Cre;Ptpn2fl/fl mice were fixed in formalin and processed for histological assessment (hematoxylin and eosin: H&E; Sirius Red). In (a, c, eg) representative results (means ± SEM) from at least two independent experiments are shown. In (b and h) micrographs are representative of tissues from at least 5 mice per group. Significances were determined using a 2-tailed Mann–Whitney U Test.

Update of

Similar articles

Cited by

References

    1. Topalian SL, Drake CG, Pardoll DM. Immune checkpoint blockade: a common denominator approach to cancer therapy. Cancer Cell. 2015;27:450–461. doi: 10.1016/j.ccell.2015.03.001. - DOI - PMC - PubMed
    1. Zappasodi R, Merghoub T, Wolchok JD. Emerging concepts for immune checkpoint blockade-based combination therapies. Cancer Cell. 2018;33:581–598. doi: 10.1016/j.ccell.2018.03.005. - DOI - PMC - PubMed
    1. Bonaventura P, et al. Cold tumors: a therapeutic challenge for immunotherapy. Front Immunol. 2019;10:168. doi: 10.3389/fimmu.2019.00168. - DOI - PMC - PubMed
    1. Kalbasi A, Ribas A. Tumour-intrinsic resistance to immune checkpoint blockade. Nat. Rev. Immunol. 2020;20:25–39. doi: 10.1038/s41577-019-0218-4. - DOI - PMC - PubMed
    1. Sharma P, Hu-Lieskovan S, Wargo JA, Ribas A. Primary, adaptive, and acquired resistance to cancer immunotherapy. Cell. 2017;168:707–723. doi: 10.1016/j.cell.2017.01.017. - DOI - PMC - PubMed

Publication types

MeSH terms

Substances