. 2023 Jul 27;14(1):4539.
doi: 10.1038/s41467-023-40129-9.

MSBooster: improving peptide identification rates using deep learning-based features

Affiliations

MSBooster: improving peptide identification rates using deep learning-based features

Kevin L Yang et al. Nat Commun. .

Abstract

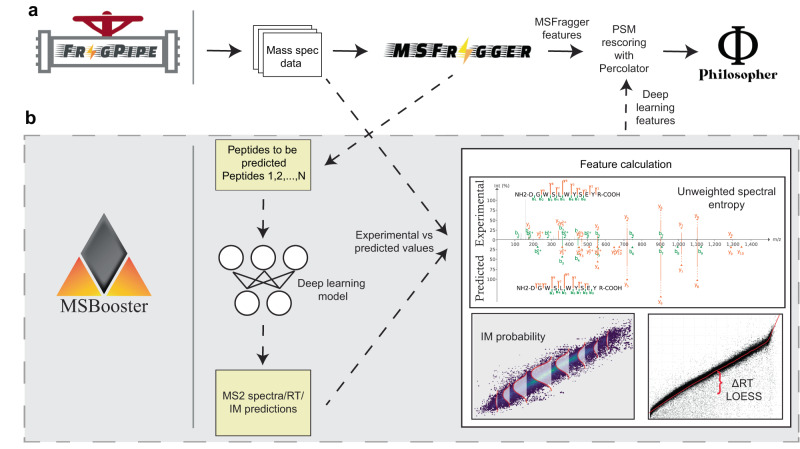
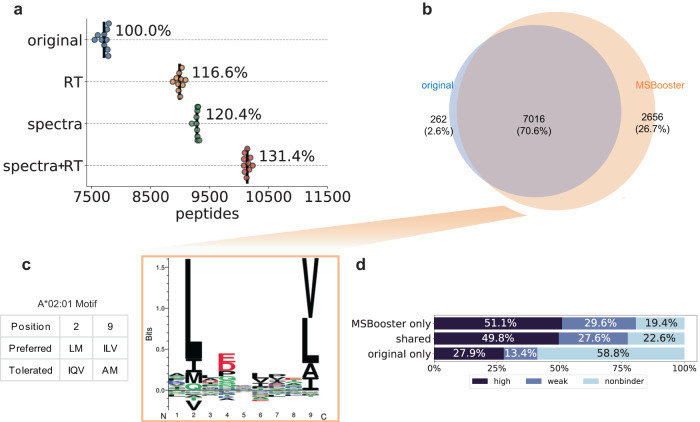
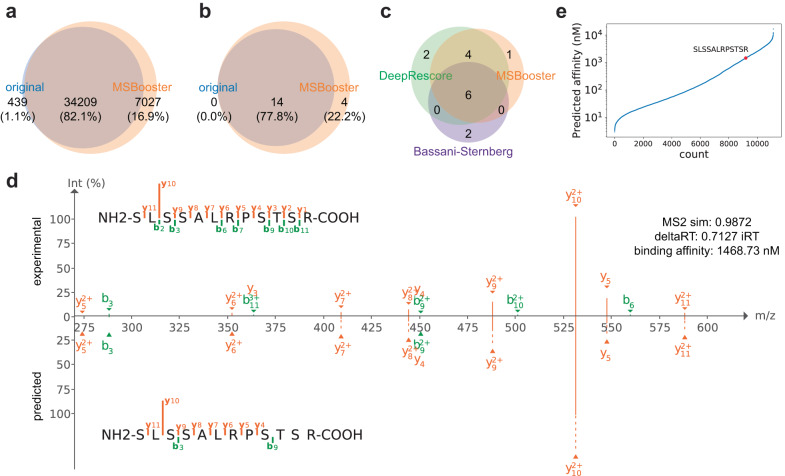
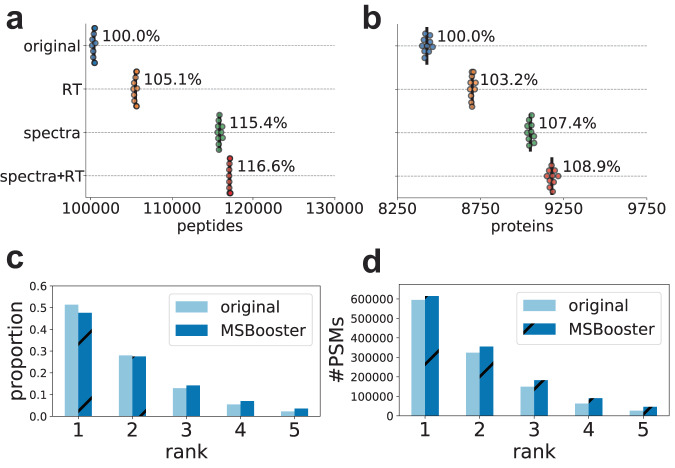
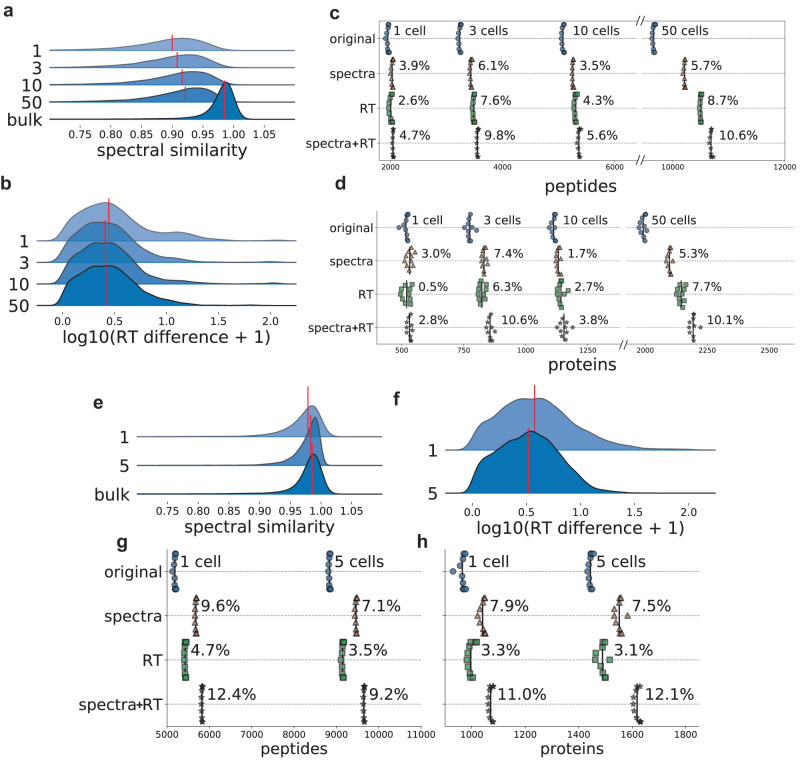
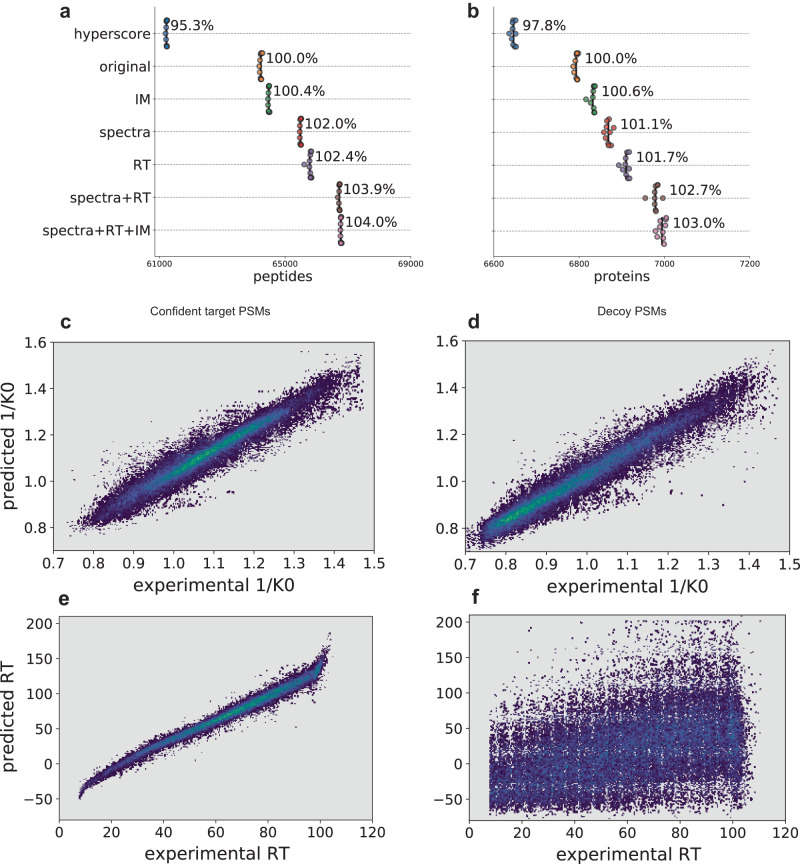
Peptide identification in liquid chromatography-tandem mass spectrometry (LC-MS/MS) experiments relies on computational algorithms for matching acquired MS/MS spectra against sequences of candidate peptides using database search tools, such as MSFragger. Here, we present a new tool, MSBooster, for rescoring peptide-to-spectrum matches using additional features incorporating deep learning-based predictions of peptide properties, such as LC retention time, ion mobility, and MS/MS spectra. We demonstrate the utility of MSBooster, in tandem with MSFragger and Percolator, in several different workflows, including nonspecific searches (immunopeptidomics), direct identification of peptides from data independent acquisition data, single-cell proteomics, and data generated on an ion mobility separation-enabled timsTOF MS platform. MSBooster is fast, robust, and fully integrated into the widely used FragPipe computational platform.


Conflict of interest statement

The authors declare no competing interests.

Figures

Fig. 1
Fig. 1. MSBooster workflow.
The original workflow without MSBooster (a) and the new workflow with MSBooster (b) are depicted. Files generated when running MSBooster are depicted in yellow. Dashed arrows are steps run only when using MSBooster. The default features used by MSBooster are shown in “Feature calculation”. Features reported by MSFragger, such as hyperscore and charge, are combined with deep learning features calculated in MSBooster for Percolator rescoring before filtering and reporting in Philosopher.
Fig. 2
Fig. 2. HLA rescoring.
a Swarmplot of the number of HLA peptides reported at 1% FDR using the MSFragger pin files (original), files with the spectral similarity feature added (spectra), retention time similarity feature (RT), or both types of features (spectra+RT). Each dot represents the number reported for each of the 10 Percolator runs. Black lines show the average number of peptides reported across 10 Percolator runs. b Venn diagram of HLA peptides between lengths 7 and 12 when using either original MSFragger features or additional deep learning features. c GibbsCluster-generated motif assigned to the MSBooster-specific peptide subset from (b). The A*02:01 motif was collected from the Immune Epitope Database. d Percent of peptides from each subset of b that are predicted by NetMHC 4.0 to bind the A*02:01 serotype. Strength of the ligand binding decreases from “high” to “weak” to “nonbinder”. Source data are provided as a Source Data file.
Fig. 3
Fig. 3. Neoantigen discovery in melanoma tissue.
a and b Venn diagrams of peptides identified without (original) and with MSBooster. These peptides are categorized as canonical peptides from the reference database (a) or noncanonical neoantigens derived from mutations detected by exome sequencing (b). c Venn diagram of neoantigens proposed in DeepRescore, or our study with MSBooster. Peptides in a and b were of lengths 7–25, while peptides in c were filtered between lengths 8 and 12. d PDV visualization of experimental and DIA-NN predicted spectra. y1, y2, b1, and b2 ion intensities are not predicted by DIA-NN and are therefore excluded from visualization. e NetMHCpan 4.1 binding affinities of peptides predicted to bind A*03:01. The newly detected peptide SLSSALRPSTSR is shown in red. Source data are provided as a Source Data file.
Fig. 4
Fig. 4. Melanoma DIA rescoring with MSFragger-DIA.
a and b Swarmplots of the number of peptides (a) or proteins (b) reported at 1% FDR. c and d The proportion of PSMs (c) or total number of PSMs (d) from each of the five ranks reported. The darker, diagonally dashed bars represent results after spectral and RT rescoring, while the lighter, solid bars represent the results without using deep learning features. Source data are provided as a Source Data file.
Fig. 5
Fig. 5. Single-cell rescoring.
ad Results for nanoPOTS data from Williams et al.. a, b Ridge plots showing the distribution of the spectral (a) and RT (b) feature scores of confident target PSMs for different numbers of cells. The red line indicates the median value. The bulk cell sample is from PXD026436, produced on an Orbitrap Fusion Lumos. The RT feature was log normalized for better visualization. c and d Swarmplots of the number of reported peptides (c) and proteins (d) when using different features for Percolator rescoring. eh are the same as (ad), but for the DISCO data from Lamanna et al.. Source data are provided as a Source Data file.
Fig. 6
Fig. 6. timsTOF HeLa rescoring.
a and b Swarmplot of peptides (a) and proteins (b) reported at 1% FDR. cf Scatter density plots showing the relationships between DIA-NN predicted and experimental IM (c, d) and RT (e, f) values in seconds for peptides with charges 2 and above. Confident target PSMs are shown in c and e, decoy PSMs in (d and f). The brighter colors correspond to higher densities of PSMs. Source data are provided as a Source Data file.

Similar articles

Cited by

References

    1. Aebersold R, Mann M. Mass-spectrometric exploration of proteome structure and function. Nature. 2016;537:347–355. doi: 10.1038/nature19949. - DOI - PubMed
    1. Steen H, Mann M. The ABC’s (and XYZ’s) of peptide sequencing. Nat. Rev. Mol. Cell Biol. 2004;5:699–711. doi: 10.1038/nrm1468. - DOI - PubMed
    1. Messner CB, et al. Ultra-fast proteomics with Scanning SWATH. Nat. Biotechnol. 2021;39:846–854. doi: 10.1038/s41587-021-00860-4. - DOI - PMC - PubMed
    1. Kitata, R. B., Yang, J. C. & Chen, Y. J. Advances in data-independent acquisition mass spectrometry towards comprehensive digital proteome landscape. Mass Spectrom. Rev. e21781 (2022). - PubMed
    1. Nesvizhskii AI. A survey of computational methods and error rate estimation procedures for peptide and protein identification in shotgun proteomics. J. Proteom. 2010;73:2092–2123. doi: 10.1016/j.jprot.2010.08.009. - DOI - PMC - PubMed

Publication types