. 2023 Jul 27;14(1):4533.
doi: 10.1038/s41467-023-40235-8.

MAPK inhibitor sensitivity scores predict sensitivity driven by the immune infiltration in pediatric low-grade gliomas

Affiliations

MAPK inhibitor sensitivity scores predict sensitivity driven by the immune infiltration in pediatric low-grade gliomas

Romain Sigaud et al. Nat Commun. .

Abstract

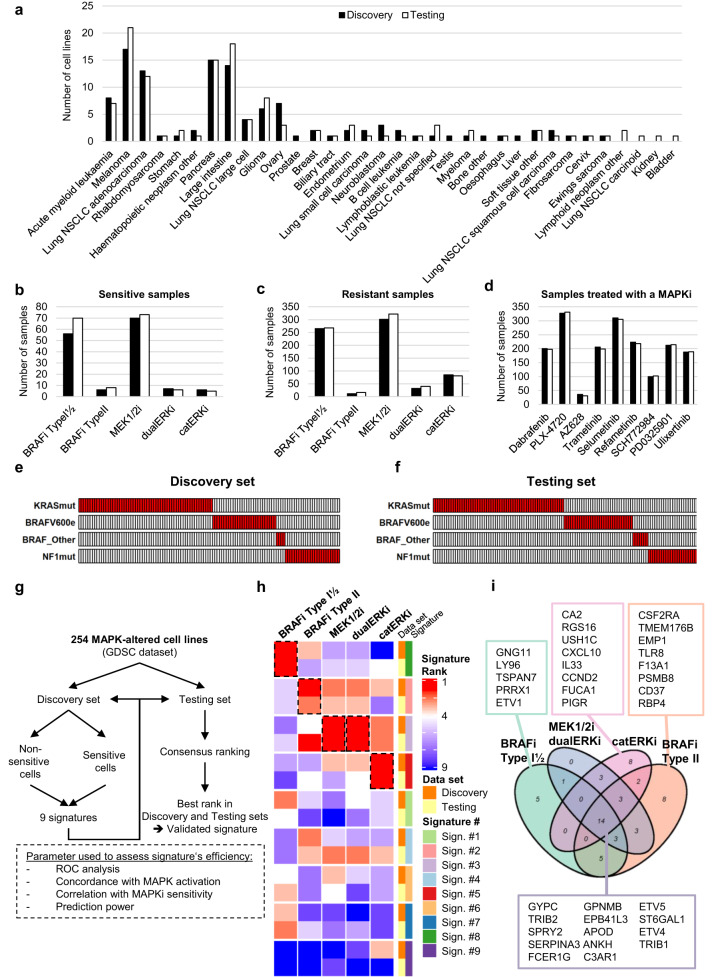
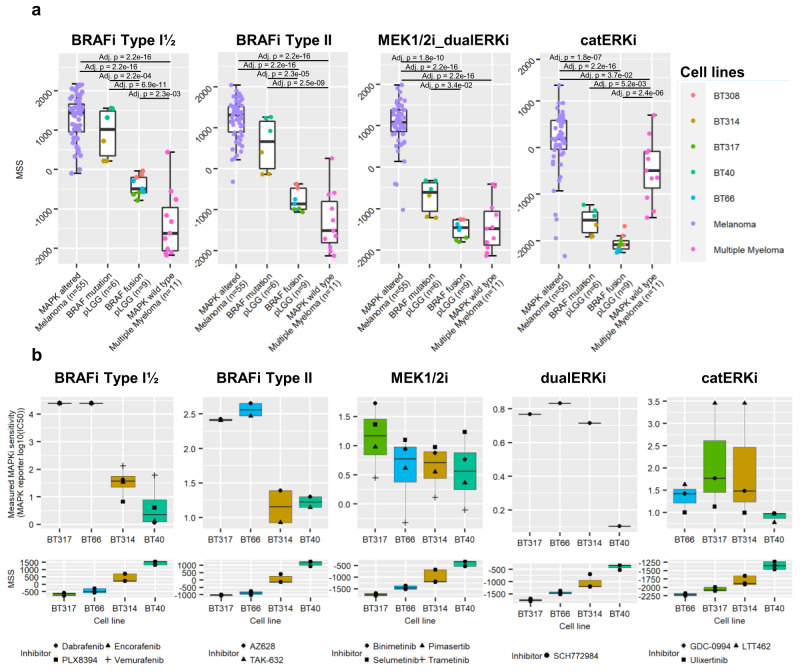
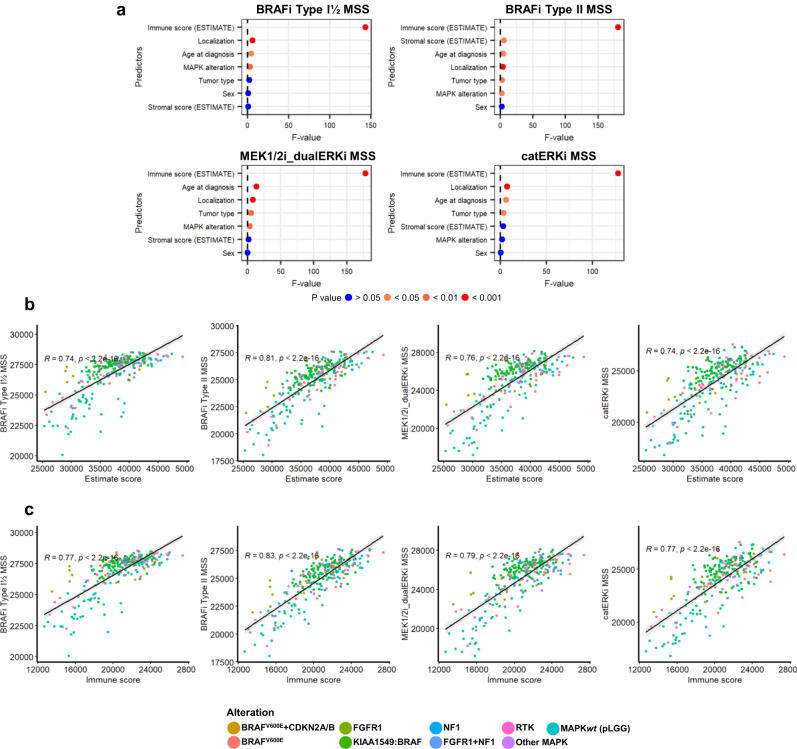
Pediatric low-grade gliomas (pLGG) show heterogeneous responses to MAPK inhibitors (MAPKi) in clinical trials. Thus, more complex stratification biomarkers are needed to identify patients likely to benefit from MAPKi therapy. Here, we identify MAPK-related genes enriched in MAPKi-sensitive cell lines using the GDSC dataset and apply them to calculate class-specific MAPKi sensitivity scores (MSSs) via single-sample gene set enrichment analysis. The MSSs discriminate MAPKi-sensitive and non-sensitive cells in the GDSC dataset and significantly correlate with response to MAPKi in an independent PDX dataset. The MSSs discern gliomas with varying MAPK alterations and are higher in pLGG compared to other pediatric CNS tumors. Heterogenous MSSs within pLGGs with the same MAPK alteration identify proportions of potentially sensitive patients. The MEKi MSS predicts treatment response in a small set of pLGG patients treated with trametinib. High MSSs correlate with a higher immune cell infiltration, with high expression in the microglia compartment in single-cell RNA sequencing data, while low MSSs correlate with low immune infiltration and increased neuronal score. The MSSs represent predictive tools for the stratification of pLGG patients and should be prospectively validated in clinical trials. Our data supports a role for microglia in the response to MAPKi.


Conflict of interest statement

O.W. and T.M. were supported by research grants from Biomed Valley Discoveries, Inc., and Day One Biopharmaceuticals. The remaining authors declare no competing interests.

Figures

Fig. 1
Fig. 1. Class-based MAPKi predictive sensitivity signatures validation.
The GDSC dataset was split into a Discovery and Testing set, making sure that both sets had no major differences. To do so, both datasets contain the same proportions of a cell lines derived from a given tumor type, b sensitive and c resistant samples to a given type of MAPKi, d samples treated with a given MAPKi, e, f cell lines with a given MAPK alteration. g Simplified overview of the pipeline used to generate the MAPKi sensitivity signatures. h Heatmap depicting the final consensus ranking for all nine signatures based on their ability to best predict sensitivity to a given class of MAPKi. To avoid confusion, signatures were assigned random numbers, but the information from which MAPKi they are derived can be found in Supplementary Data 4. The color in the heatmap represents the rank that the signature reached in the consensus ranking in Discovery and Testing sets. i Venn diagram depicting genes overlap between signatures and identification of a potential “Overlap MSS”. Source data are provided as a Source Data file.
Fig. 2
Fig. 2. Independent validation of MSSs in a PDX trial cohort.
Gene expression data paired with MAPKi response from the XevaDB PDX cohort (Novartis) was used to validate the signatures. a PDXs derived from several tumor entities and with mutually exclusive MAPK alterations were used. Waterfall plots were used to depict MAPKi treatment response (i.e., primary response as described in the original publication; mRECIST criteria) for each sample, and dotplots were used to depict corresponding MAPKi sensitivity scores. Samples were grouped based on treatment response in boxplots. This tryptic analysis was done for PDX treated with b the BRAFi type I 1/2 encorafenib, c MEK1/2i binimetinib, and d trametinib. Boxplots depict the median, first and third quartiles. Whiskers extend from the hinge to the largest/smallest value no further than 1.5 * IQR from the hinge (where IQR is the interquartile range). Significance was calculated with one-way ANOVA followed by Tukey’s ‘Honest Significant Difference’ test, not significant if not specified. e Receiver operating characteristic (ROC) curve for prediction of encorafenib, trametinib or binimetinib based on the measured BRAFi Type I 1/2 MSS or MEK1/2i MSS. Are also indicated sensitivity (sens) and specificity (spe) at best MSS threshold as identified by Youden’s J statistics. Source data are provided as a Source Data file.
Fig. 3
Fig. 3. MSSs in pLGG cell lines.
a Scores were measured in a panel of pLGG cell lines with BRAFV600E mutation (DKFZ-BT314 and BT40, examined over three independent experiments), with KIAA1549:BRAF fusion (DKFZ-BT66, DKFZ-BT308 and DKFZ-BT317, examined over three independent experiments), melanoma cell lines with BRAF mutations (n = 55 biologically independent samples), and multiple myeloma cell lines with wild-type MAPK pathway (n = 11 biologically independent samples). Boxplots depict the median, first and third quartiles. Whiskers extend from the hinge to the largest/smallest value no further than 1.5 * IQR from the hinge (where IQR is the interquartile range). Colored dots represent biological triplicates. One-way ANOVA followed by Tukey’s ‘Honest Significant Difference’ was used to measure significance. Not significant if not specified. b Matching analysis was then done between MAPKi sensitivity data measured from a MAPK-reporter assay and the corresponding MSS in the BT40, DKFZ-BT66, DKFZ-BT314 and DKFZ-BT317 cell lines to estimate the reliability of each class-based MSS to predict MAPKi sensitivity. Boxplots depict the median, first and third quartiles. Whiskers extend from the hinge to the largest/smallest value no further than 1.5 * IQR from the hinge (where IQR is the interquartile range). n = 4 cell lines examined over three independent experiments. Source data are provided as a Source Data file.
Fig. 4
Fig. 4. MSSs in primary samples from pediatric gliomas.
MAPKi sensitivity scores were measured in the OPBTA dataset. a Boxplots depicting the corresponding ssGSEA predictive MAPKi sensitivity score for each brain tumor entity. Orange boxes represent pLGG entities and dashed orange lines pLGG median scores. Salmon boxes represent entities with a median score higher than the overall median (dashed black line). One-way ANOVA followed by Tukey’s ‘Honest Significant Difference’ was used to measure significance. The significance compared to the pLGG group is only depicted. Boxplots depict the median, first and third quartiles. Whiskers extend from the hinge to the largest/smallest value no further than 1.5 * IQR from the hinge (where IQR is the interquartile range). MB medulloblastoma, EWS Ewin Sarcoma, EPN ependymoma, NB neuroblastoma, CNS other CNS embryonal tumor, ETMR embryonal tumor with multilayer rosettes, SEGA Subependymal Giant Cell Astrocytoma, CHDM chordoma, HGG high-grade glioma, CRANIO craniopharyngioma, GNT glial neuronal tumor, DMG diffuse midline glioma, pLGG low-grade glioma. b Boxplots focusing on pLGG samples only and showing samples with a detected MAPK alteration vs samples with a wild-type MAPK pathway. Boxplots depict the median, first and third quartiles. Whiskers extend from the hinge to the largest/smallest value no further than 1.5 * IQR from the hinge (where IQR is the interquartile range). One-way ANOVA followed by Tukey’s ‘Honest Significant Difference’ was used to measure significance. Not significant if not specified. c Dotplot depicting the overall predicted MAPKi sensitivity (median across all four signatures) z-score for the pLGG samples only, and split based on their molecular alteration. The proportion of samples with a high, intermediate and low sensitivity score is also depicted. d MEK1/2i sensitivity score was measured in pLGG-derived primary samples from patients who received trametinib treatment. Gene expression was measured on samples acquired prior to treatment initiation. Since the MSS are not comparable across datasets, the samples were split based on the institute of origin. Source data are provided as a Source Data file.
Fig. 5
Fig. 5. MSSs identify the immune infiltration as a key player in MAPKi response in pLGG.
The ESTIMATE algorithm was used to approximate the proportion of infiltrating cells in the pLGG samples from the OPBTA dataset. a Dotplot depicting the F-values obtained after multiple linear regression analysis followed by one-way ANOVA to assess what coefficients are significantly associated with MSS. b Correlation between MAPKi sensitivity scores and ESTIMATE scores are depicted, along with Pearson’s coefficient of correlation, the corresponding p-value (two-tailed t-test), and the 95% confidence interval (error band). c The correlation between the MAPKi sensitivity score and the immune signature score is also depicted. Significance was calculated with a two-tailed t-test. Source data are provided as a Source Data file.
Fig. 6
Fig. 6. MSSs identify microglia as a key player in MAPKi response in pLGG.
Cell marker expression and MSSs evaluation in a cohort of six pLGG primary samples. a UMAPs depicting the key cell population markers for the main cell populations identified in the pLGG samples. b UMAPs depicting the MSS, MPAS and immune score (ESTIMATE) in the different clusters. A dotplot summarizing the signature scores in each cluster is also depicted. Source data are provided as a Source Data file.
Fig. 7
Fig. 7. MSSs are not confounded by gene signature overlap, microenvironmental transcriptome, or general bias.
a Venn diagram depicting genes overlap between an aggregation of our signatures and the immune and stromal signature from the ESTIMATE. In the box are indicated the overlapping genes. b Schematic presenting the comparison studied via GSEA with ConfoundR to test for microenvironmental confounding effect. c Dotplot summarizing the indicated signatures’ normalized enrichment scores (NES) when comparing stromal vs. epithelial cell populations in six tumor types. Nominal p-value from the GSEA output is used. d Dotplot summarizing the indicated signatures’ NES when comparing endothelial, fibroblast or leukocyte populations to the remaining cell populations. Enrichment is depicted by warm colors, while the contrary is depicted by cold colors. Dot size depicts the respective nominal p-value from the GSEA output. e Dotplot summarizing the correlation coefficient (R) when comparing the indicated signature to the predicted immune infiltration (from ESTIMATE) in the OPBTA and TCGA datasets. The entities were split based on their median R across all MAPKi sensitivity signatures (i.e., excluding the MPAS). R > 0.7 was considered biologically significant. Dot size depicts the respective p-value (two-tailed t-test). The arrow points at the pLGG samples. f Boxplot grouping the R coefficient by entity type (normal vs tumor) and by localization (CNS vs non-CNS). Each dot represents the coefficient of correlation between MSSs and predicted immune infiltration for n = 13 biologically independent CNS tumor types, n = 14 biologically independent non-CNS tumor types and n = 14 biologically independent normal tissue type. Boxplots depict the median, first and third quartiles. Whiskers extend from the hinge to the largest/smallest value no further than 1.5 * IQR from the hinge (where IQR is the interquartile range). One-way ANOVA followed by Tukey’s ‘Honest Significant Difference’ was used to measure significance. Not significant if not specified. Red dots depict the pLGG entities. CRC colorectal carcinoma, PDAC pancreatic ductal adenocarcinoma, TNBC triple-negative breast cancer. Source data are provided as a Source Data file.
Fig. 8
Fig. 8. Characterization of pLGG samples with low/intermediate MSSs.
a Correlation between MSSs and the neuronal score is depicted, along with Pearson’s coefficient of correlation, the corresponding p-value (two-tailed t-test), and the 95% confidence interval (error band). b Boxplots depicting raw ssGSEA scores for the neuronal score in the clusters from Fig. 4c from the OPBTA cohort. Dots are colored based on the detected driving MAPK alteration. Data from n = 218 biologically independent samples were used. Boxplots depict the median, first and third quartiles. Whiskers extend from the hinge to the largest/smallest value no further than 1.5 * IQR from the hinge (where IQR is the interquartile range). One-way ANOVA followed by Tukey’s ‘Honest Significant Difference’ was used to measure significance. c UMAPs depicting the MSS in each individual pLGG sample from our scRNA-seq dataset. The relative proportion of each cell population in each pLGG sample is also shown. PA pilocytic astrocytoma, PMA pilomyxoid astrocytoma. Source data are provided as a Source Data file.

References

    1. Ostrom QT, et al. CBTRUS Statistical Report: Pediatric Brain Tumor Foundation childhood and adolescent primary brain and other central nervous system tumors diagnosed in the United States in 2014–2018. Neuro Oncol. 2022;24:iii1–iii38. doi: 10.1093/neuonc/noac161. - DOI - PMC - PubMed
    1. Milde T, et al. Reimagining pilocytic astrocytomas in the context of pediatric low-grade gliomas. Neuro Oncol. 2021;23:1634–1646. doi: 10.1093/neuonc/noab138. - DOI - PMC - PubMed
    1. Louis DN, et al. The 2021 WHO Classification of Tumors of the Central Nervous System: a summary. Neuro Oncol. 2021;23:1231–1251. doi: 10.1093/neuonc/noab106. - DOI - PMC - PubMed
    1. Goebel AM, et al. Natural history of pediatric low-grade glioma disease—first multi-state model analysis. J. Cancer. 2019;10:6314–6326. doi: 10.7150/jca.33463. - DOI - PMC - PubMed
    1. Armstrong GT, et al. Survival and long-term health and cognitive outcomes after low-grade glioma. Neuro Oncol. 2011;13:223. doi: 10.1093/neuonc/noq178. - DOI - PMC - PubMed

Publication types