. 2023 Jul 27;13(1):12195.
doi: 10.1038/s41598-023-38079-9.

Plasma proteome of growing tumors

Affiliations

Plasma proteome of growing tumors

Shashi Gupta et al. Sci Rep. .

Abstract

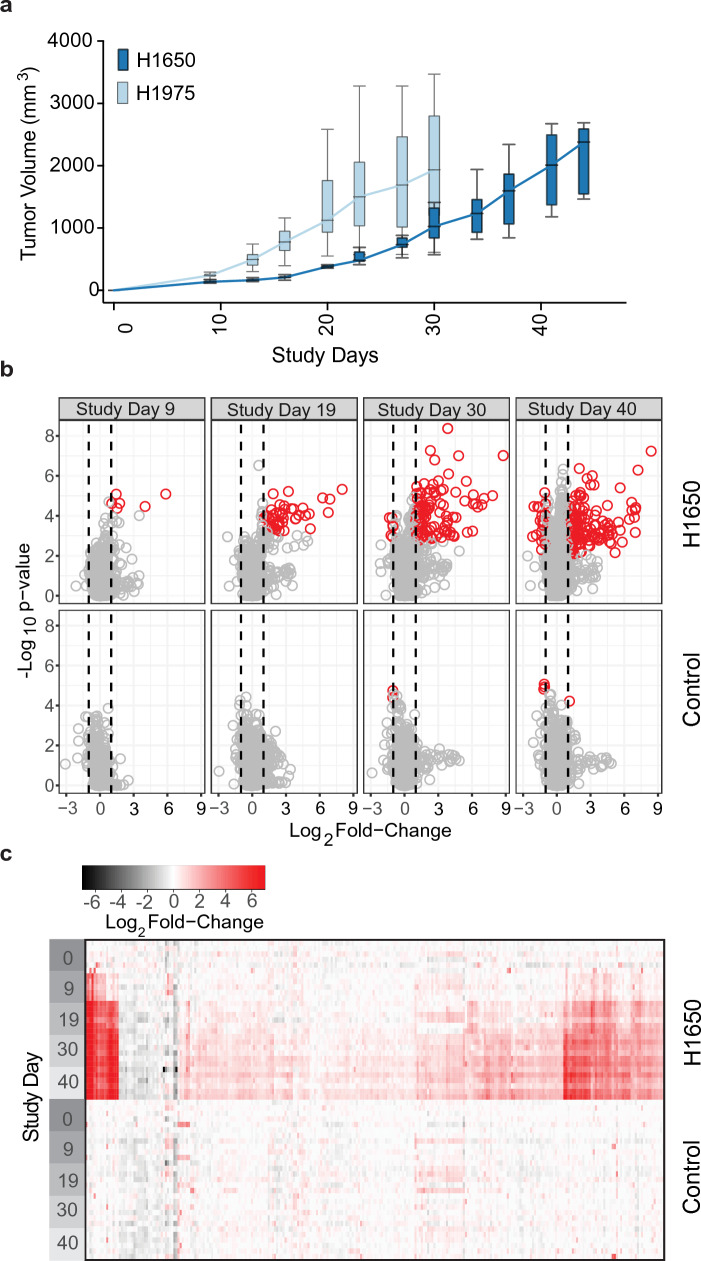
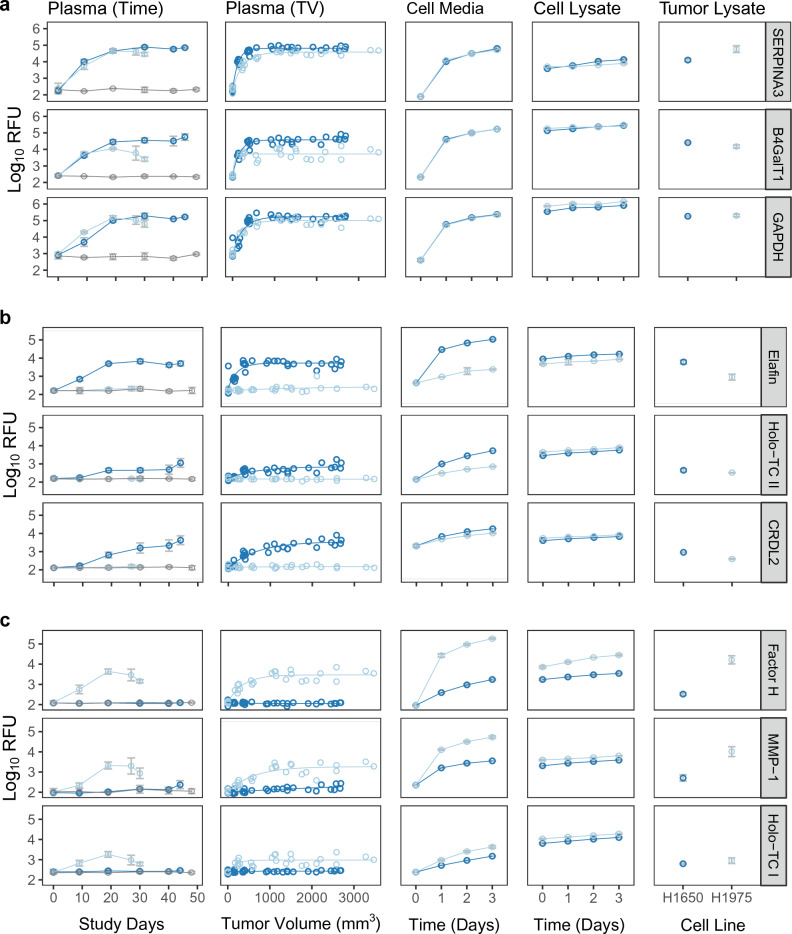
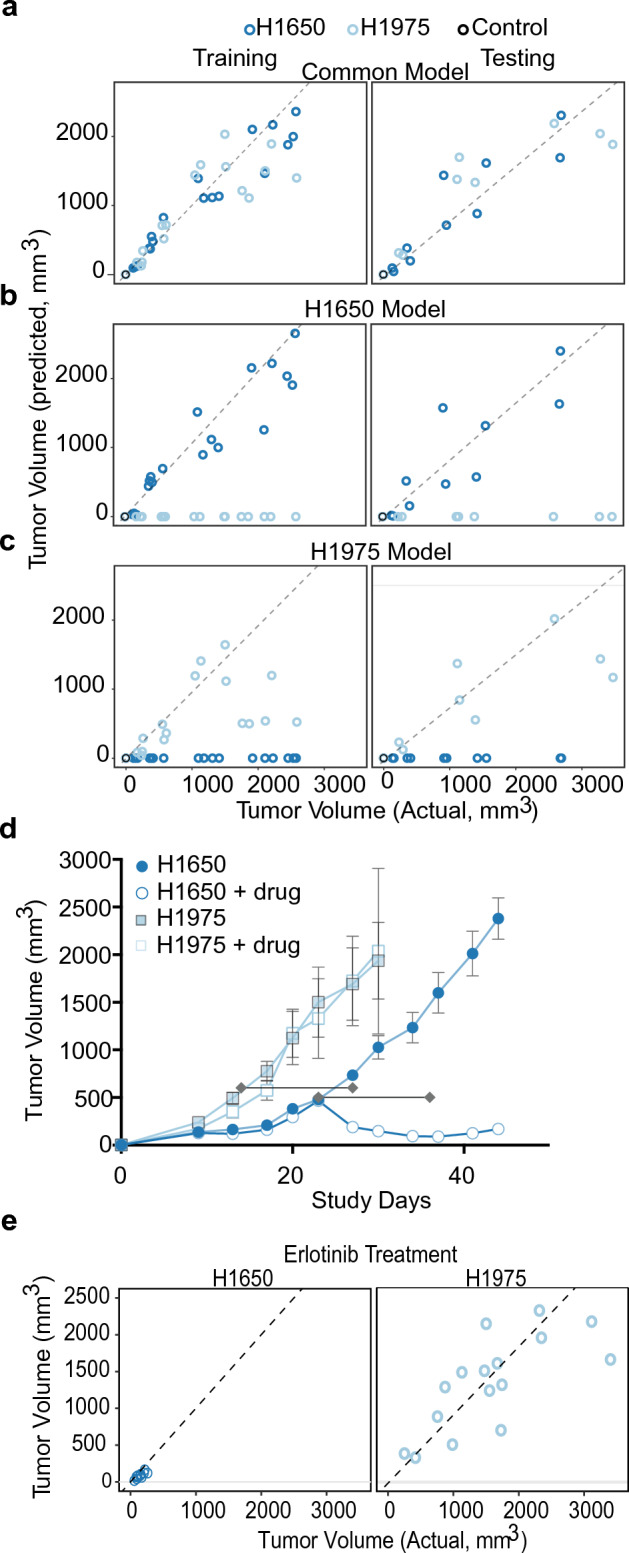
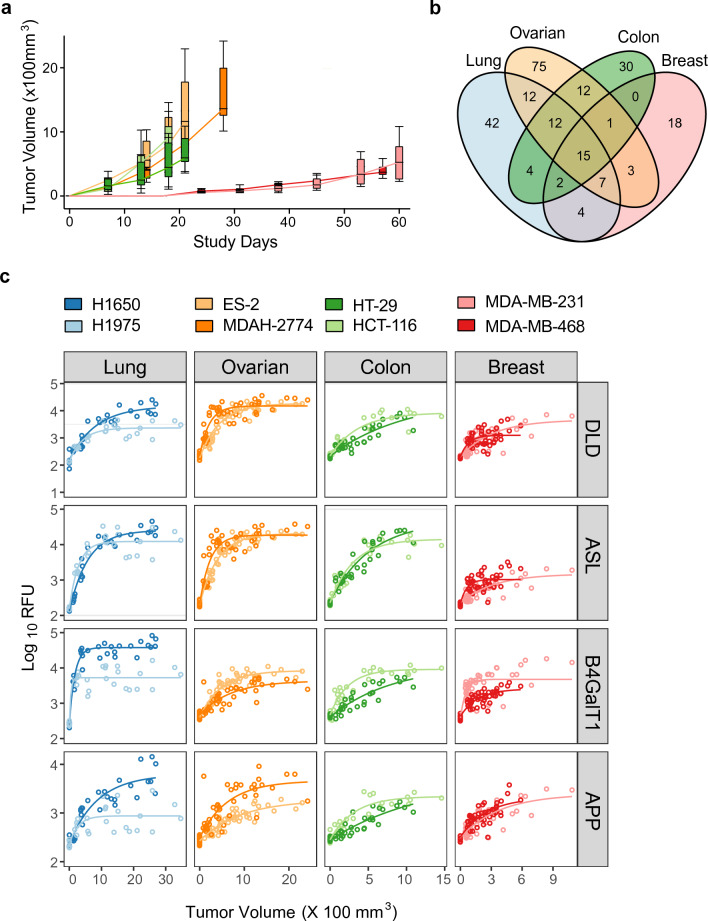
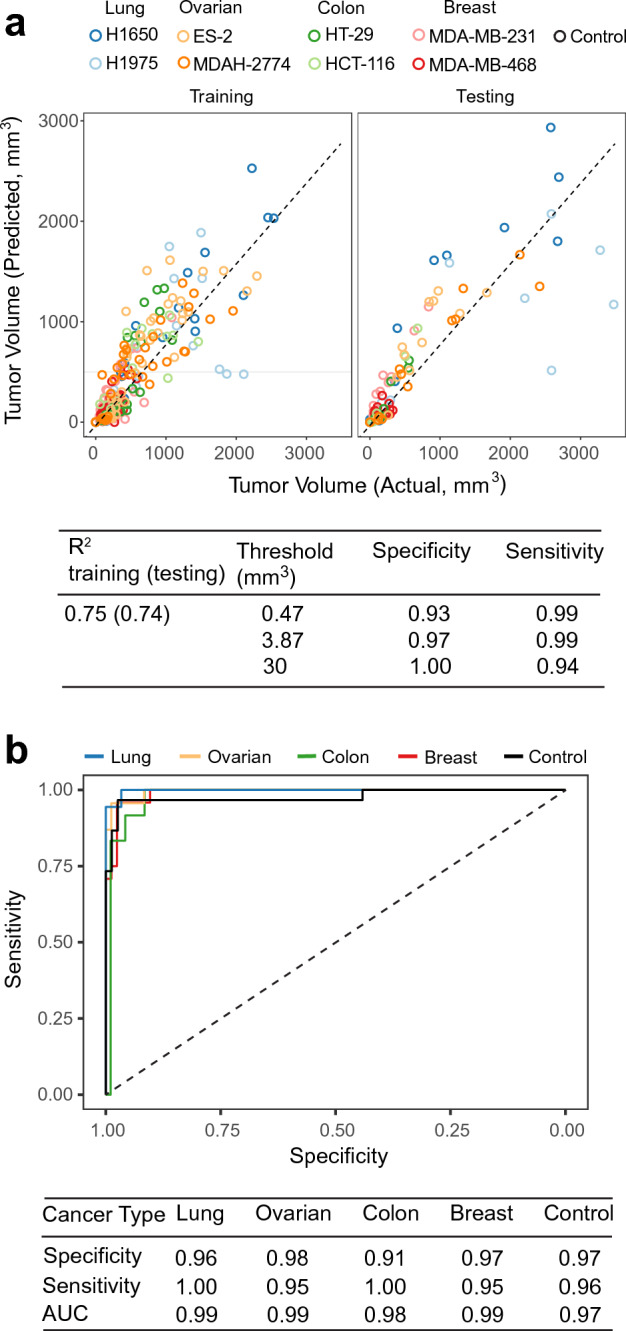
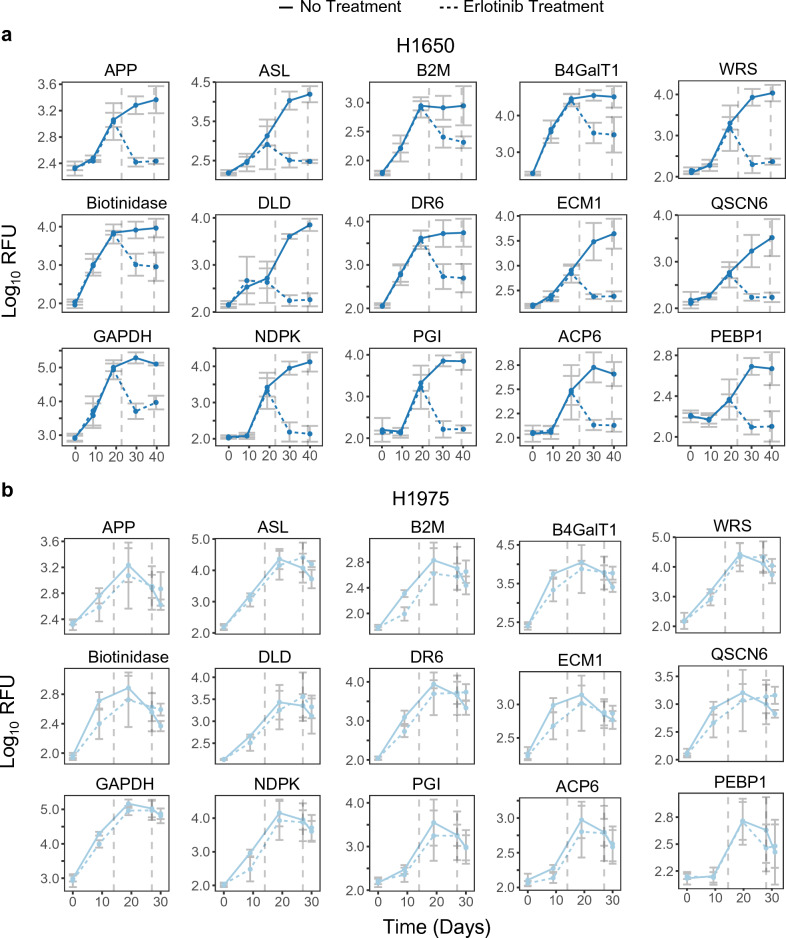
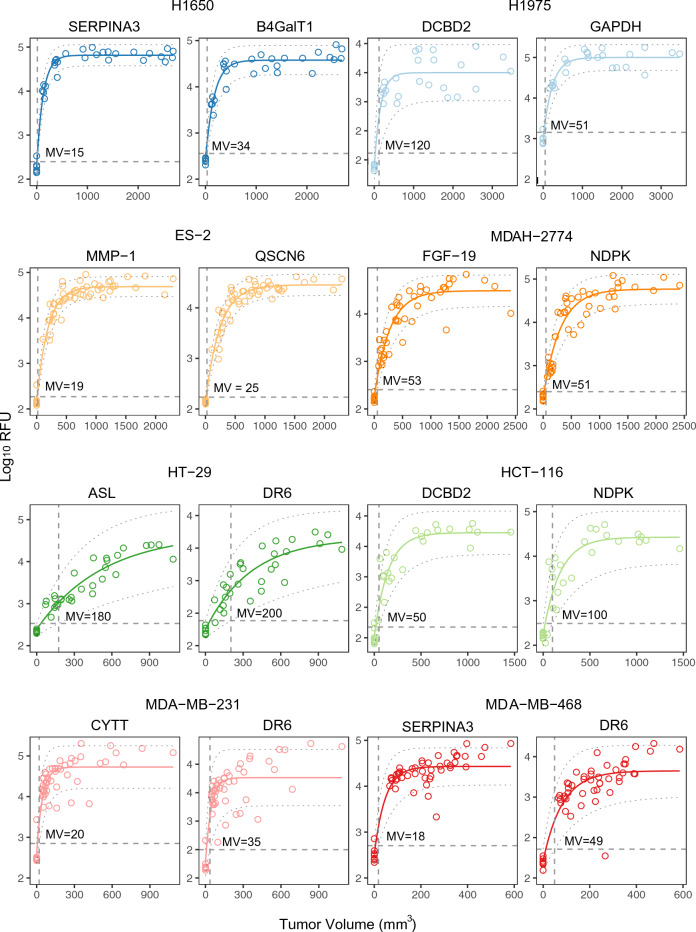
Early detection of cancer is vital for the best chance of successful treatment, but half of all cancers are diagnosed at an advanced stage. A simple and reliable blood screening test applied routinely would therefore address a major unmet medical need. To gain insight into the value of protein biomarkers in early detection and stratification of cancer we determined the time course of changes in the plasma proteome of mice carrying transplanted human lung, breast, colon, or ovarian tumors. For protein measurements we used an aptamer-based assay which simultaneously measures ~ 5000 proteins. Along with tumor lineage-specific biomarkers, we also found 15 markers shared among all cancer types that included the energy metabolism enzymes glyceraldehyde-3-phosphate dehydrogenase, glucose-6-phophate isomerase and dihydrolipoyl dehydrogenase as well as several important biomarkers for maintaining protein, lipid, nucleotide, or carbohydrate balance such as tryptophanyl t-RNA synthetase and nucleoside diphosphate kinase. Using significantly altered proteins in the tumor bearing mice, we developed models to stratify tumor types and to estimate the minimum detectable tumor volume. Finally, we identified significantly enriched common and unique biological pathways among the eight tumor cell lines tested.


Conflict of interest statement

S.G., M.J.W., D.G.A., S.J.W., D.J.S., D.W.D., and N.J. are employees and/or stakeholders of SomaLogic. P.W., C.M., D.C.W. are paid consultants of SomaLogic. A.K.-F. and L.E.H. declare no competing interests.

Figures

Figure 1
Figure 1
Impact of NSCLC tumor xenograft on the circulating proteome. (a) Tumor volume versus time for mice implanted subcutaneously with either H1650 or H1975 tumor cells (median, IQR with error bars representing 1.5 × IQR, n = 6/group). (b) Volcano plots showing the Log10 p-value versus median Log2 fold-change of 4584 individual analytes on different Study Days (9, 19, 30 and 40) relative to Study Day 0, for H1650 implanted mice (top panels) or for non-implanted (control) animals (bottom panels). Circles indicate individual analytes and vertical lines indicate a Log2 fold-change of |1|. Significant analytes (fdr corrected p-value ≤ 0.05 with median Log2 fold-change ≥|1|) are indicated by red circles. Volcano plots for H1975 tumors are shown in Supplementary Fig. S1. (c) Heatmap representing the fold changes of statistically significant analytes (as defined above). Individual animal Log2 fold-changes were calculated relative to the median values on Study Day 0 of control mice. For each Study Day indicated there are multiple rows, each representing an individual animal while each column represents a different protein analyte. Top panels show H1650 implanted mice and bottom panels show un-implanted (control) mice. Heatmap for H1975 tumors is shown in Supplementary Fig. S1.
Figure 2
Figure 2
Circulating tumor volume prediction markers in H1650 and H1975 xenograft models. Signal in relative fluorescent units (RFU) versus Study Day [Plasma (Time)] and signal verses tumor volume [Plasma (TV)] are shown for a representative set of tumor volume prediction markers. Signals for the same markers from cell conditioned media versus time (Cell Media), cell lysate versus time, and end of study tumor lysate are also shown. Error bars indicate mean ± s.d., circles indicate individual measurements. Color scheme is same as in Fig. 1a. All markers showed statistically significant changes in signal with time or tumor volume using a repeated measured ANOVA (fdr corrected p-value ≤ 0.05). (a) Representative prediction markers shared between H1650 and H1975 models. (b) Representative markers specific to H1650. (c) Representative markers specific to H1975.
Figure 3
Figure 3
Tumor volume prediction in H1650 and H1975 tumor xenografts. (a) Actual versus predicted tumor volume trained using 19 common plasma markers between lung cell lines for the training set (n = 4 mice in each group) and testing set (n = 2 mice in each group) Dashed line indicates identity. Color scheme is the same as in Fig. 1A. Same analysis was used for data shown in panels (b) and (c). (b) Actual versus predicted tumor volume trained using 28 markers for H1650. (c) Actual versus predicted tumor volume trained using 3 markers for H1975. (d) Tumor volume versus time for mice implanted subcutaneously with either H1650 or H1975 tumor cells with or without erlotinib treatment (median, IQR with error bars representing 1.5 × IQR, n = 6/group). Horizontal lines indicate erlotinib treatment window. (e) Plot of actual versus predicted tumor volume with erlotinib treatment in both H1650 and H1975, using 19 common plasma markers. Dashed line indicates identity.
Figure 4
Figure 4
Impact of multiple tumor xenografts on the circulating plasma proteome. (a) Tumor volume versus time for mice implanted subcutaneously with either MDA-MB-231 or MDA-MB-468 (breast); ES-2 or MDAH-2774 (ovarian) and HCT-116 or HT-29 (colon) tumor cells (median, IQR with error bars representing 1.5 × IQR, n = 8, 12, 8 per cell line for breast, ovarian, and colon, respectively). (b) Venn diagram showing the numbers of statistically significant analytes (fdr corrected p-value ≤ 0.05 and a median Log2 fold-change ≥|1|) across all 8 human tumor xenograft models. (c) Plasma signal versus tumor volume for a set of the 4 common markers of tumor volume across tested cell lines. Circles indicate individual SomaScan assay measurements and lines indicate exponential fitting. The plots for the other 11 biomarkers are shown in Supplementary Fig. S4.
Figure 5
Figure 5
Tumor volume prediction and classification across cancer types. (a) Concordance of actual versus predicted tumor volume trained using 15 common analytes (Fig. 4b) obtained with linear regression with elastic net regularization. Result shown is the 27% hold-out test set. Dashed line indicates identity. (b) Receiver operating characteristic curves for tumor classification trained using 80 differentiating protein markers with elastic net regularization. Result shown is the 27% hold-out test set.
Figure 6
Figure 6
Impact of erlotinib treatment on plasma signal of 15 common markers. Signal in relative fluorescent units (RFU) versus Study Day for H1650 (a) and H1975 (b) animals and animals treated with erlotinib. Dashed vertical lines indicate start/stop of erlotinib treatment. Error bars indicate median + /− standard deviation.
Figure 7
Figure 7
Minimum volume (MV) estimations across cancer types. Signal versus tumor volume for two representative analytes per cell line. Solid lines indicate non-linear fit and dashed lines indicate 95% CI. Vertical dashed line indicates estimated tumor volume detection threshold.
Figure 8
Figure 8
Pathway analysis delineates biological pathways in xenograft models stratified by tissue type. G:profiler pathway enrichment comparing study day 0 and the 60 timepoint in the eight cell line xenograft models. Cytoscape and Enrichment Map were used for clustering and visualization of the enrichment results. Nodes represent enriched gene sets, which are then clustered with related gene sets according to their gene content. Enrichment results were mapped as a network of gene sets (nodes). Node size is proportional to the total number of genes within each gene set. The proportion of shared genes between gene sets is represented as the thickness of the edge connecting nodes. The network map was manually curated by assigning functional categories to each cluster and by removing singleton gene sets. A complete list of enriched gene sets can be found in Supplementary Table S32, and each panel shows enriched gene sets for the 2 cell line xenografts for a given tissue type.

References

    1. Vasan N, Baselga J, Hyman DM. A view on drug resistance in cancer. Nature. 2019;575:299–309. doi: 10.1038/s41586-019-1730-1. - DOI - PMC - PubMed
    1. Crosby D, et al. Early detection of cancer. Science. 2022;375:eaay9040. doi: 10.1126/science.aay9040. - DOI - PubMed
    1. Shieh Y, et al. Population-based screening for cancer: Hope and hype. Nat. Rev. Clin. Oncol. 2016;13:550–565. doi: 10.1038/nrclinonc.2016.50. - DOI - PMC - PubMed
    1. Alix-Panabières C, Pantel K. Liquid biopsy: From discovery to clinical application. Cancer Discov. 2021;11:858–873. doi: 10.1158/2159-8290.Cd-20-1311. - DOI - PubMed
    1. Hori SS, Gambhir SS. Mathematical model identifies blood biomarker-based early cancer detection strategies and limitations. Sci. Transl. Med. 2011;3:109ra116. doi: 10.1126/scitranslmed.3003110. - DOI - PMC - PubMed