. 2023 Aug;55(8):1288-1300.
doi: 10.1038/s41588-023-01445-4. Epub 2023 Jul 27.

Integrated single-cell chromatin and transcriptomic analyses of human scalp identify gene-regulatory programs and critical cell types for hair and skin diseases

Affiliations

Integrated single-cell chromatin and transcriptomic analyses of human scalp identify gene-regulatory programs and critical cell types for hair and skin diseases

Benjamin Ober-Reynolds et al. Nat Genet. 2023 Aug.

Abstract

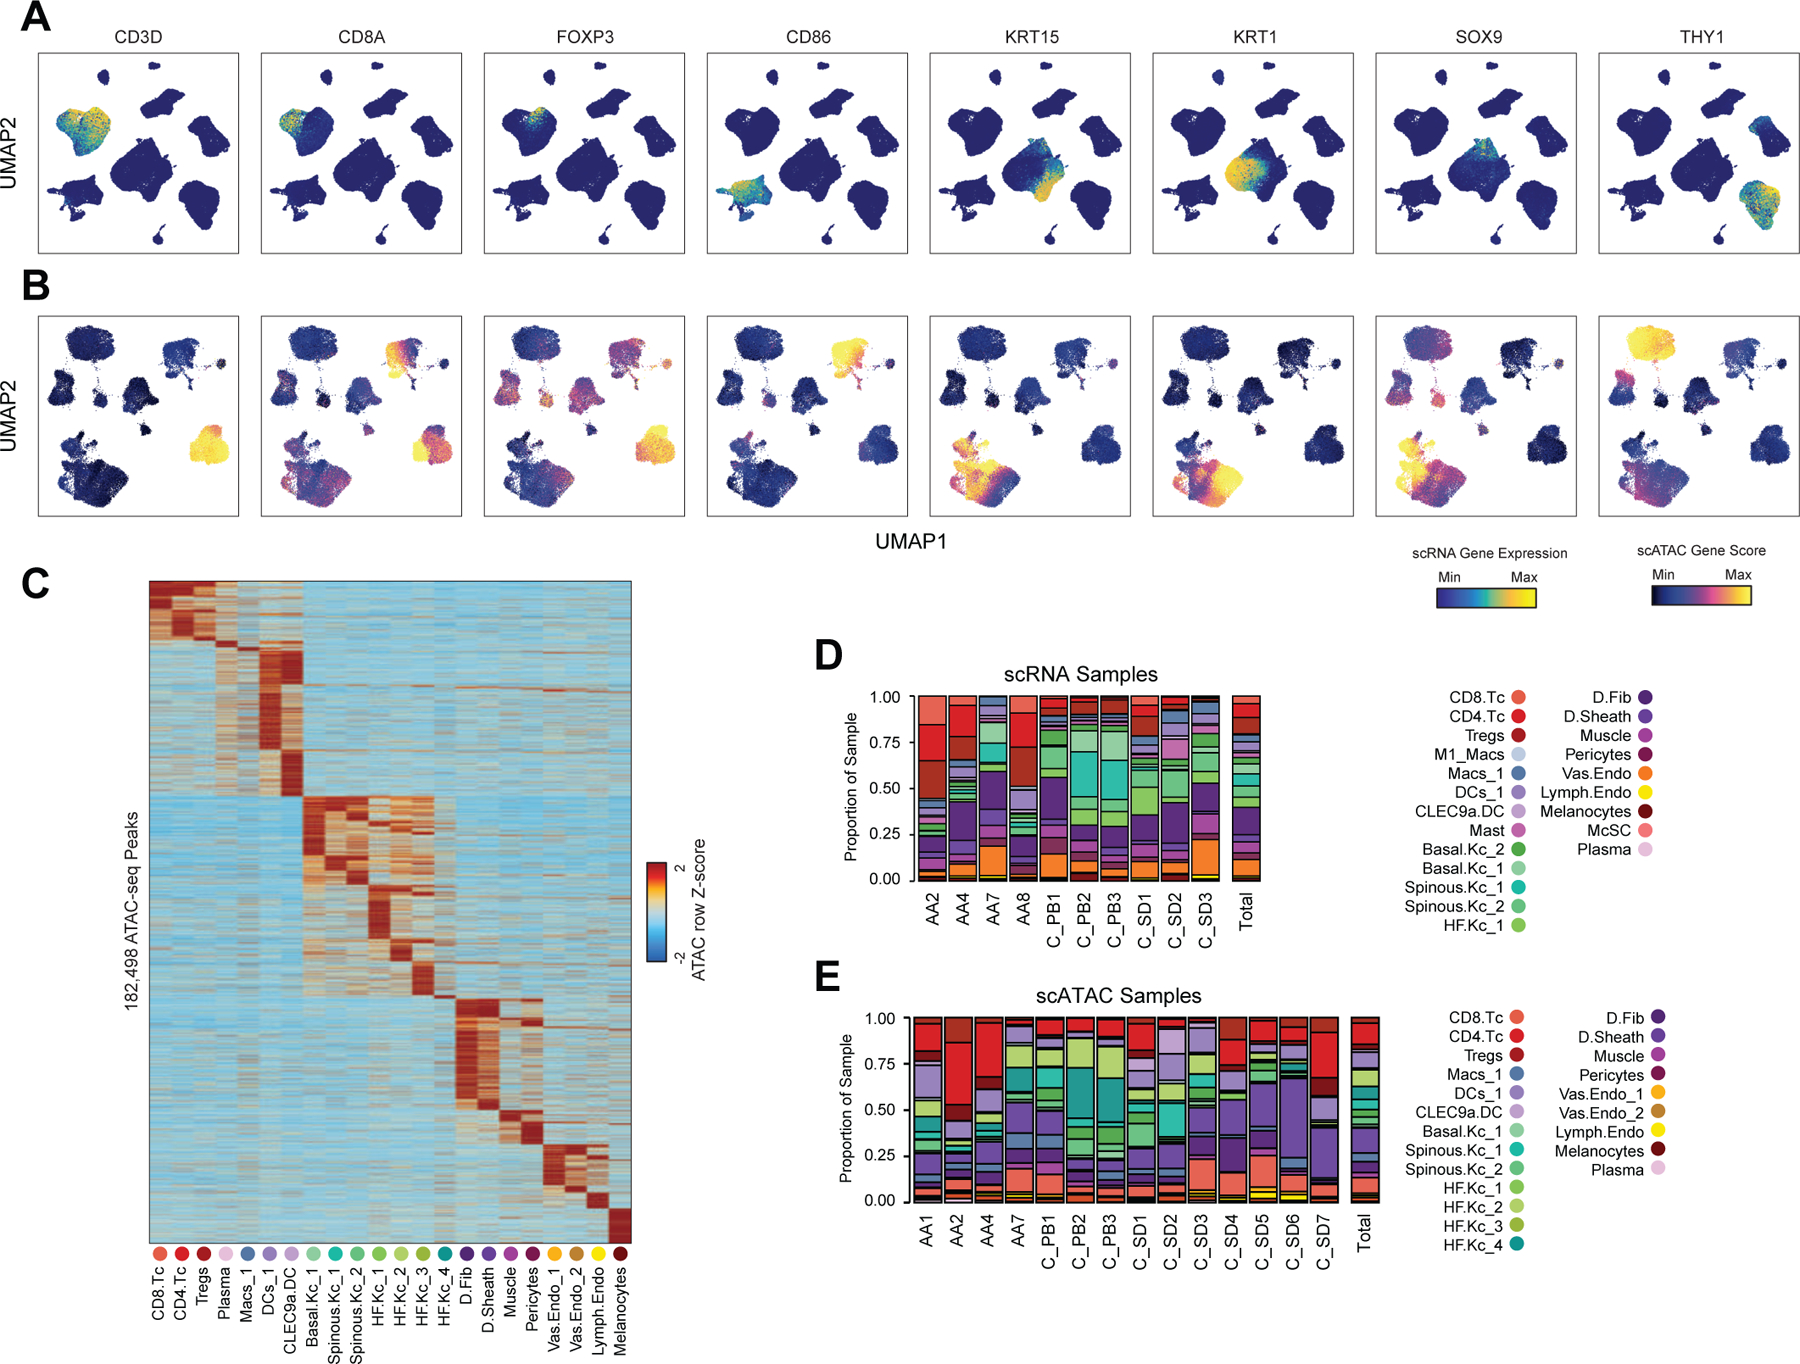
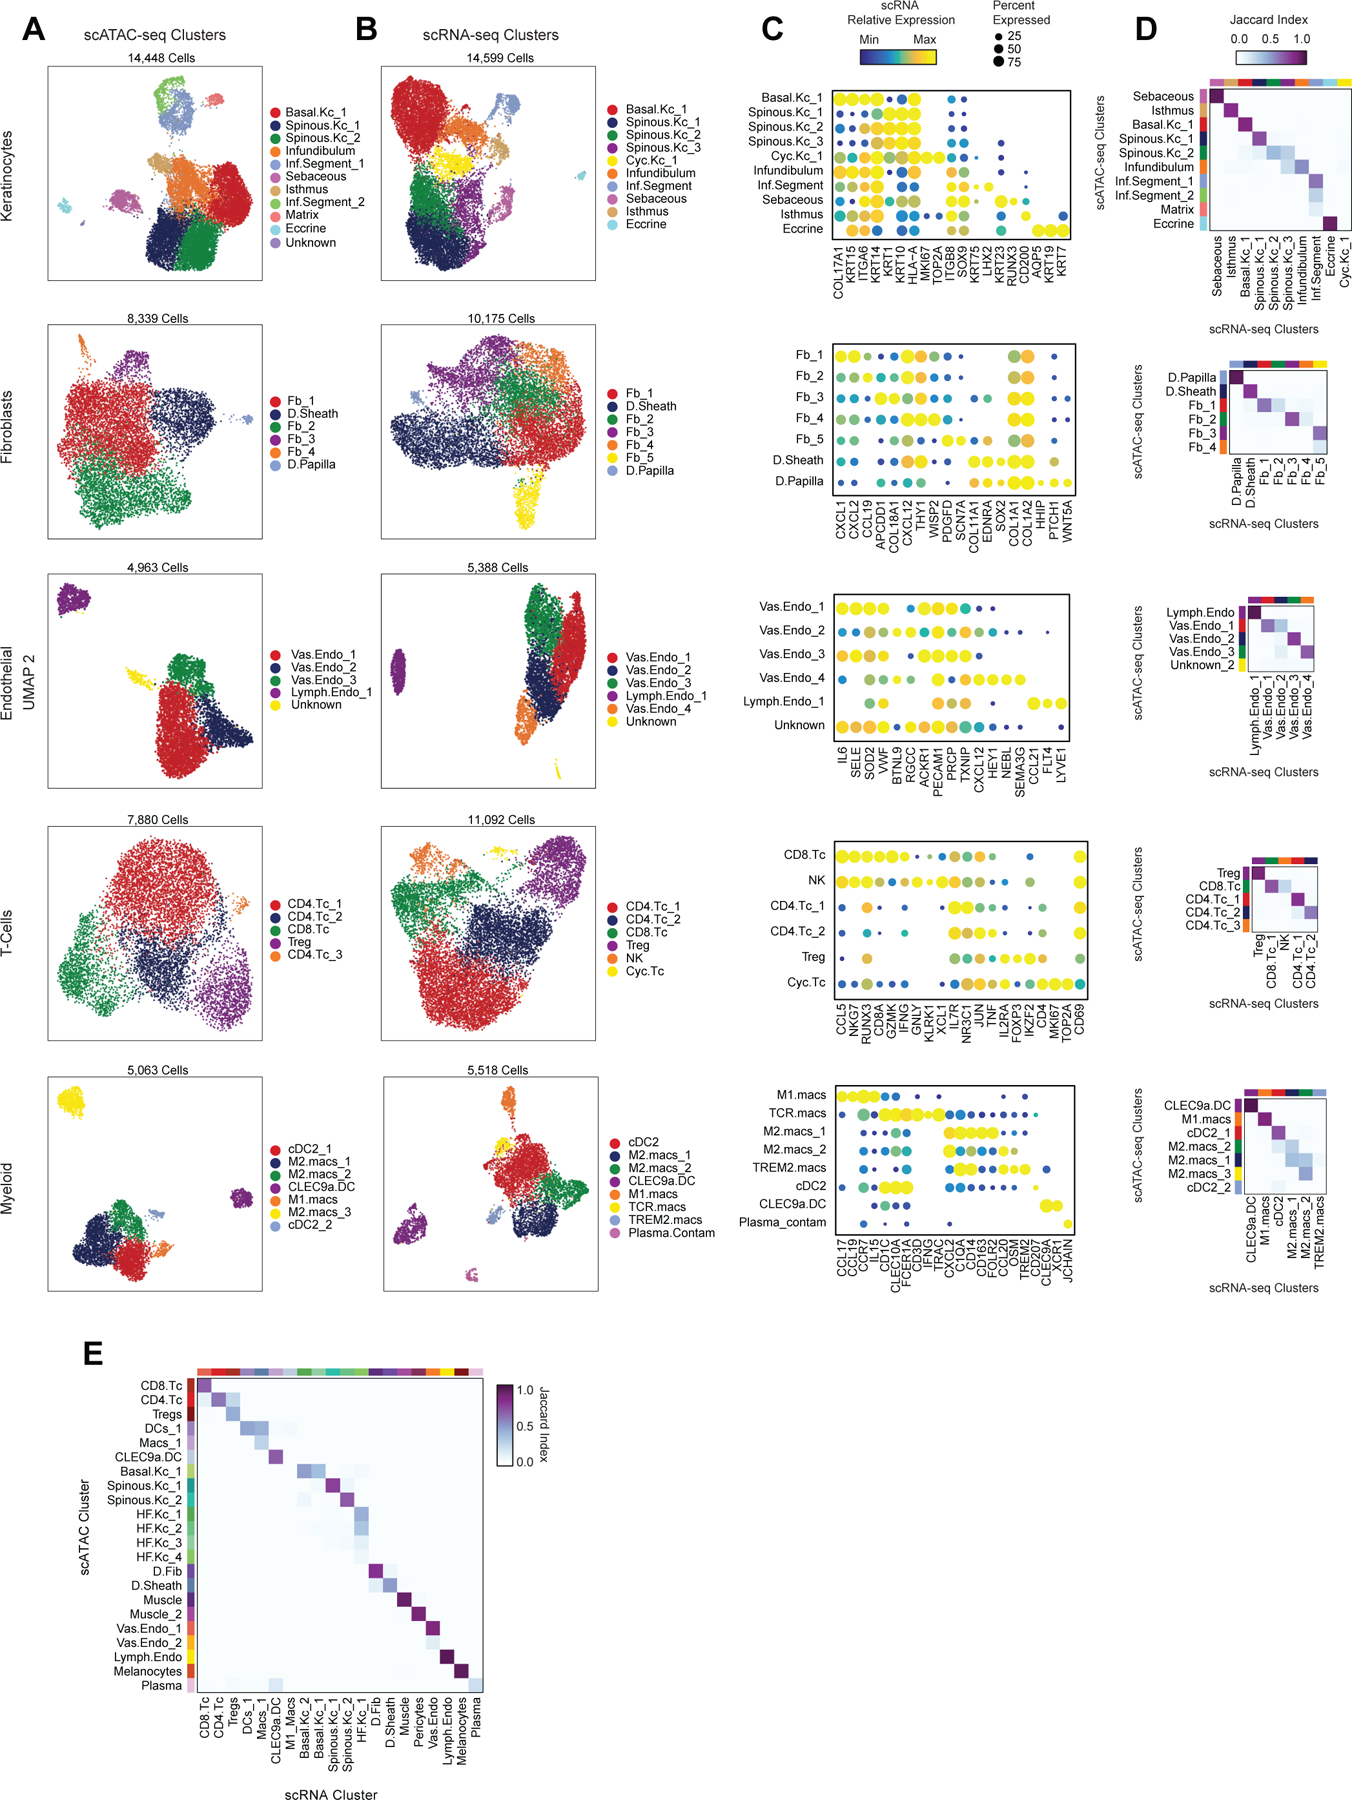
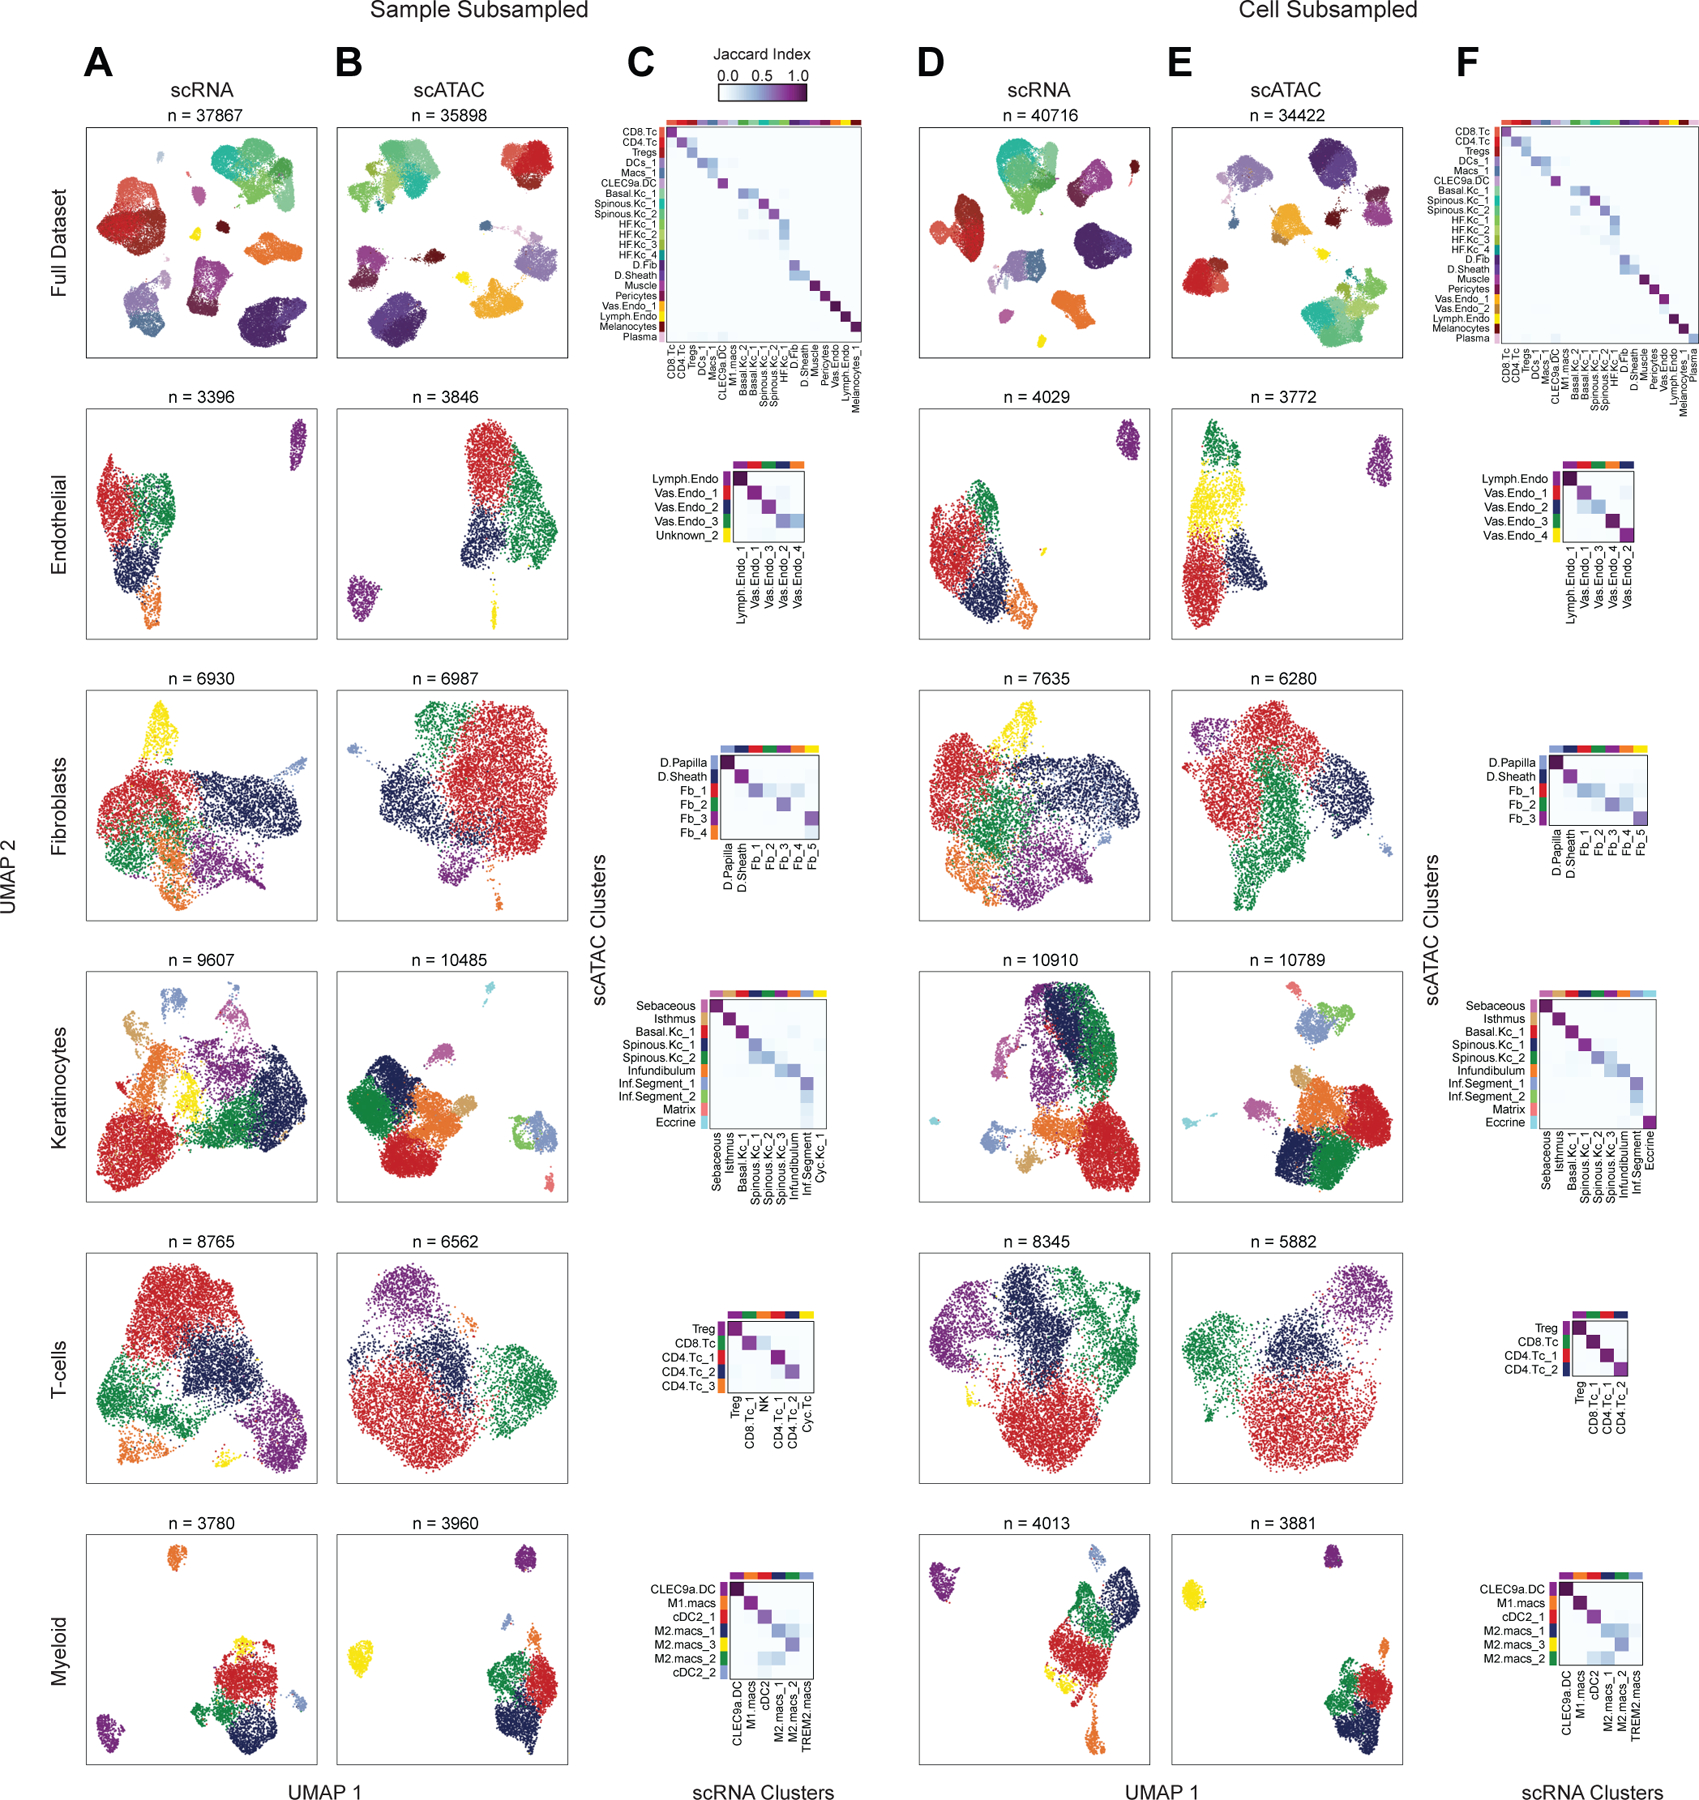
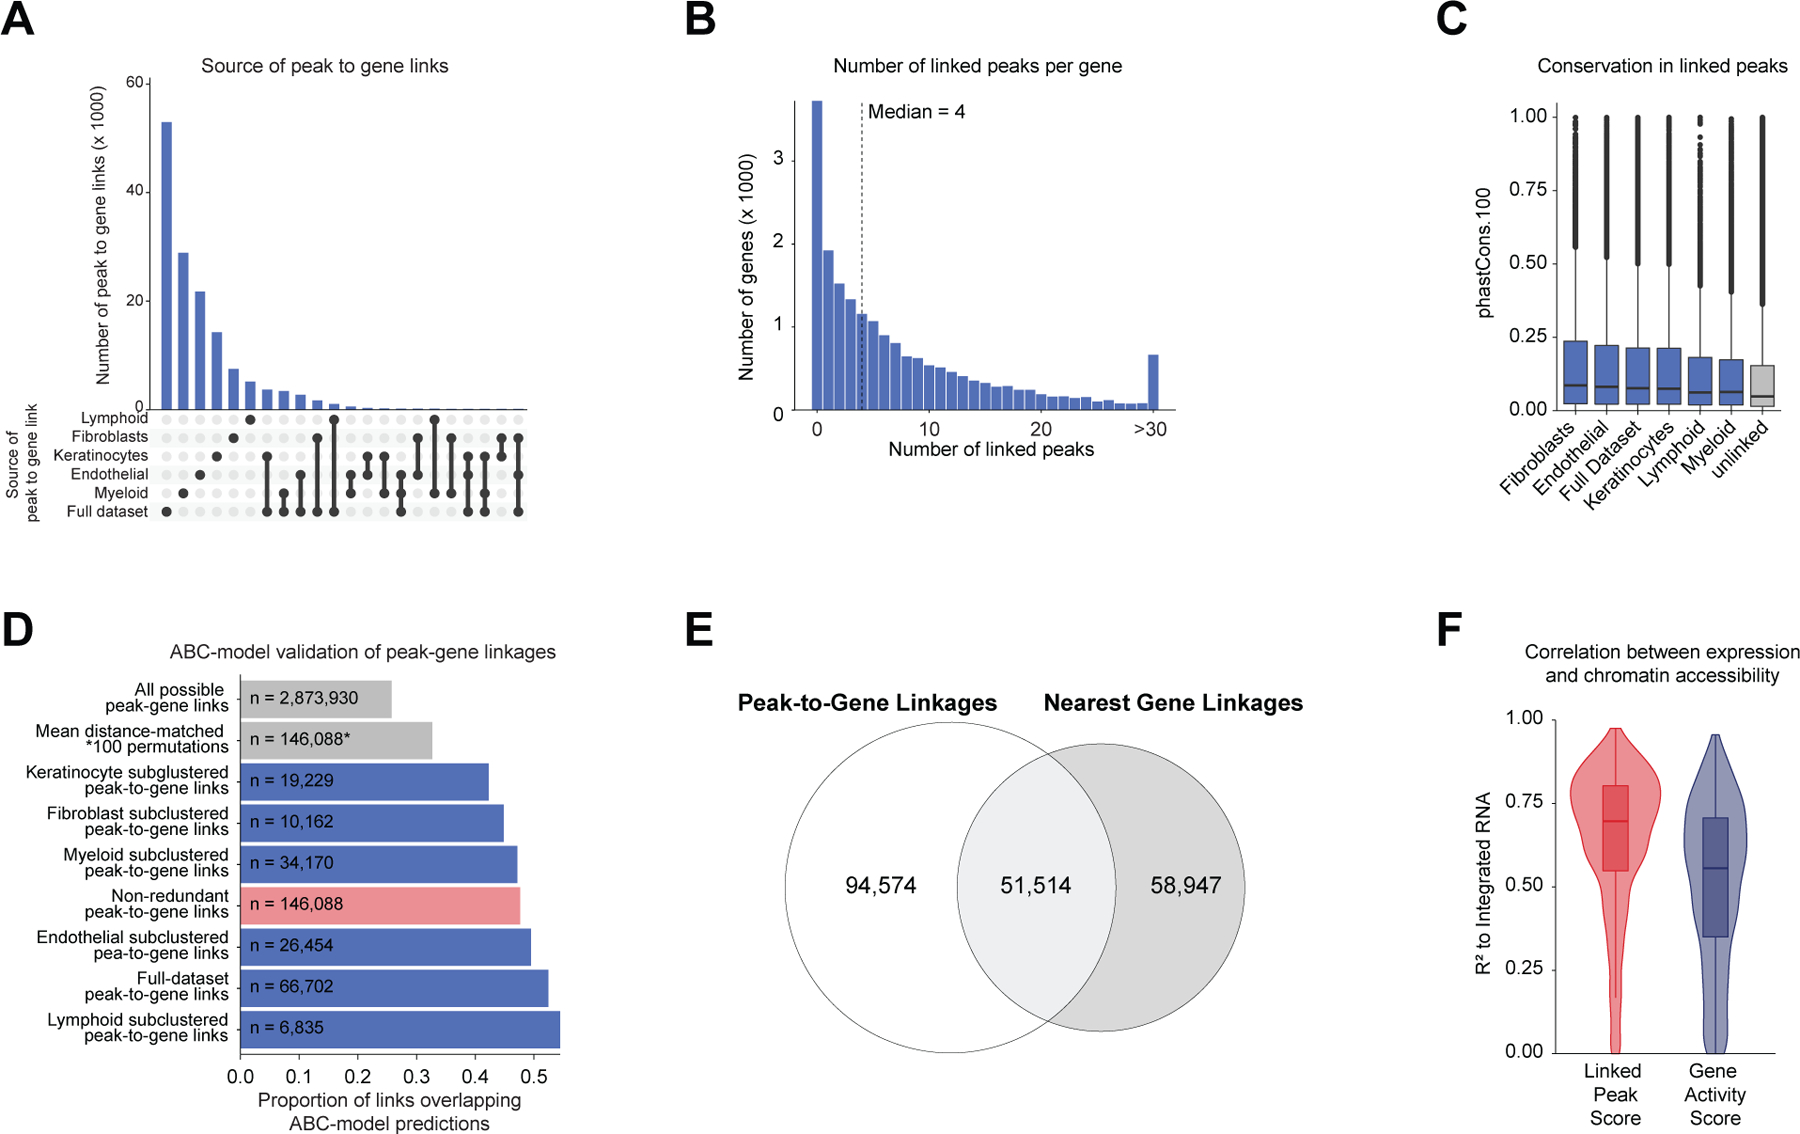
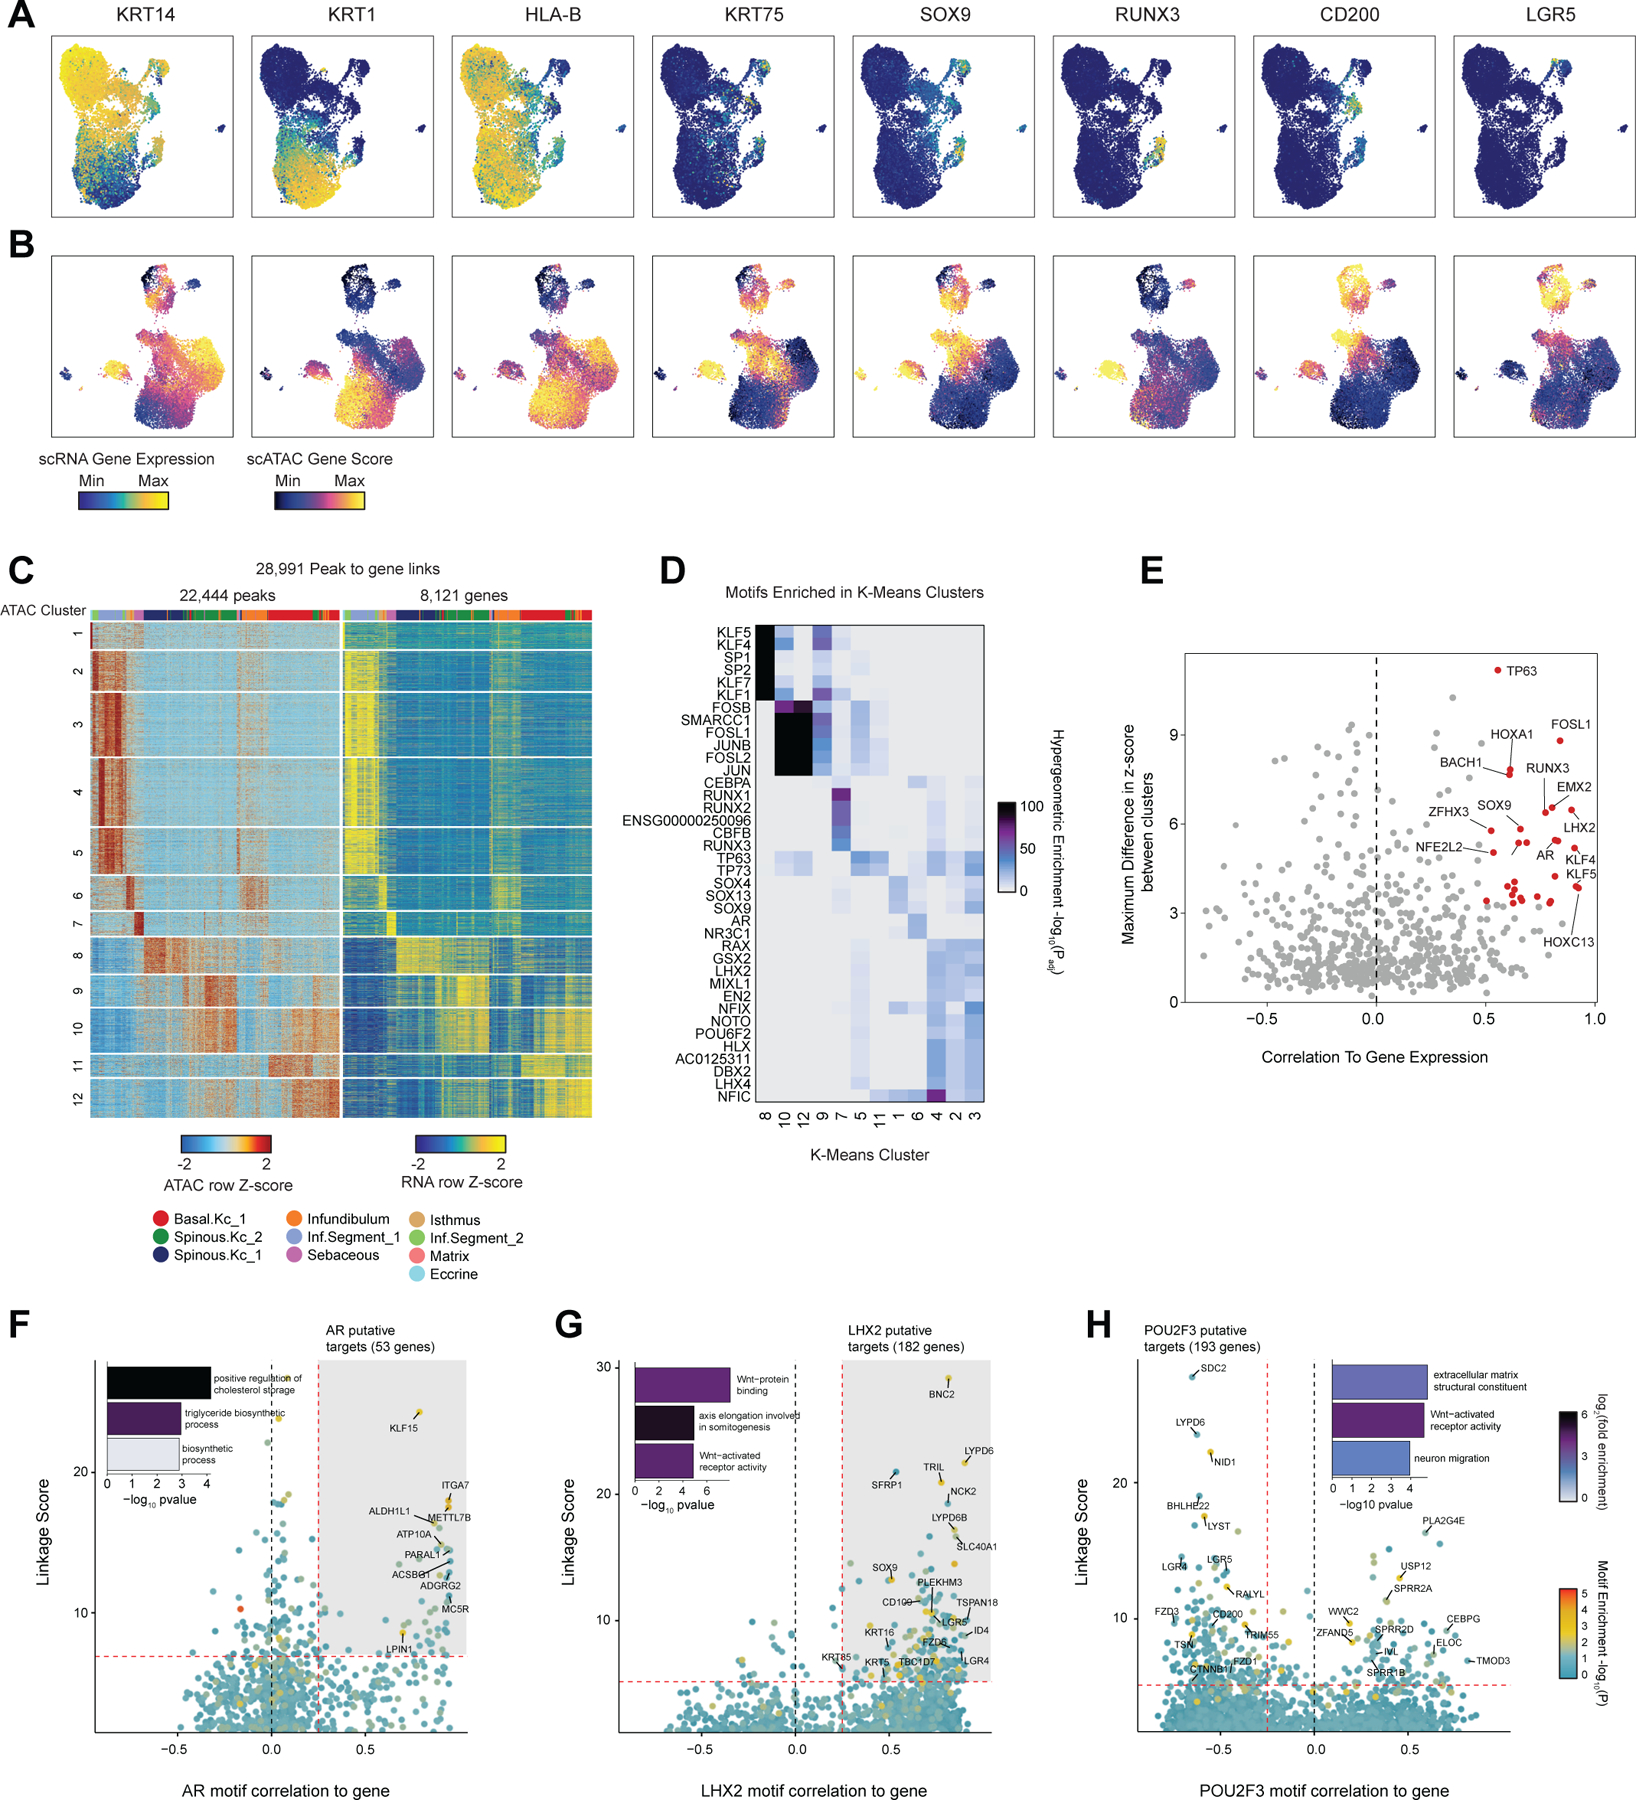
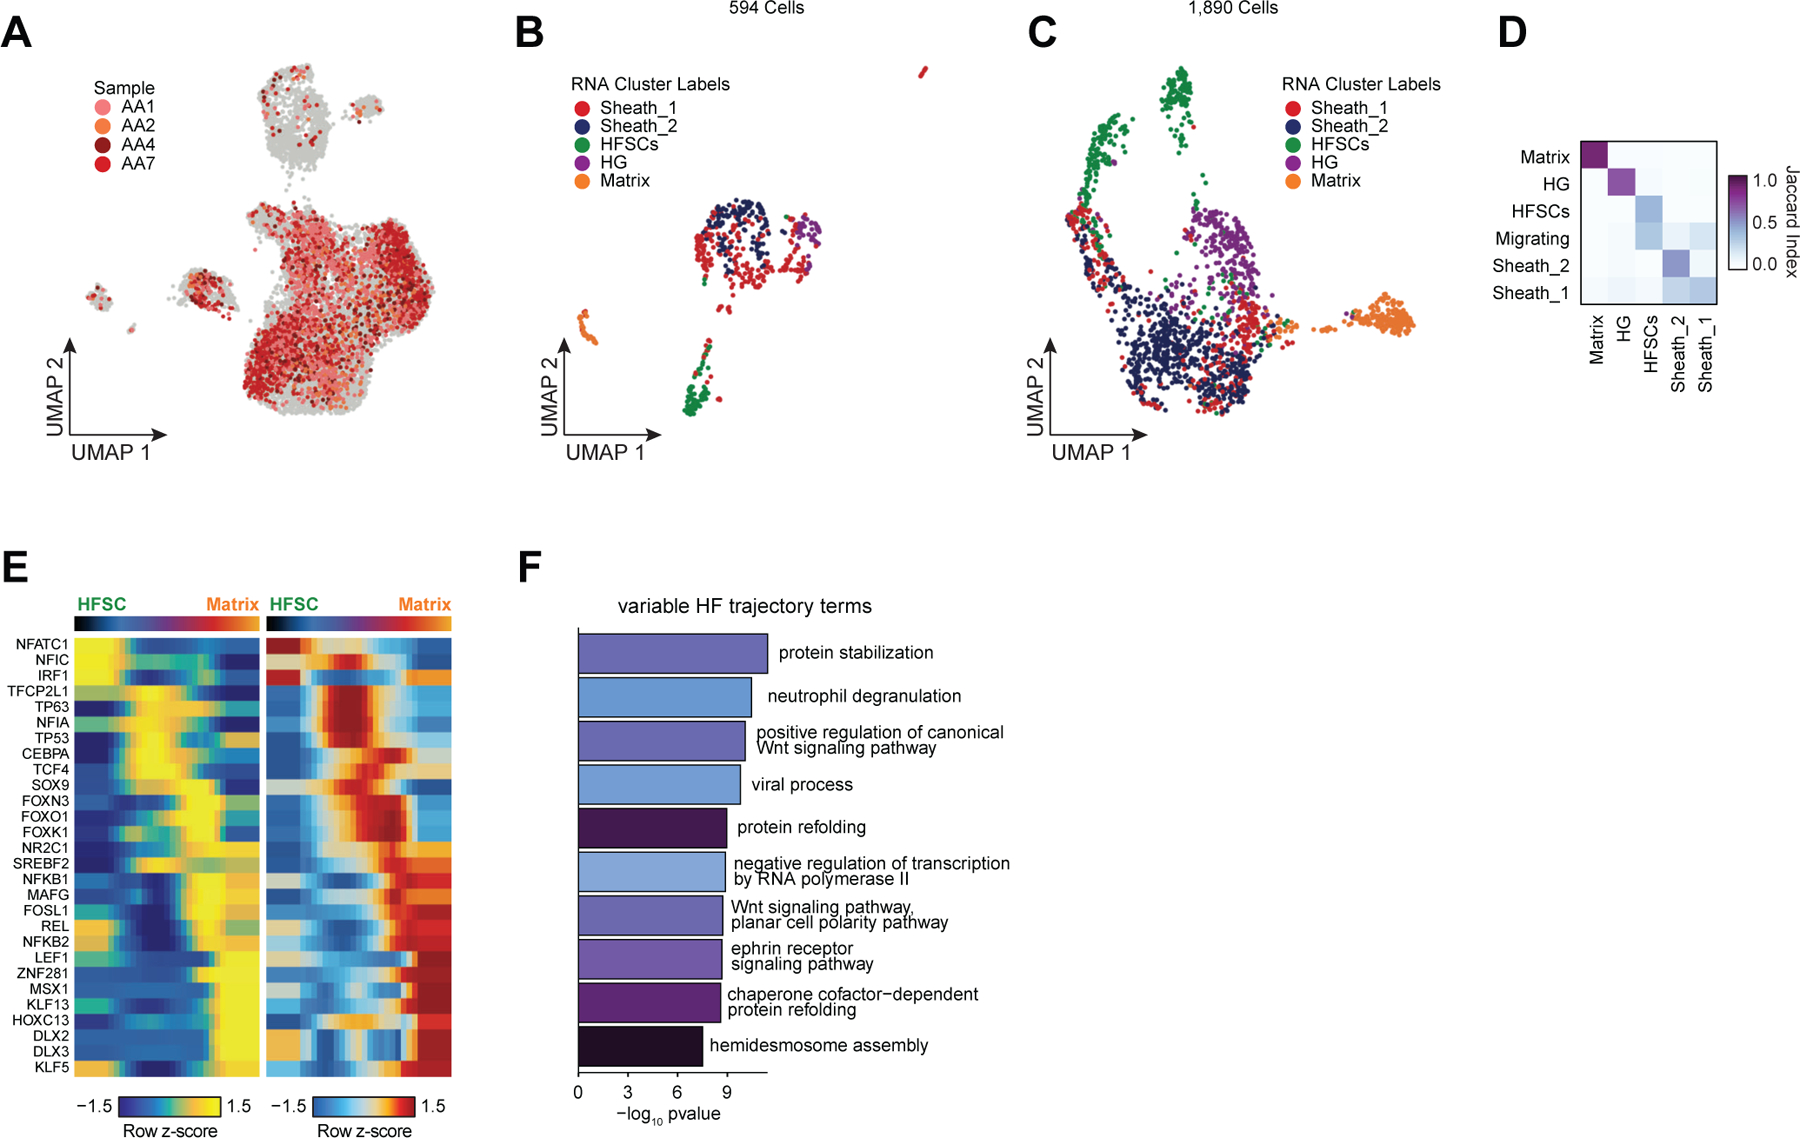
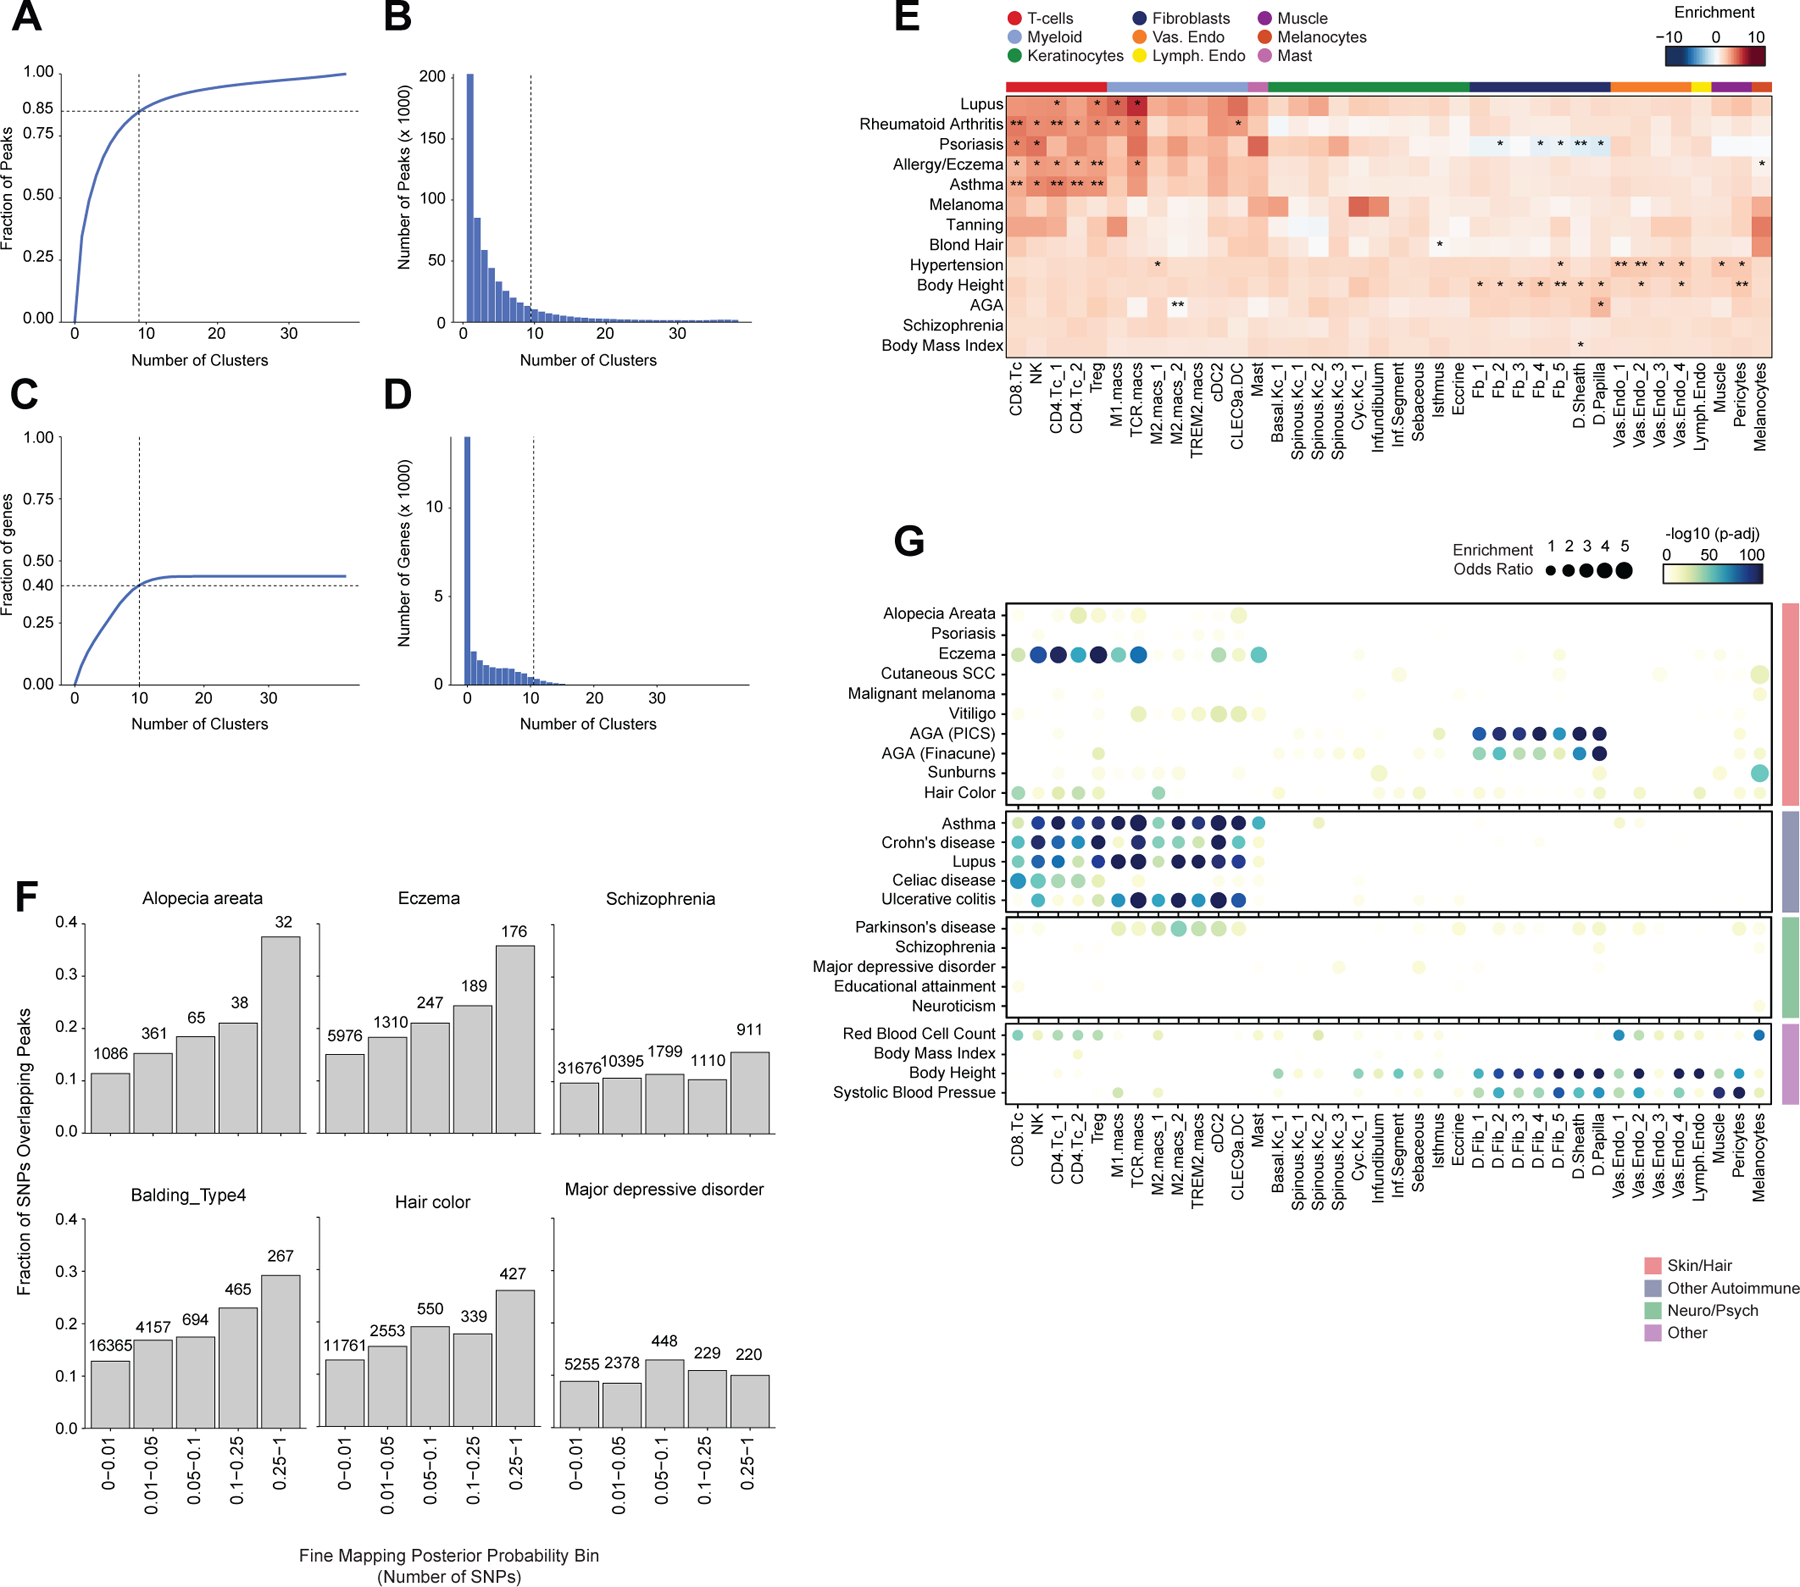
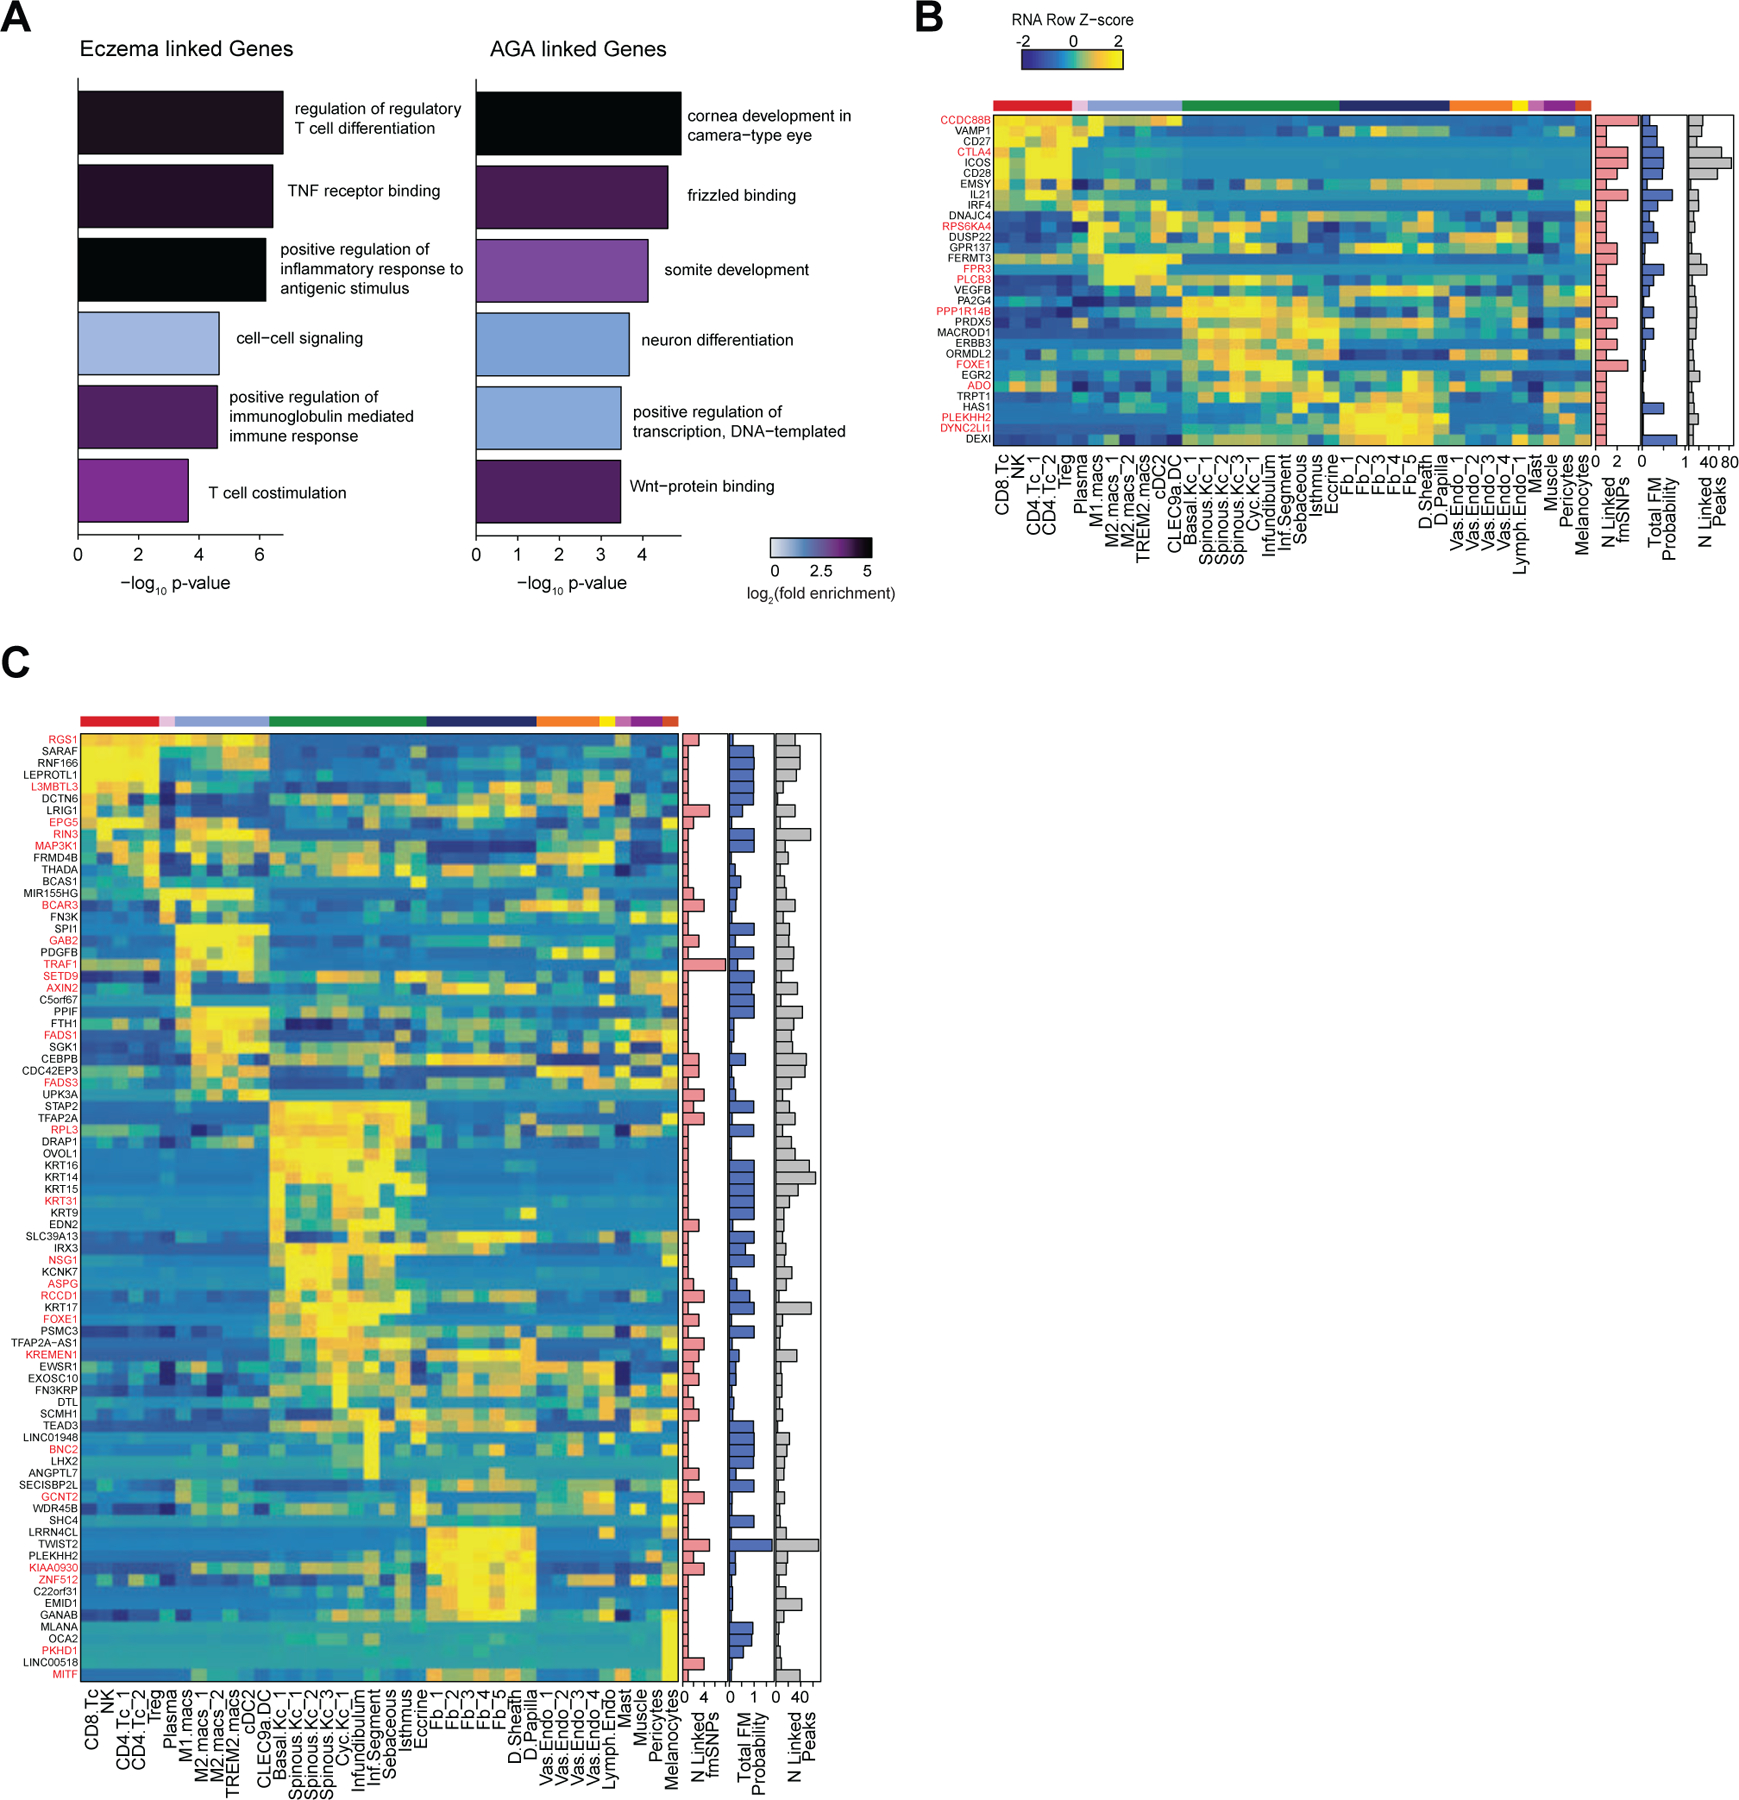
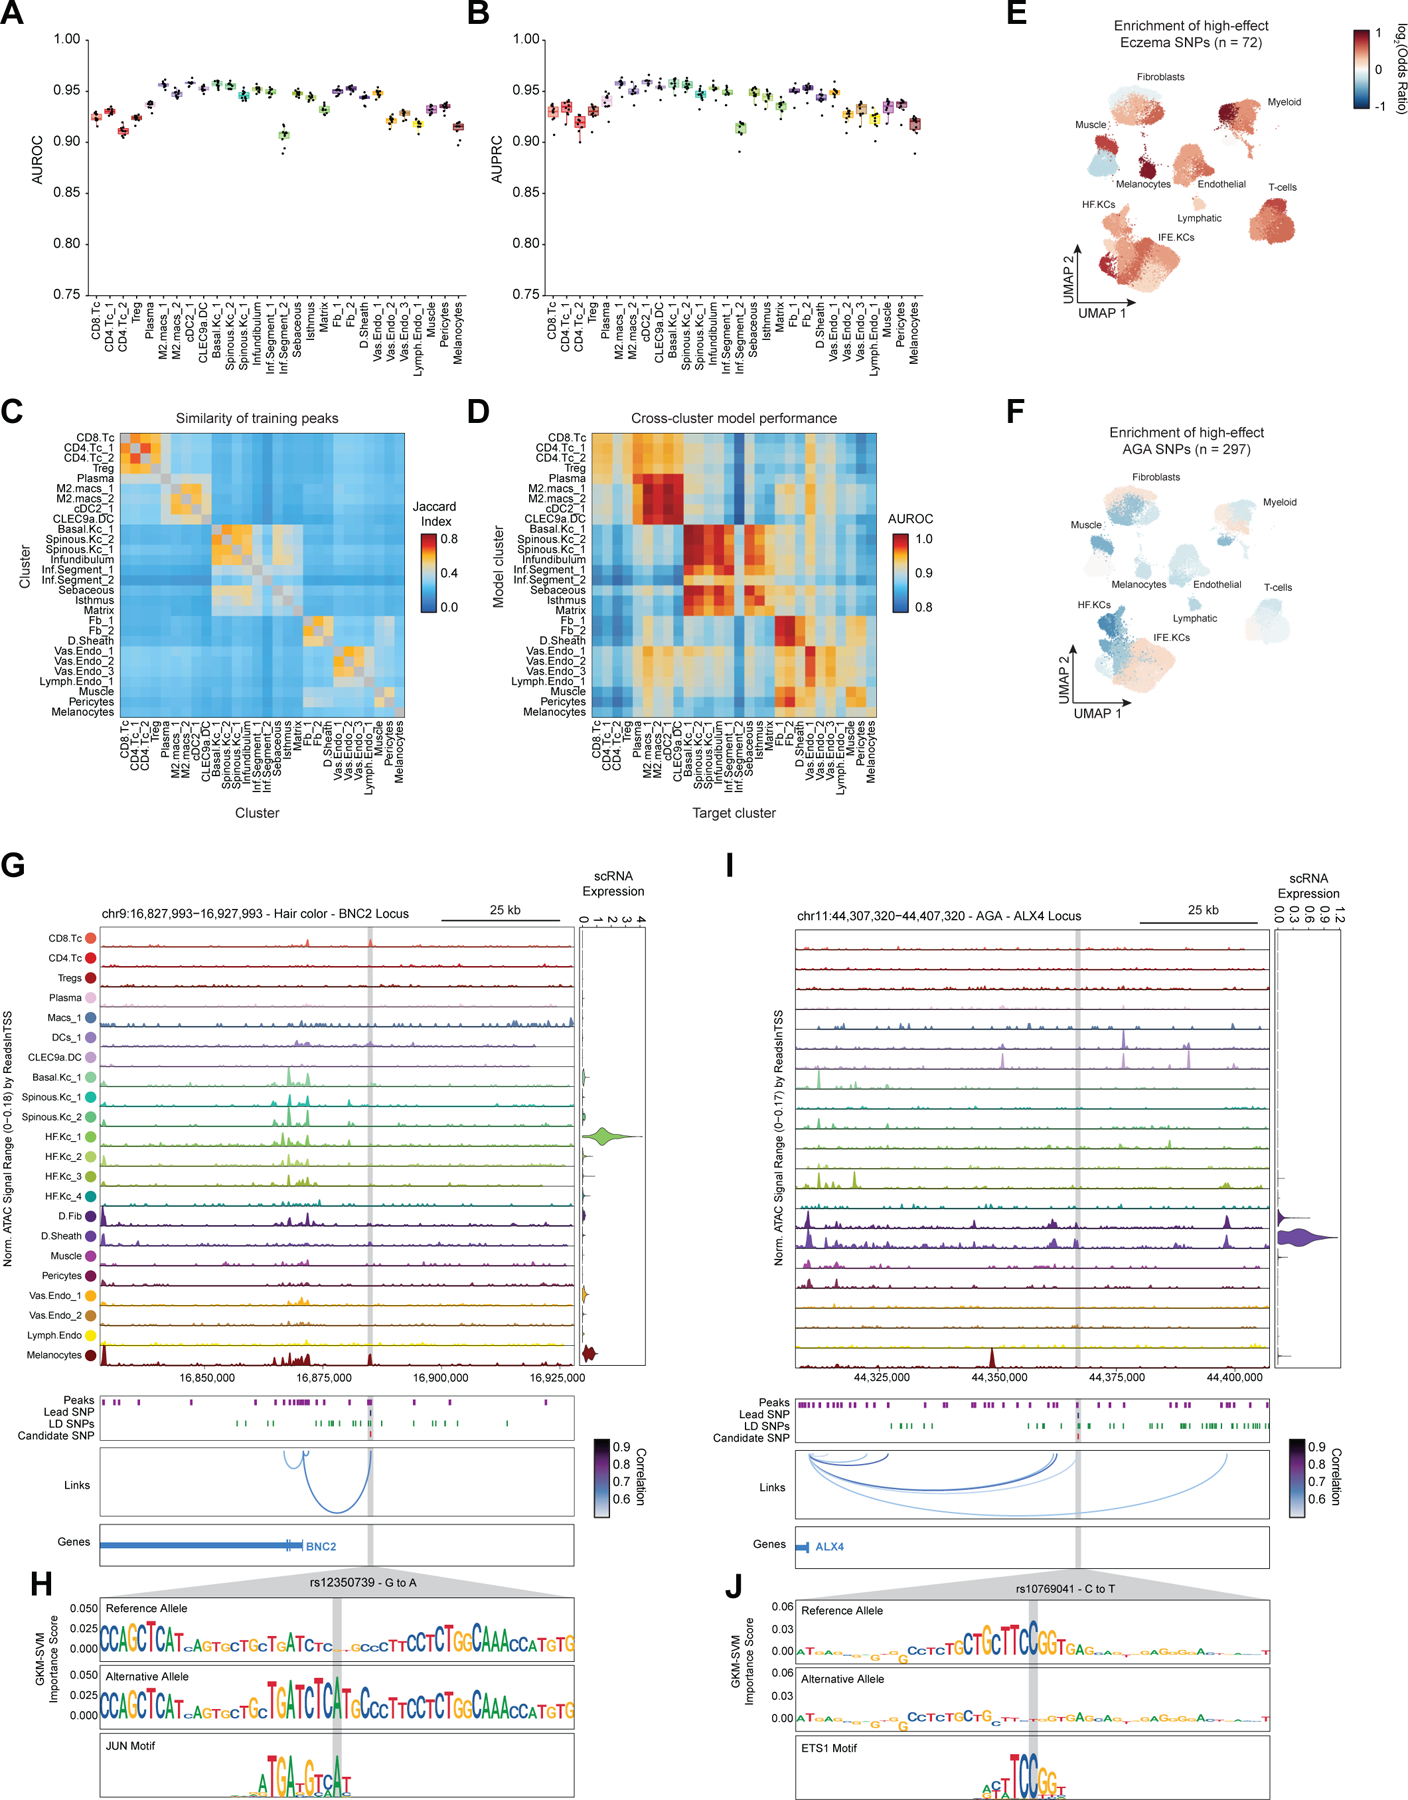
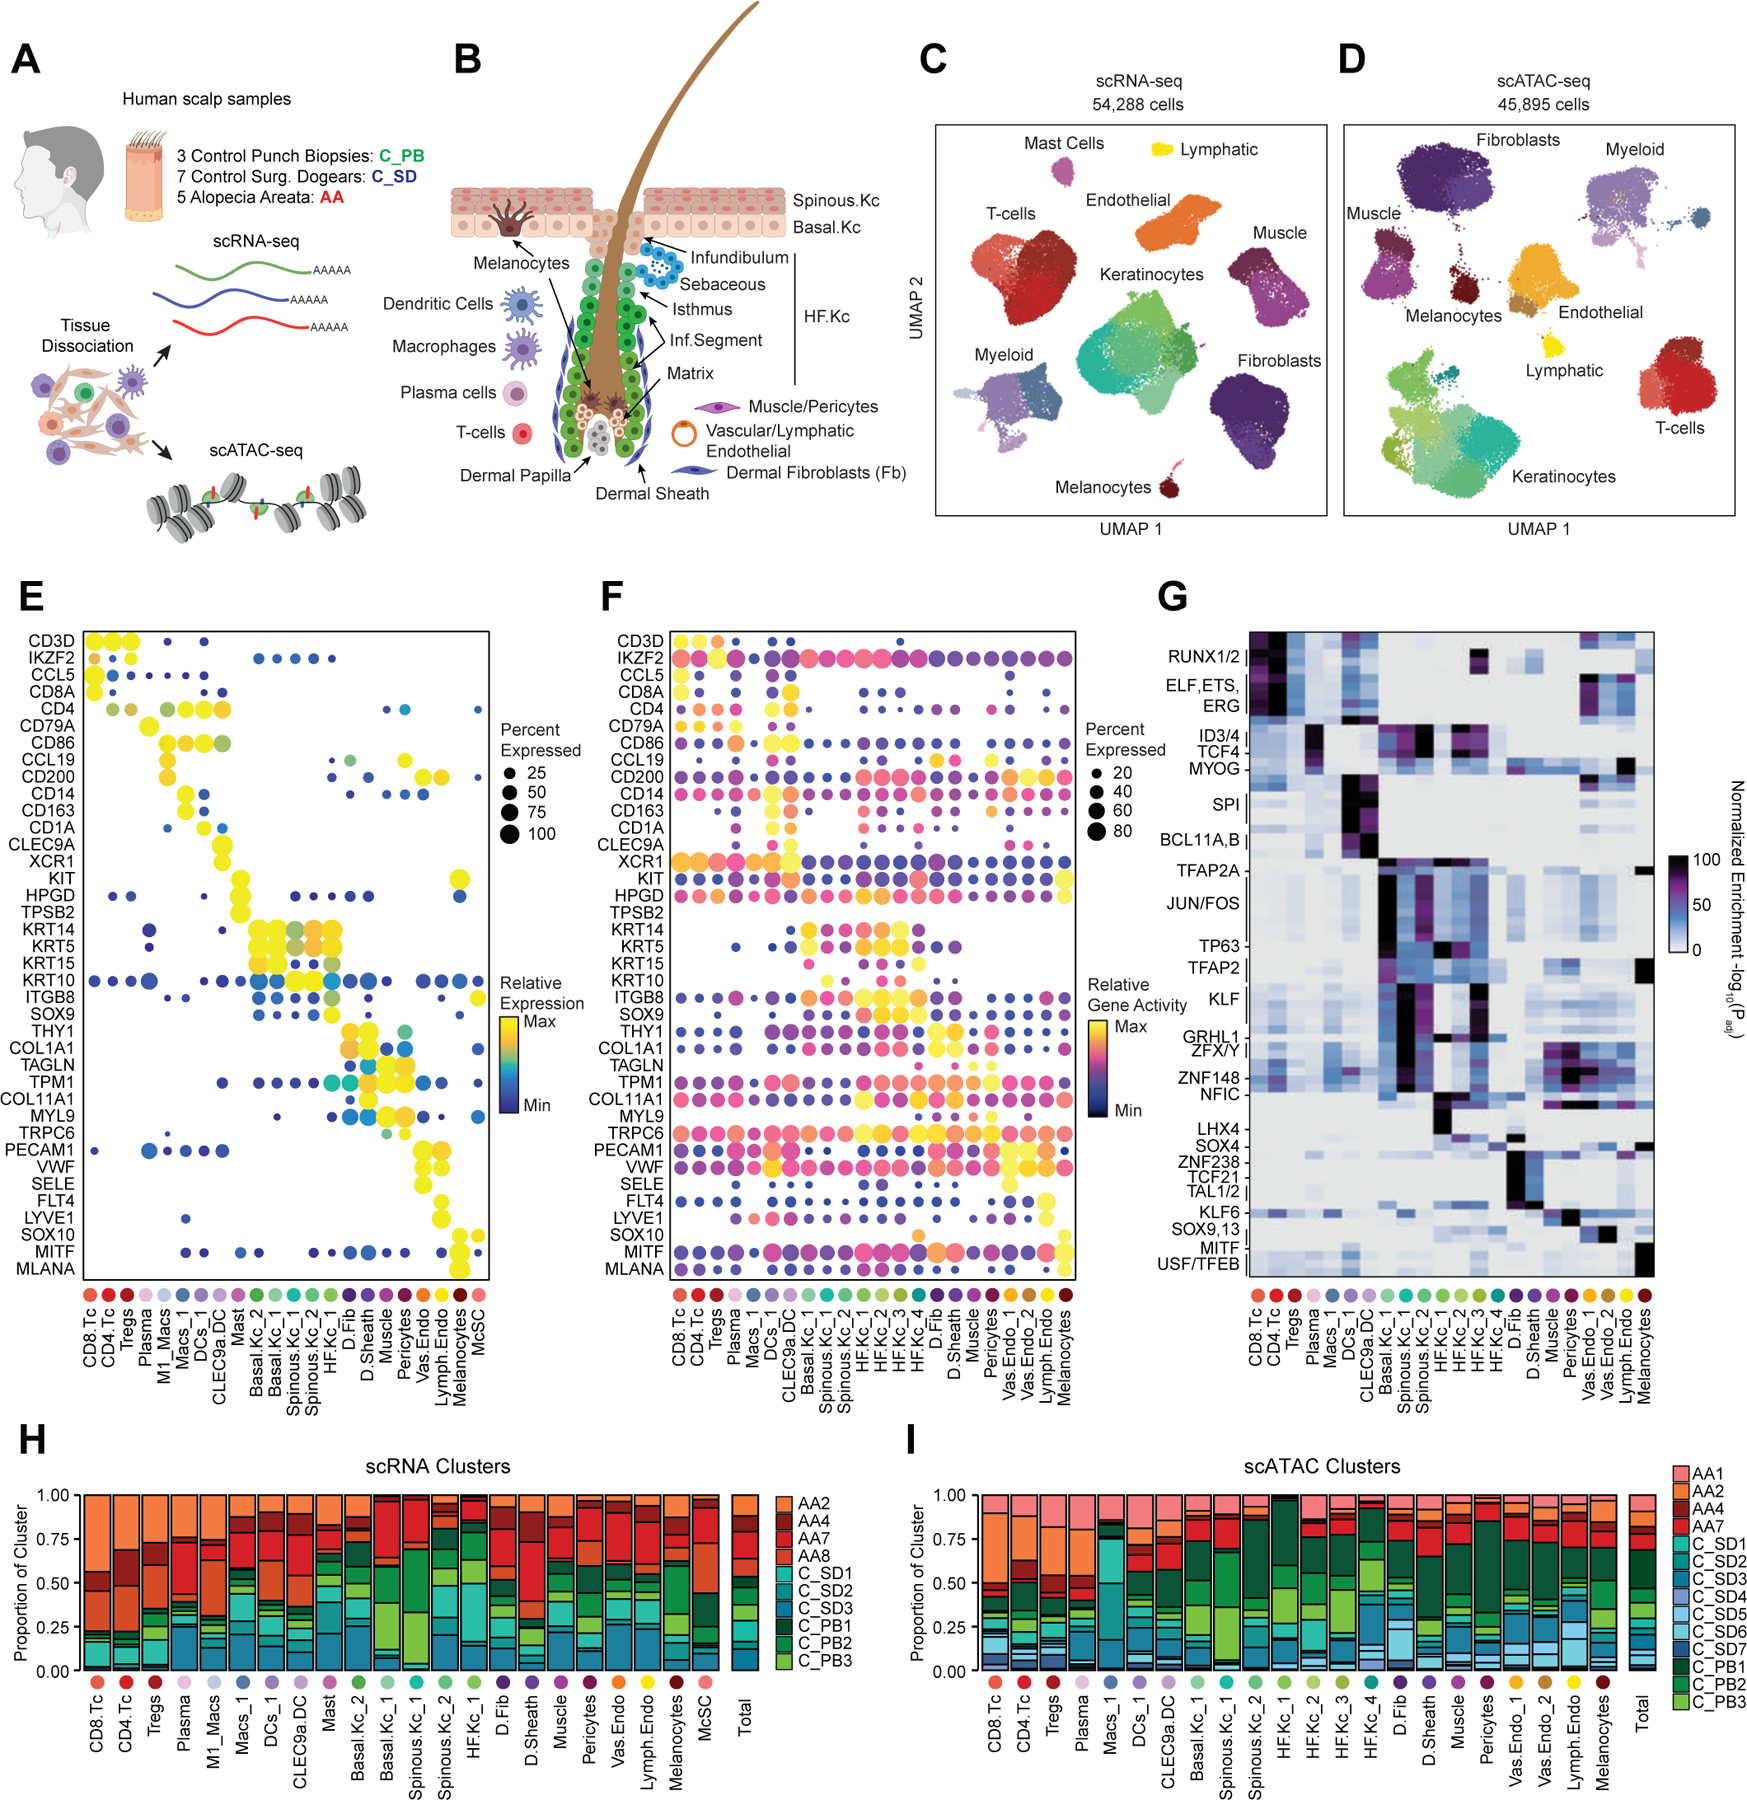
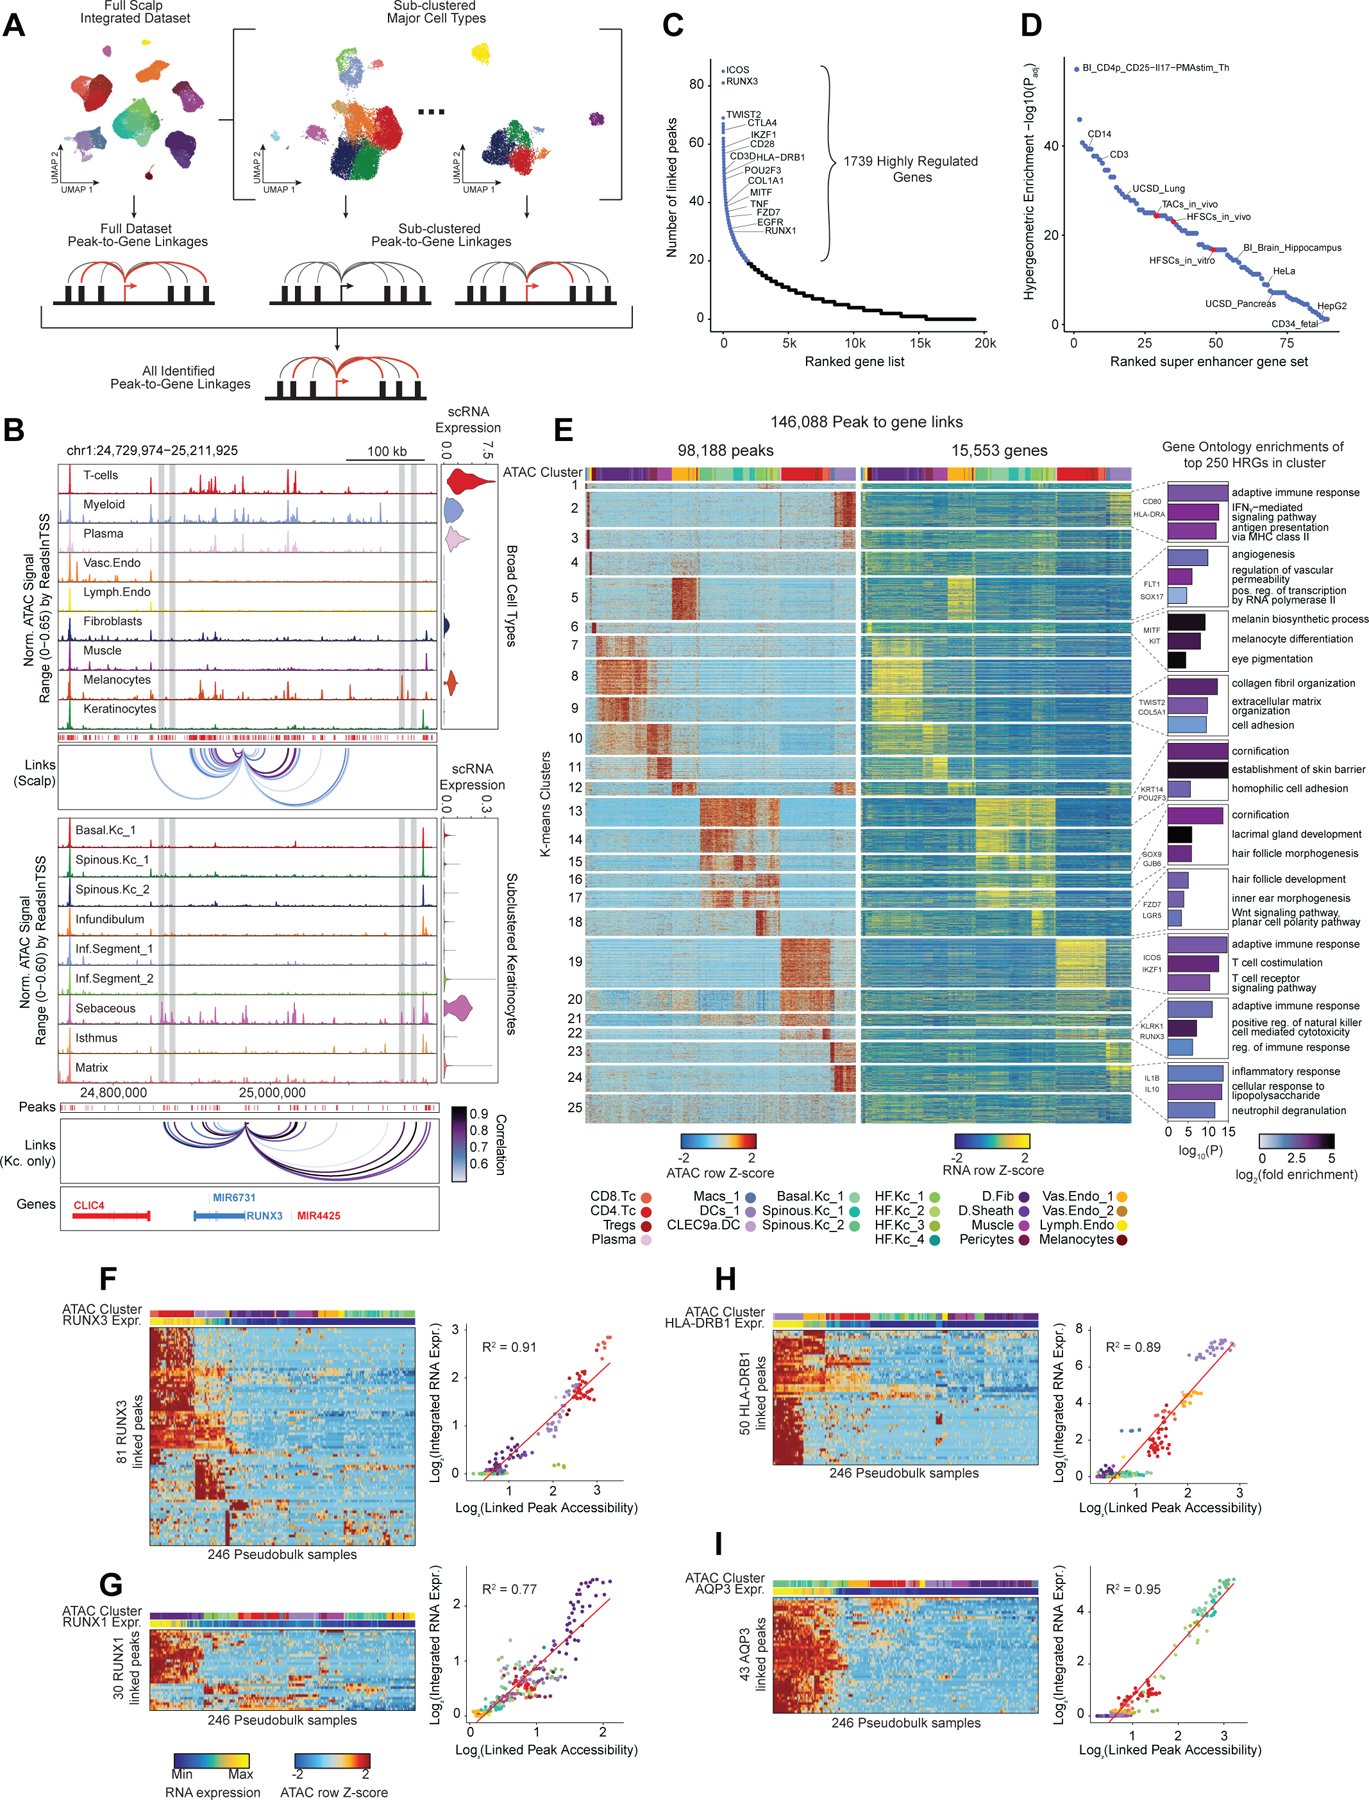
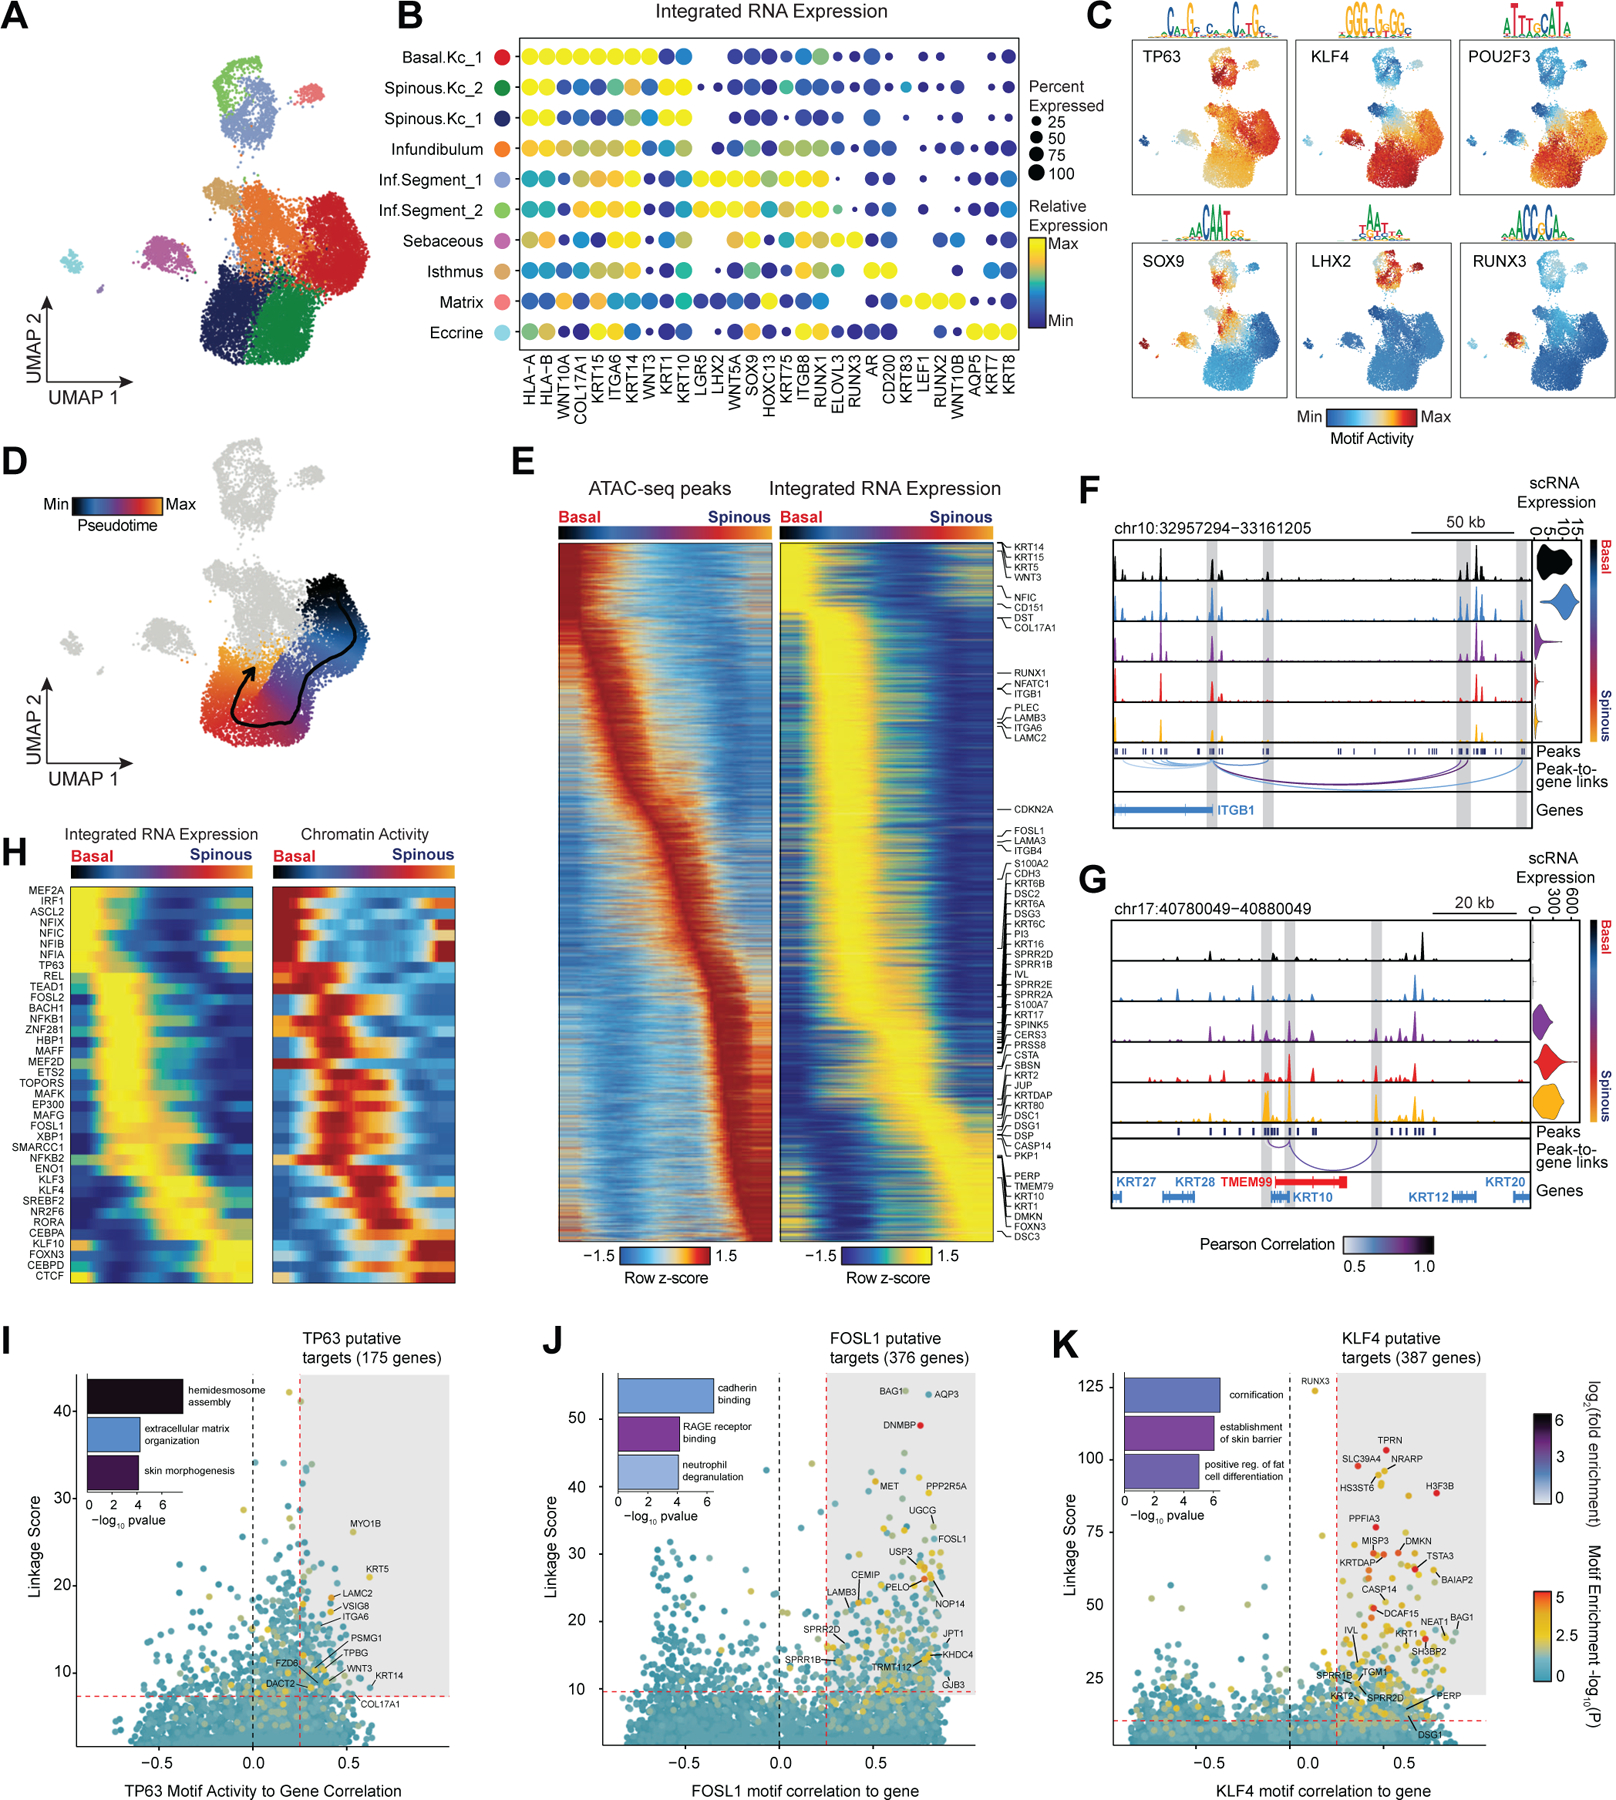
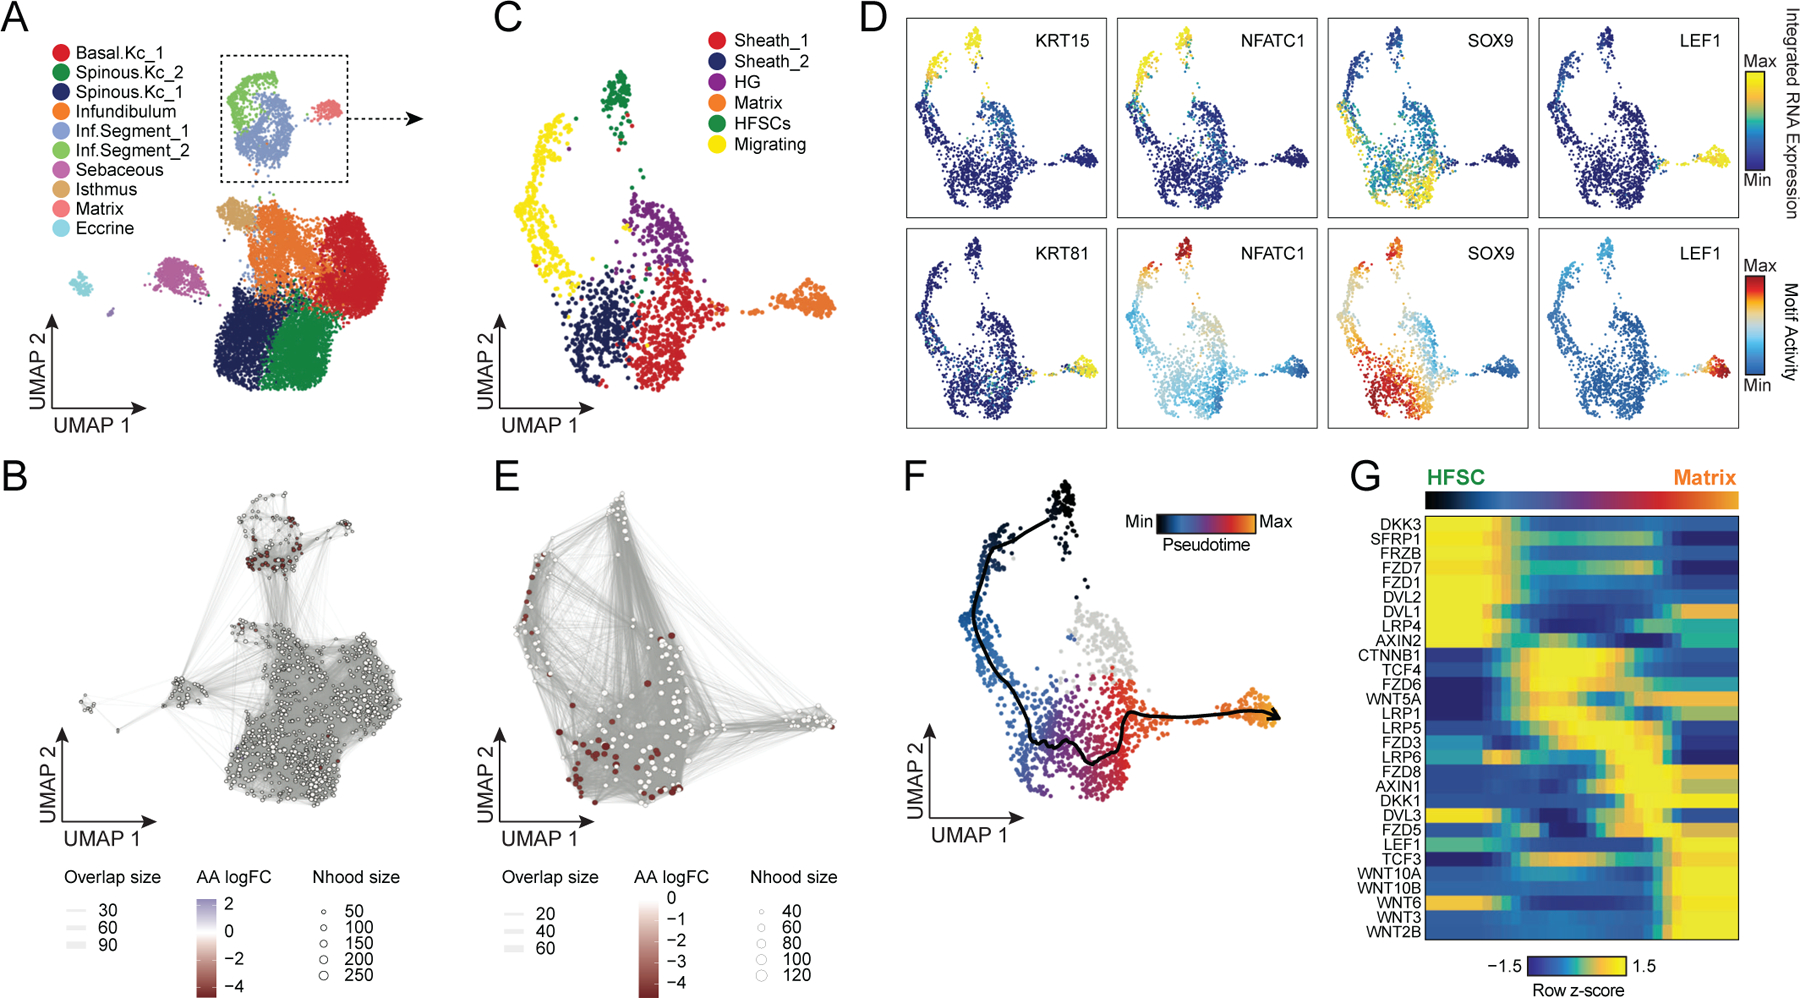
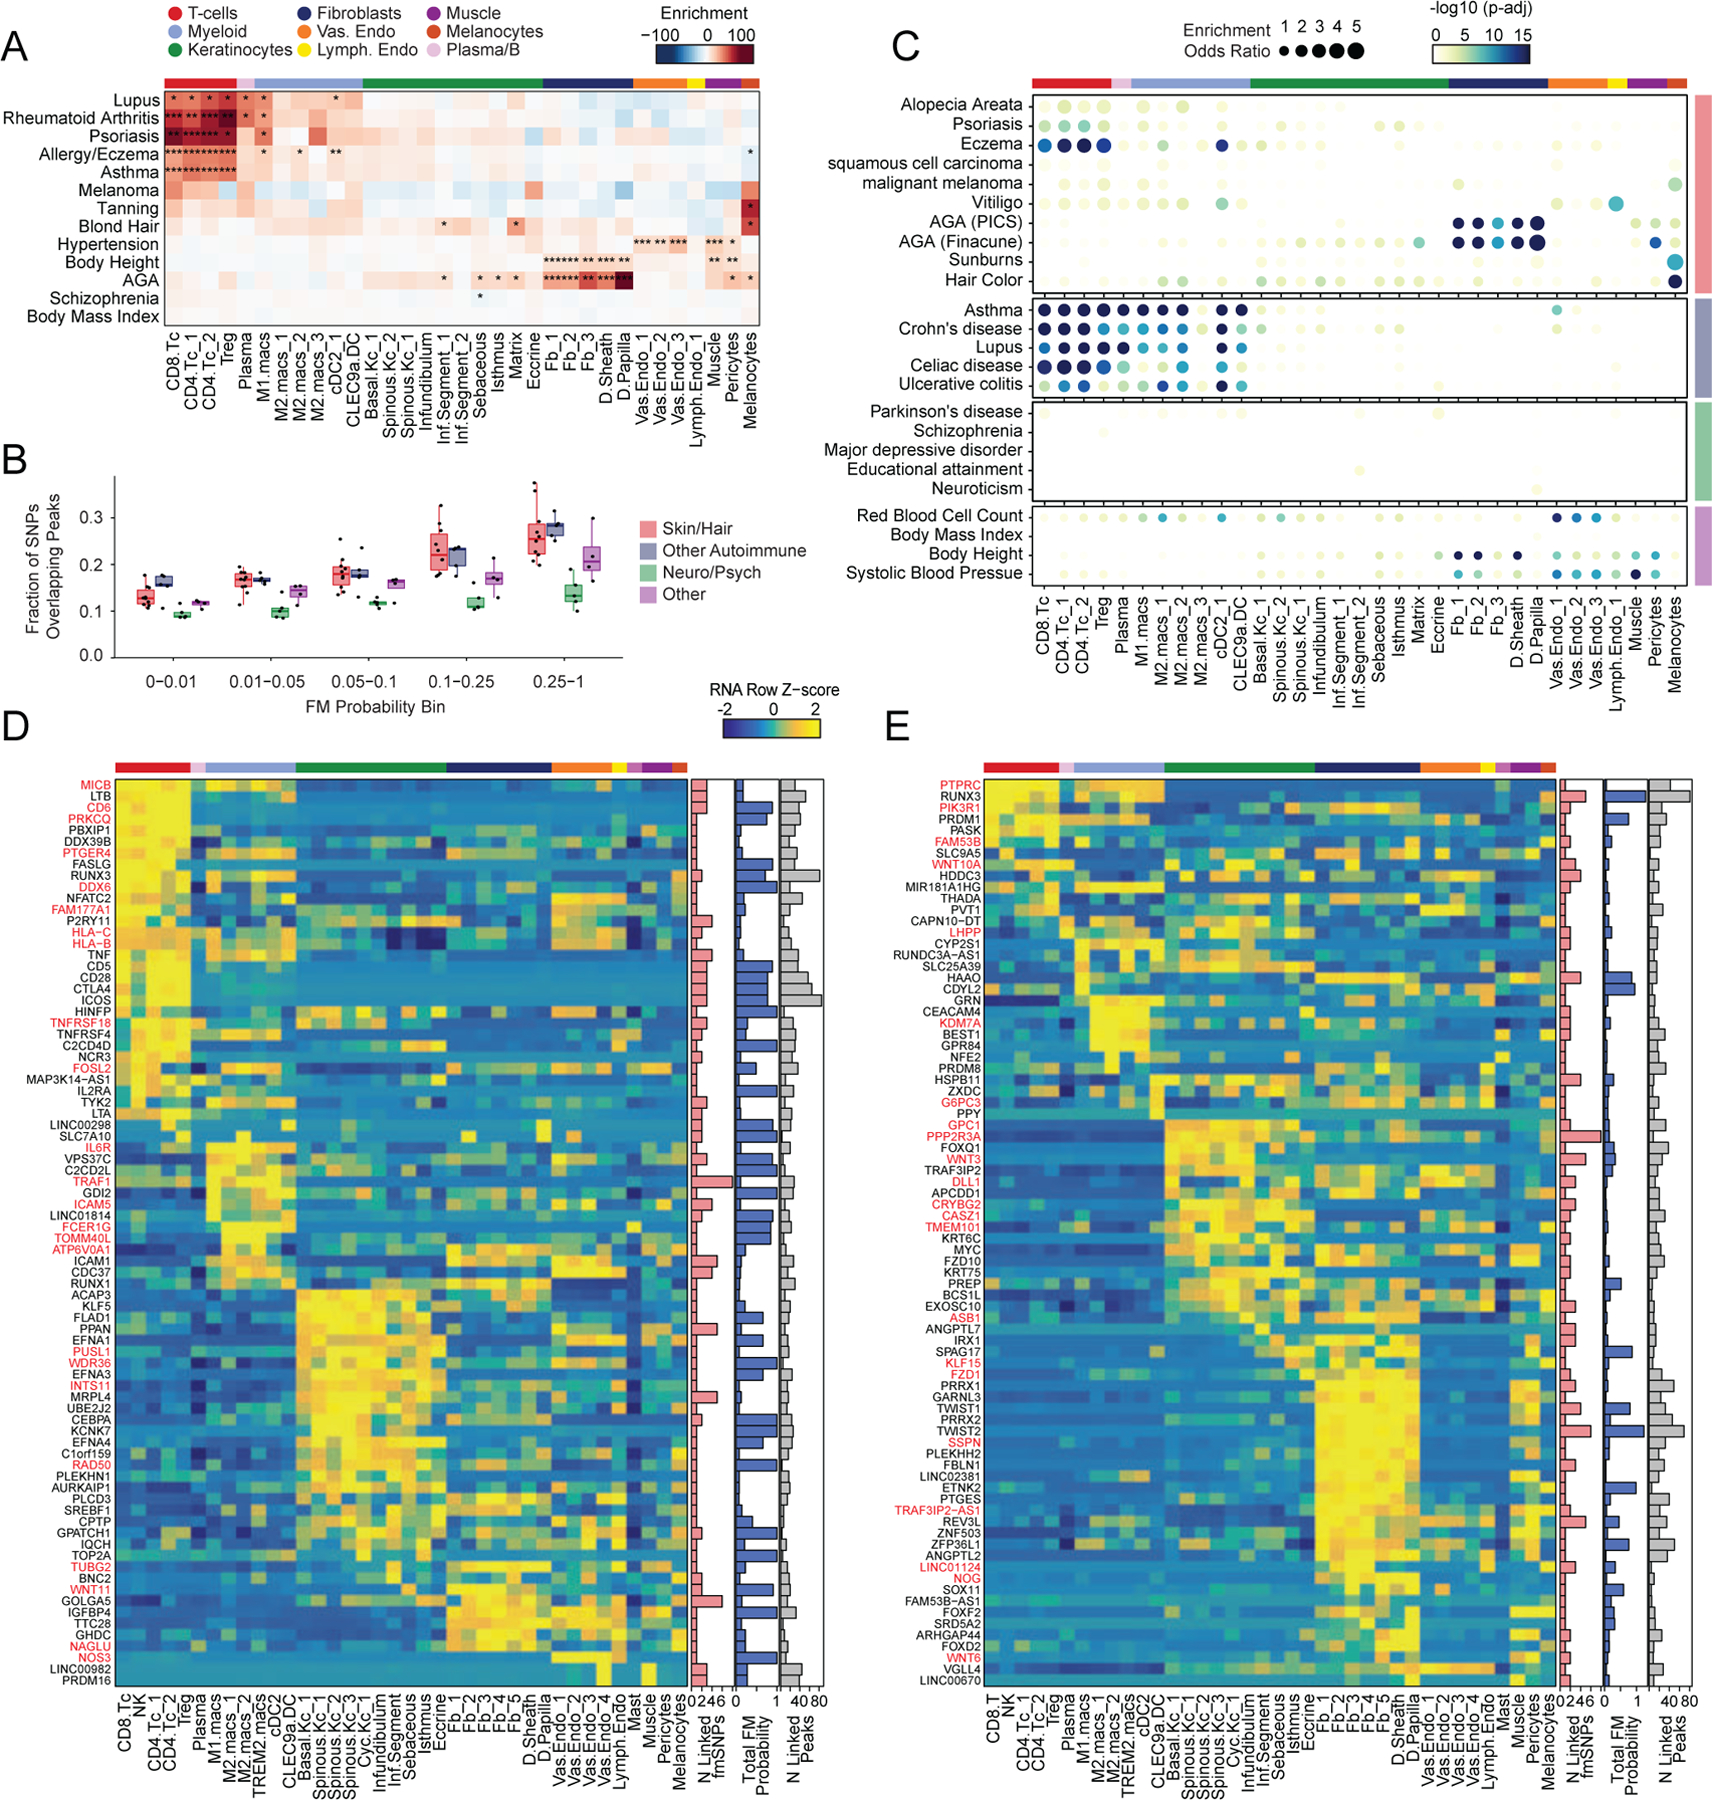
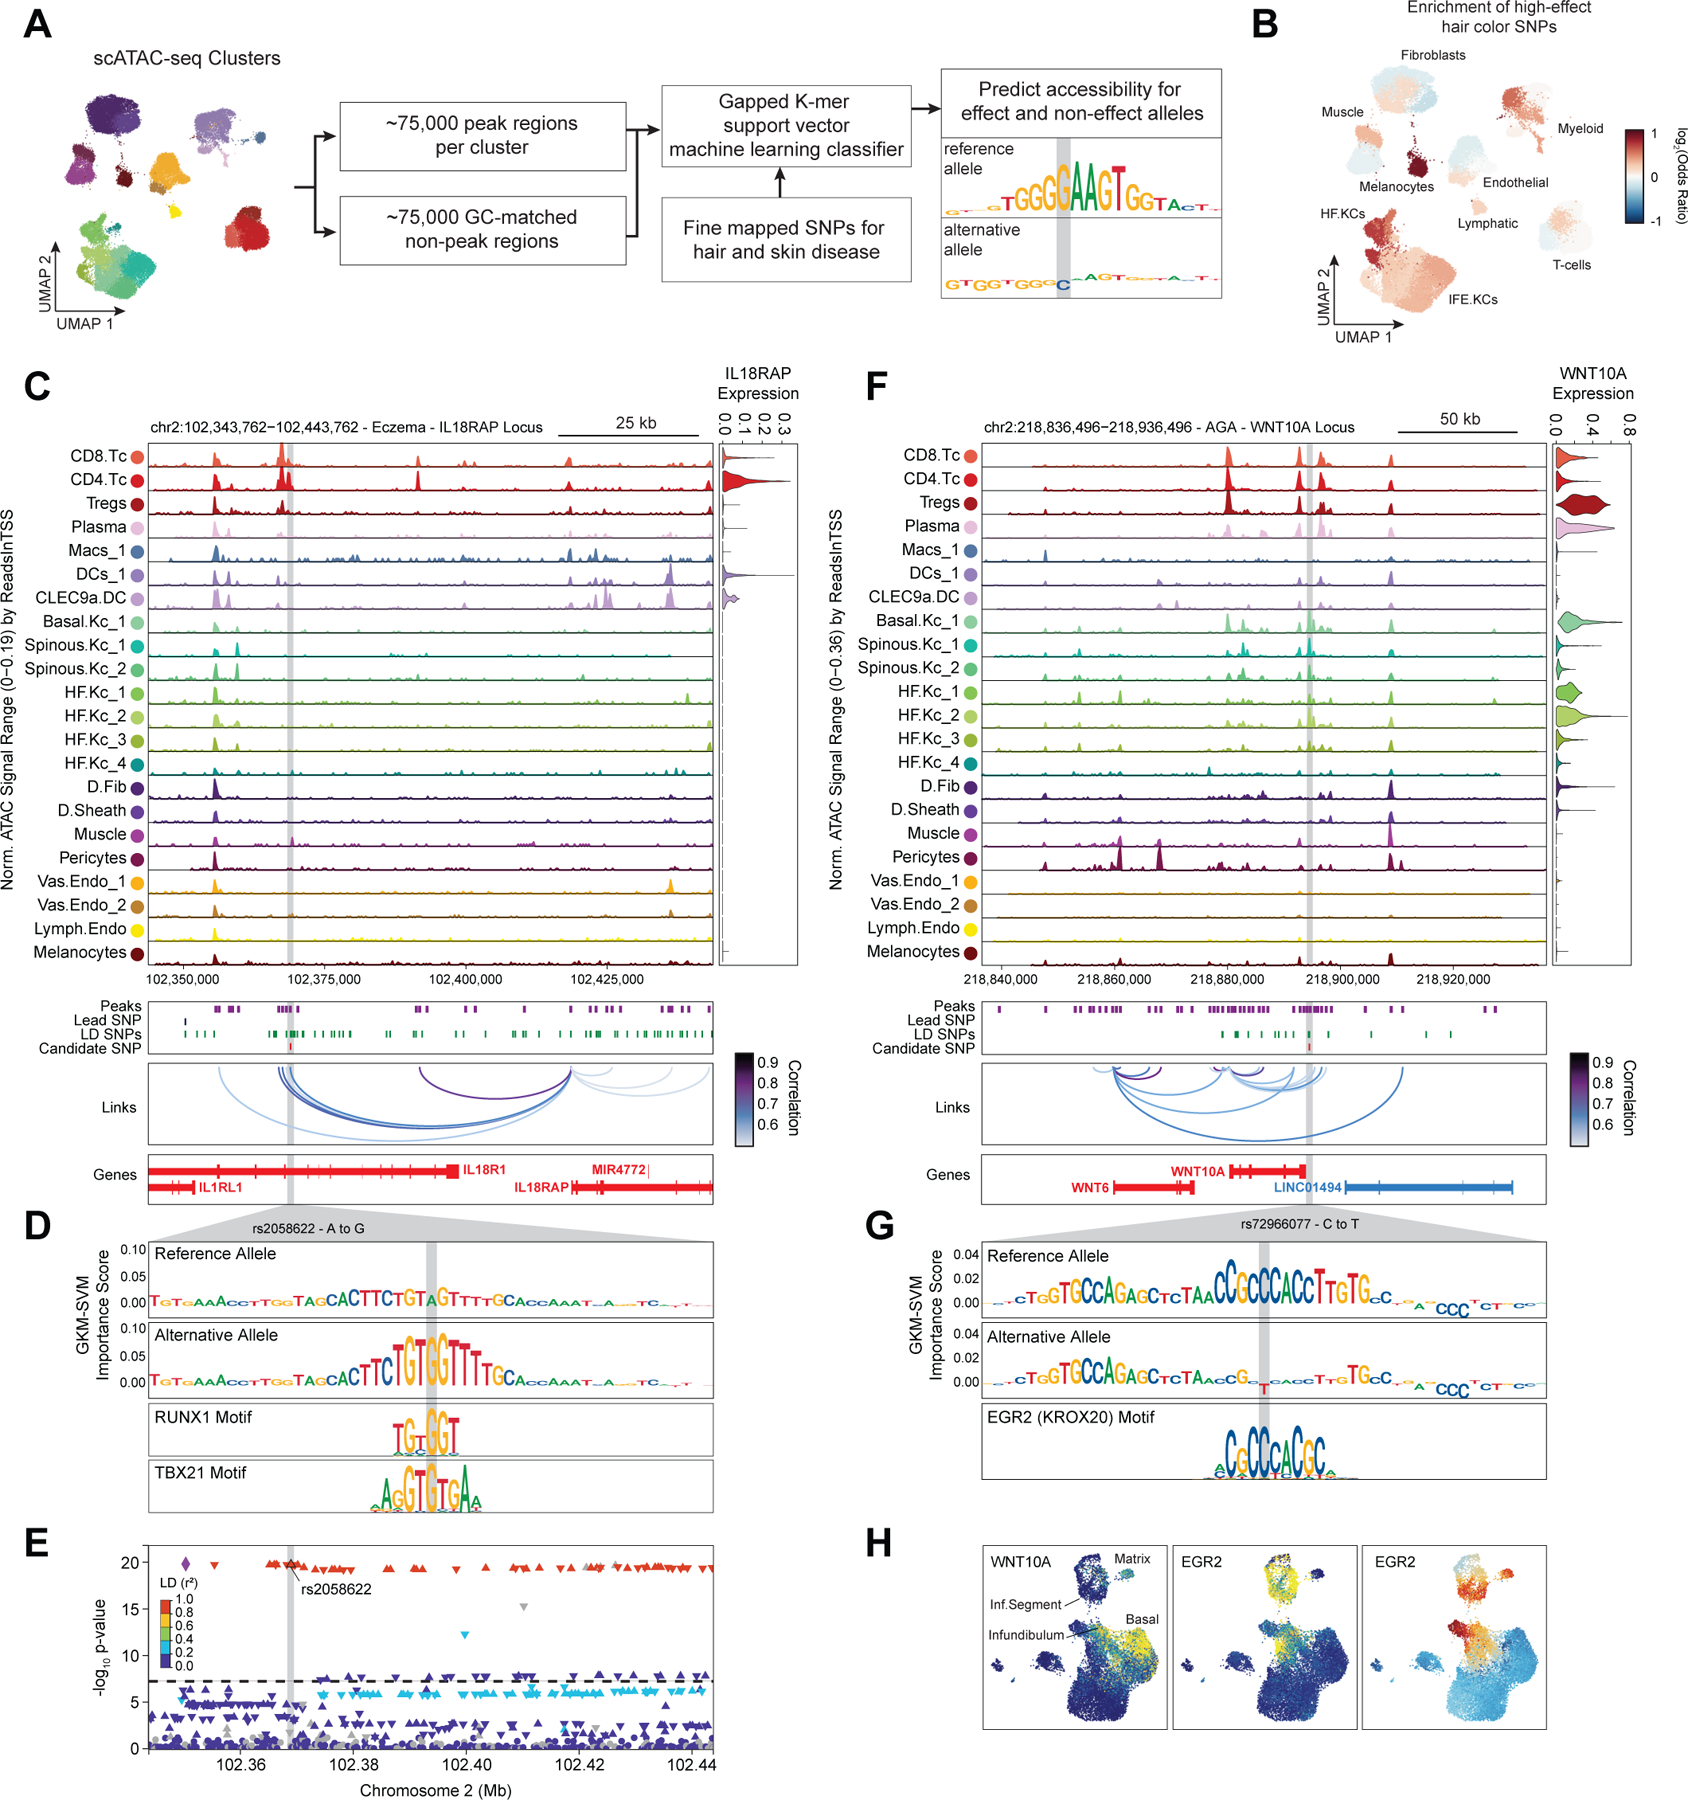
Genome-wide association studies have identified many loci associated with hair and skin disease, but identification of causal variants requires deciphering of gene-regulatory networks in relevant cell types. We generated matched single-cell chromatin profiles and transcriptomes from scalp tissue from healthy controls and patients with alopecia areata, identifying diverse cell types of the hair follicle niche. By interrogating these datasets at multiple levels of cellular resolution, we infer 50-100% more enhancer-gene links than previous approaches and show that aggregate enhancer accessibility for highly regulated genes predicts expression. We use these gene-regulatory maps to prioritize cell types, genes and causal variants implicated in the pathobiology of androgenetic alopecia (AGA), eczema and other complex traits. AGA genome-wide association studies signals are enriched in dermal papilla regulatory regions, supporting the role of these cells as drivers of AGA pathogenesis. Finally, we train machine learning models to nominate single-nucleotide polymorphisms that affect gene expression through disruption of transcription factor binding, predicting candidate functional single-nucleotide polymorphism for AGA and eczema.


Conflict of interest statement

Declaration of Interests

W.J.G. is a consultant for 10x Genomics, Guardant Health, Quantapore, Erudio Bio., Lamar Health, Co-founder of Protillion Biosciences, and is named on patents describing ATAC-seq.

Figures

Extended Data Fig. 1 |
Extended Data Fig. 1 |. Quality control of single cell RNA and ATAC datasets. Related to Figure 1
(A) Scatter plots of the number of unique fragments by the transcription start site (TSS) enrichment for each of the scATAC-seq samples. Gray dots indicate cells that did not pass quality control filters (Methods). Colorbar indicates the density of points. (B) Violin plots of the number of unique reads (UMIs, top) and the percent of reads from mitochondrial genes (bottom) for each of the scRNA-seq samples.The inset box plot represent the median, 25th percentile and 75th percentile of the data, and whiskers represent the highest and lowest values within 1.5 times the interquartile range of the boxplot. (C) Violin plots of the TSS enrichment (top) and number of unique fragments (bottom) for each of the scATAC-seq samples. Box plot as in (B). (D) UMAP projection of full scRNA-seq dataset, colored by patient sample. (E) UMAP projection of full scATAC-seq dataset, colored by patient sample. (F) Differential scATAC-seq peaks between samples processed immediately after collection or after cryopreservation for each of the major cell groupings. Differential peaks (FDR < 0.1) are indicated by colored dots. (G) Differential scRNA-seq genes between samples processed immediately after collection or after cryopreservation for each of the major cell groupings. Differential genes (FDR < 0.1) are indicated by colored dots.
Extended Data Fig. 2 |
Extended Data Fig. 2 |. Annotation of single cell RNA and ATAC datasets. Related to Figure 1
(A) UMAP projections of full scRNA-seq dataset colored by relative expression levels of representative cell compartment marker genes. (B) UMAP projections of full scATAC-seq dataset colored by relative gene activity scores of the same marker genes shown in (A). (C) Marker peaks (Wilcoxon FDR ≤ 0.1 and Log2 fold change ≥ 0.5) for each scATAC cluster. (D) The fraction of each scRNA-seq cluster comprising each sample. The total proportions for each cluster are shown in the rightmost column. (E) The fraction of each scATAC-seq cluster comprising each sample. The total proportions for each cluster are shown in the rightmost column.
Extended Data Fig. 3 |
Extended Data Fig. 3 |. Sub-clustering of major cell groups and integration of scRNA and scATAC datasets. Related to Figures 1 and 2.
(A) UMAP representations of sub-clustered major cell groups using scATAC data. Cell compartments are labeled on the left, and cells are colored according to their high-resolution cluster labels. (B) UMAP representations of sub-clustered major cell groups using scRNA data. Cell compartments are labeled on the right, and cells are colored according to their high-resolution cluster labels. (C) scRNA gene expression for selected marker genes for each high-resolution scRNA-seq cluster from each sub-clustered cell group. The color indicates the relative expression across all high-resolution clusters and the size of the dot indicates the percentage of cells in that cluster that express the gene. (D) Correspondence between scRNA and scATAC-seq cluster labels for high-resolution clusters in each of the sub-clustered datasets. Heatmaps are colored according to the Jaccard index of cluster label overlap between the scRNA and scATAC-seq datasets. (E) Correspondence between scRNA and scATAC-seq cluster labels in the full scalp dataset.
Extended Data Fig. 4 |
Extended Data Fig. 4 |. Clustering and CCA-based scRNA to scATAC-seq integration robustness to subsampling. Related to Figure 2.
(A through C) Repeated dimensionality reduction and clustering of the scRNA and scATAC-seq datasets with three samples (AA4, C_SD3, and C_PB3) removed from the full dataset. (A) UMAP representations of the full subsampled dataset and sub-clustered major cell groups using scRNA data. Cell compartments are labeled on the left, and cells are colored according to their high-resolution cluster labels as shown in the x-axis in (C). (B) UMAP representations of the full dataset and sub-clustered major cell groups using scATAC data. Cell compartments are labeled on the left, and cells are colored according to their high-resolution cluster labels as shown in the y-axis in (C). (C) Correspondence between scRNA and scATAC-seq cluster labels for the low- and high-resolution clusters in each of the subsampled datasets. (D through F) Repeated dimensionality reduction and clustering of the scRNA and scATAC-seq datasets with 25% of the cells randomly removed from the full dataset. (D) Same as in (A), but for the cell-subsampled dataset. (E) Same as in (B), but for the cell-subsampled dataset. (F) Same as in (C), but for the cell-subsampled dataset.
Extended Data Fig. 5 |
Extended Data Fig. 5 |. Identification and characterization of peak-to-gene linkages. Related to Figure 2.
(A) Upset plot indicating the number of peak-to-gene linkages identified in the full dataset and in each of the sub-clustered datasets. (B) The distribution of the number of linked peaks per gene (median = 4). (C) The PhastCons 100-way vertebrate conservation scores for peaks with a linked gene in each dataset compared to unlinked peaks. Wilcoxon rank-sum test comparing each dataset to unlinked peaks, p < 2.2 × 10⁻¹⁶. Boxplots represent the median, 25th percentile and 75th percentile of the data, and whiskers represent the highest and lowest values within 1.5 times the interquartile range of the boxplot. (D) Bar plot showing the proportion of peak-to-gene linkages where both peak and gene were validated by a multi-tissue dataset of activity-by-contact (ABC) model enhancer-gene predictions. Categories compared included the space of all possible peak-to-gene links, the mean of 100 permutations drawn from all possible peak-to-gene links where for each permutation 146,088 peaks were selected to match the anchor distance distribution of true peak-to-gene links, and the set of true peak-to-gene links identified on each sub-clustered dataset. Hypergeometric enrichment tests comparing each subgroup of true peak-to-gene links to the mean distance-matched background set, p < 2.2 × 10⁻¹⁶. (E) Venn-diagram indicating the overlap of peak-to-gene linkages and peak-to-nearest-gene associations. (F) Comparison of the linked peak score (sum of accessibility at linked peaks) compared to the gene activity score for predicting gene expression for the 1739 HRGs. Plotted is the Pearson R2 from 246 pseudo-bulked samples per gene. Boxplots represent the median, 25th percentile and 75th percentile of the data, and whiskers represent the highest and lowest values within 1.5 times the interquartile range of the boxplot.
Extended Data Fig. 6 |
Extended Data Fig. 6 |. Marker genes and cell type–specific TF regulator activity for sub-clustered interfollicular and hair-follicle associated keratinocytes. Related to Figure 3.
(A) UMAP projections of sub-clustered keratinocyte scRNA-seq dataset colored by expression levels of representative marker genes. (B) UMAP projections of sub-clustered keratinocyte scATAC-seq dataset colored by gene activity scores of the same marker genes shown in (A). (C) Heatmap showing the chromatin accessibility (left) and gene expression (right) for 28,991 keratinocyte-specific peak-to-gene linkages. Peak-to-gene linkages were clustered using k-means clustering (k = 12). Rows indicate peak accessibility and gene expression on the left and right heatmaps respectively. Each column is a pseudo-bulk sample, with the colorbar on top of each heatmap indicating the cluster identity of each pseudo-bulk sample. (D) Hypergeometric enrichment p-values of TF motifs in peaks from each of the k-means clusters from (C). (E) Plot of TF motif activity correlation to corresponding TF gene expression across sub-clustered dataset against the maximum difference in chromVAR deviation z-score between clusters. TF’s with a maximum chromVAR difference in the top quartile and a pearson correlation greater than 0.5 are colored in red. (F) Prioritization of gene targets for LHX2. The x-axis shows the Pearson correlation between the TF motif activity and integrated gene expression for all expressed genes across all keratinocytes. The y-axis shows the TF Linkage Score (for all linked peaks, sum of motif score scaled by linkage correlation). Color of points indicates the hypergeometric enrichment of the TF motif in all linked peaks for each gene. Top gene targets are indicated in the shaded area (motif correlation to gene expression >0.25, linkage score >80th percentile). GO term enrichments for the top gene targets are shown in the inset bar plot. (G) Same as in (F), but for androgen receptor (AR). (H) Same as in (F), but for POU2F3.
Extended Data Fig. 7 |
Extended Data Fig. 7 |. Supplemental analyses of sub-clustered inferior segment hair follicle keratinocytes. Related to Figure 4.
(A) UMAP projection of sub-clustered keratinocytes showing cells originating from alopecia areata. Cells originating from control samples are colored gray and sorted to the back of the plot. (B) UMAP projection of sub-clustered scRNA inferior segment hair follicle keratinocytes. (C) UMAP projection of sub-clustered scATAC inferior segment hair follicle keratinocytes colored by matched nearest scRNA cluster. (D) Correspondence between scRNA and scATAC-seq cluster labels for integrated inferior segment hair follicle keratinocytes. (E) Paired heatmaps of positive TF regulators whose TF motif activity (left) and matched gene expression (right) are positively correlated across the hair follicle keratinocyte differentiation pseudotime trajectory. (F) GO term enrichments of the most variable 10% of genes across the hair follicle keratinocyte differentiation pseudotime trajectory.
Extended Data Fig. 8 |
Extended Data Fig. 8 |. Supplemental analyses of GWAS signal enrichment in cell type–specific open chromatin regions and cell type–specific genes. Related to Figure 5.
(A) Cluster-specificity of peaks used for LD score regression and for fisher enrichment tests in Figure 5. More than 50% of peaks are specific to <1/8 of high-resolution scATAC clusters, and 85% of peaks are specific to ≤ 1/4 of clusters. (B) Distribution of the number of clusters in which each peak is accessible. Peaks accessible in ≤ 1/4 of clusters (9 high-resolution clusters) were used for cluster-specific enrichment analyses. (C) Cluster-specificity of marker genes used for LD score regression and for fisher enrichment tests in (E) and (G) respectively. (D) Distribution of the number of clusters identified as expressing a given marker gene. Marker genes expressed in ≤ 1/4 of clusters (10 high-resolution clusters) were used for cluster-specific enrichment analyses. (E) LD score regression identifies enrichment of GWAS SNPs for various skin and non-skin related conditions in gene regions specific to sub-clustered cell types in human scalp. FDR-corrected P-values from LDSC enrichment tests are overlaid on the heatmap (*FDR < 0.05, **FDR < 0.005, ***FDR < 0.0005). (F) Fraction of fine-mapped SNPs for selected traits overlapping scalp cis-regulatory elements binned by fine-mapping posterior probability. (G) Fisher’s exact test enrichment of the nearest gene for fine-mapped trait-related SNPs in cell type–specific genes for sub-clustered cell types in human scalp. The FDR-corrected -log10 p-value is indicated by the color of the dots, and the dot size indicates the enrichment odds ratio.
Extended Data Fig. 9 |
Extended Data Fig. 9 |. Supplemental analyses of fmGWAS-linked genes. Related to Figure 5.
(A) GO term enrichment for the top genes linked to fine-mapped SNPs by summed fine-mapping posterior probability in associated peak-to-gene linkages. (B) The top genes linked to peaks containing fine-mapped SNPs for alopecia areata. The heatmap shows relative gene expression for each high-resolution scRNA cluster. The number of linked fmSNPs per gene is indicated in the red bar plot to the right, and the total sum of fine-mapped posterior probability for linked SNPs is indicated in the blue bar plot. The grey bar plot shows the total number of identified peak-to-gene linkages for that gene in the entire scalp dataset. Gene names colored red indicate fine-mapped SNP to gene linkages supported by GTEx eQTLs. (C) Same as in (B), but for hair color.
Extended Data Fig. 10 |
Extended Data Fig. 10 |. Assessment of gkmSVM model performance and additional high-effect candidate fine-mapped SNPs. Related to Figure 6.
(A) The area under the receiver operator (AUROC), or (B) precision recall (AUPRC) curves for the gkm-SVM machine learning classifiers for each of the cluster models. Boxplots represent the median, 25th percentile and 75th percentile of the data, and whiskers represent the highest and lowest values within 1.5 times the interquartile range of the boxplot. (C) The overlap of training data (peak sequences) between models. (D) The performance of each cluster model on predicting test sequences from a non-target cluster. (E) Enrichment of high-effect fine-mapped SNPs from eczema relative to random fine-mapped SNPs in cis-regulatory regions. (F) Same as in (E), but for androgenetic alopecia. (G) Normalized chromatin accessibility landscape for cell type–specific pseudo bulk tracks around the BNC2 locus. Integrated BNC2 expression levels are shown in the violin plot for each cell type to the right. The position of ATAC-seq peaks, the GWAS lead SNP, the fine-mapped SNP candidates in LD with the lead SNP, and the candidate functional SNP are shown below the ATAC-seq tracks. Significant peak-to-gene linkages are indicated by loops connecting the BNC2 promoter to indicated peaks. (H) GkmExplain importance scores for the 50bp region surrounding rs12350739, a hair color associated SNP that creates a JUN motif in a cis-regulatory element linked to BNC2 expression. (I) Same as in (G), but for the ALX4 locus. (J) GkmExplain importance scores for the 50bp region surrounding rs10769041, an androgenetic alopecia associated SNP that disrupts an ETS motif in a cis-regulatory element linked to ALX4 expression.
Figure 1 |
Figure 1 |. Multi-omic single-cell atlas of primary human scalp
(A) Samples and profiling methods used in this study. (B) Schematic representation of the cellular diversity within human scalp. (C, D) UMAP representation of all scRNA-seq (C) and scATAC-seq (D) cells passing quality control, colored by annotated clusters. Broad cell types are labeled on the UMAP and higher resolution labels are shown in (E-F). (E) scRNA gene expression for selected marker genes for each scRNA-seq cluster. The color indicates the relative expression across all clusters and the size of the dot indicates the percentage of cells in that cluster that express the gene. (F) scATAC gene activity scores for the same markers shown in (E). (G) Hypergeometric enrichment of transcription factor motifs in marker peaks for each scATAC-seq cluster. (H) The fraction of each sample comprising each scRNA-seq cluster. Samples from control punch biopsies are shown in shades of green, surgical dogears in shades of blue, and patients with alopecia areata shown in red. The total proportions for each sample are shown in the rightmost column. (I) Same as (H), but for the scATAC-seq clusters.
Figure 2 |
Figure 2 |. Gene regulatory dynamics and modularity in human scalp
(A) Peak-to-gene linkages were identified on the integrated scATAC and scRNA full scalp dataset, and on each of the five major cell type sub-clustered datasets. Peak-to-gene linkages identified in each dataset are merged to form the full set of peak-to-gene linkages. (B) Genomic tracks for accessibility around RUNX3 for different cell types. Integrated RUNX3 expression levels are shown in the violin plot for each cell type to the right. Loops shown below the top panel indicate peak-to-gene linkages identified on the full integrated dataset. Lower panel shows the genomic tracks for accessibility around RUNX3 for sub-clustered keratinocytes. Loops shown below these tracks indicate peak-to-gene linkages identified on the sub-clustered dataset. The gray vertical bars spanning both panels highlight select peaks linked to RUNX3 expression identified in the sub-clustered keratinocytes that were not identified using the full integrated dataset. (C) Genes ranked by the number of peak-to-gene links identified for each gene. 1739 ‘highly regulated genes’ (HRGs) had > 20 peak-to-gene linkages. (D) Hypergeometric enrichment of super-enhancer linked genes in human scalp HRGs for each cell and tissue type profiled in Hnisz et al. 2013. Red dots represent enrichment of the human homolog of mouse hair-follicle super-enhancer linked genes identified in Adam et al. 2015. (E) Heatmap showing the chromatin accessibility (left) and gene expression (right) for the 146,088 peak-to-gene linkages. Peak-to-gene linkages were clustered using k-means clustering (k = 25). Sample top HRGs for select clusters are shown to the right of the gene expression heatmap. GO term enrichments for the top 200 genes ranked by number of peak-to-gene linkages are shown to the right for select k-means clusters. (F) Heatmap showing chromatin accessibility at RUNX3-linked peaks for 246 pseudo-bulked scATAC-seq samples. Cell type labels are shown in the bar above the heatmap, and RUNX3 expression levels for each pseudo-bulk are shown below. Scatter plot to the right shows the relationship between linked peak accessibility and resulting gene expression for each of the pseudo-bulked samples shown in the heatmap to the left. (G) Same as in (F), but for RUNX1. (H) Same as in (F), but for HLA-DRB1. (I) Same as in (F), but for AQP3.
Figure 3 |
Figure 3 |. Scalp keratinocyte diversity and regulatory control of interfollicular keratinocyte differentiation.
(A) UMAP representation of subclustered keratinocytes in the scATAC-seq dataset (B) Integrated gene expression for select markers across keratinocyte subtypes. The color indicates the relative expression across all clusters and the size of the dot indicates the percentage of cells in that cluster that express the gene. (C) ChromVAR deviation z-scores showing transcription factor motif activity for select transcription factors. (D) Slingshot differentiation trajectory starting with basal interfollicular keratinocytes and progressing to upper layer spinous keratinocytes. (E) Heatmap of 10% most variable peaks (n = 31,333) and 10% most variable genes (n = 2,127) along the trajectory from basal to spinous keratinocytes. (F) Genomic tracks of accessibility around the ITGB1 promoter. Tracks are pseudo-bulked samples ordered along the interfollicular differentiation trajectory. Integrated ITGB1 expression levels are shown in the violin plot for each pseudo-bulk to the right. (G) Same as in (F), but for the KRT10 promoter. (H) Paired heatmaps of positive TF regulators whose TF motif activity (left) and matched gene expression (right) are positively correlated across the interfollicular keratinocyte differentiation pseudotime trajectory. (I) Prioritization of gene targets for TP63. The x-axis shows the Pearson correlation between the TF motif activity and integrated gene expression for all expressed genes across all keratinocytes. The y-axis shows the TF Linkage Score (for all linked peaks, sum of motif score scaled by peak-to-gene link correlation). Color of points indicates the hypergeometric enrichment of the TF motif in all linked peaks for each gene. Top gene targets are indicated in the shaded area (motif correlation to gene expression >0.25, linkage score >80th percentile). GO term enrichments for the top gene targets are shown in the inset bar plot. (J) Same as in (I), but for FOSL1. (K) Same as in (I), but for KLF4.
Figure 4 |
Figure 4 |. Regulatory dynamics of human hair follicle cycling
(A) Sub-clustered keratinocytes in scATAC-seq space. The inferior segment of the hair follicle is highlighted. (B) Differential abundance of cycling HF keratinocytes between alopecia areata and control samples using Milo. Colored spots represent neighborhoods that are differentially abundant with a SpatialFDR < 0.1 (C) Sub-clustered HF keratinocytes from the inferior segment of the hair follicle. (D) Selected marker gene expression and TF motif activity deviation z-scores for sub-clustered inferior segment HF keratinocytes. (E) Same as in B, except for sub-clustered cycling HF keratinocytes. Hair sheath cells are differentially depleted relative to HFSCs. (F) Differentiation trajectory from HFSCs to Matrix cells. (G) Heatmap of variable expression of members of the WNT signaling pathway during HF cycling.
Figure 5 |
Figure 5 |. Identification of cell types and genes associated with hair, skin, and autoimmune diseases
(A) LD score regression identifies enrichment of GWAS SNPs for various skin and non-skin related conditions in peak regions specific to sub-clustered cell types in human scalp. FDR-corrected P-values from LDSC enrichment tests are overlaid on the heatmap (*FDR < 0.05, **FDR < 0.005, ***FDR < 0.0005). (B) Fraction of fine-mapped SNPs overlapping scalp open chromatin regions binned by increasing fine-mapping posterior probability. Color of boxplot indicates the group of traits being plotted. Boxplots represent the median, 25th percentile and 75th percentile of the data, and whiskers represent the highest and lowest values within 1.5 times the interquartile range of the boxplot. (C) Fisher’s exact test enrichment for fine-mapped trait-related SNPs in peak regions specific to sub-clustered cell types in human scalp. The FDR-corrected -log10 p-value is indicated by the color of the dots, and the dot size indicates the enrichment odds ratio. Traits are grouped as in (B). (D) The top genes linked to peaks containing fine-mapped SNPs for eczema. The heatmap shows relative gene expression for each high-resolution scRNA cluster. The number of linked fmSNPs per gene is indicated in the red bar plot to the right, and the total sum of fine-mapped posterior probability for linked SNPs is indicated in the blue bar plot. The gray bar plot shows the total number of identified peak-to-gene linkages for that gene in the entire scalp dataset. Gene names colored red indicate fine-mapped SNP to gene linkages supported by GTEx eQTLs. (E) Same as in (D), but for androgenetic alopecia.
Figure 6 |
Figure 6 |. Candidate causal variants in skin and hair disease
(A) Schematic of strategy for identification of potential causative variants. (B) Enrichment of high-effect fine-mapped SNPs from select skin and hair traits relative to random fine-mapped SNPs in cis-regulatory regions. (C) Normalized chromatin accessibility landscape for cell type–specific pseudo bulk tracks around the IL18RAP locus. Integrated IL18RAP expression levels are shown in the violin plot for each cell type to the right. The position of ATAC-seq peaks, the GWAS lead SNP, the fine-mapped SNP candidates in LD with the lead SNP, and the candidate functional SNP are shown below the ATAC-seq tracks. Significant peak-to-gene linkages are indicated by loops connecting the IL18RAP promoter to indicated peaks. (D) GkmExplain importance scores for the 50bp region surrounding rs2058622, an eczema associated SNP that disrupts a RUNX motif in a cis-regulatory element linked to IL18RAP expression. The effect and non-effect alleles for the gkm-SVM model correspond to the model trained on the CD4 helper T-cell cluster. (E) LocusZoom plot of the region shown in (C), highlighting the strong LD and high overall GWAS signal of this locus. (F) Same as in (C), but for the WNT10A locus. (G) GkmExplain importance scores for the 50bp region surrounding rs72966077, an androgenetic alopecia associated SNP that disrupts a ERG motif in a cis-regulatory element linked to WNT10A expression. The effect and non-effect alleles for the gkm-SVM model correspond to the model trained on the Infundibular keratinocytes cluster. (H) UMAP projection of the high-resolution keratinocyte subclustering showing expression of WNT10A, EGR2, and EGR2 ChromVAR motif activity.

Comment in

References

    1. Paus R & Cotsarelis G The biology of hair follicles. N. Engl. J. Med. 341, 491–497 (1999). - PubMed
    1. Woo W-M & Oro AE SnapShot: hair follicle stem cells. Cell 146, 334–334.e2 (2011). - PMC - PubMed
    1. Schneider MR, Schmidt-Ullrich R & Paus R The hair follicle as a dynamic miniorgan. Curr. Biol. 19, R132–42 (2009). - PubMed
    1. Hsu Y-C & Fuchs E Building and Maintaining the Skin. Cold Spring Harb. Perspect. Biol. 14, (2022). - PMC - PubMed
    1. Petukhova L et al. Genome-wide association study in alopecia areata implicates both innate and adaptive immunity. Nature 466, 113–117 (2010). - PMC - PubMed

Publication types