. 2023 Aug;55(8):1301-1310.
doi: 10.1038/s41588-023-01446-3. Epub 2023 Jul 27.

Single-molecule genome-wide mutation profiles of cell-free DNA for non-invasive detection of cancer

Affiliations

Single-molecule genome-wide mutation profiles of cell-free DNA for non-invasive detection of cancer

Daniel C Bruhm et al. Nat Genet. 2023 Aug.

Abstract

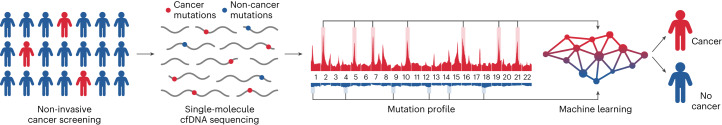
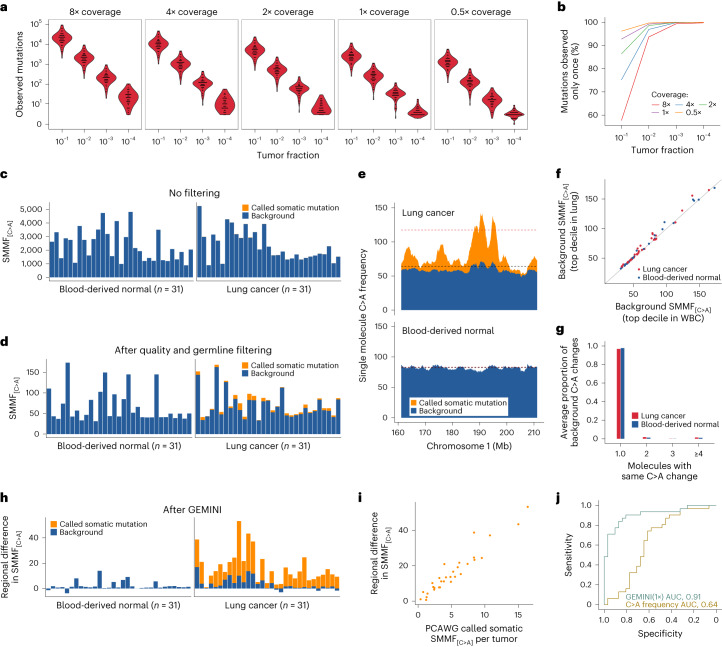
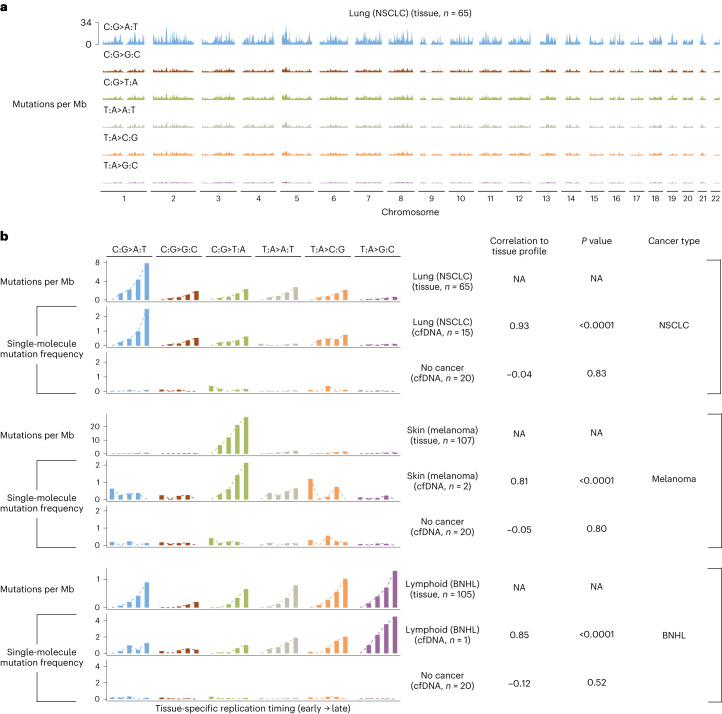
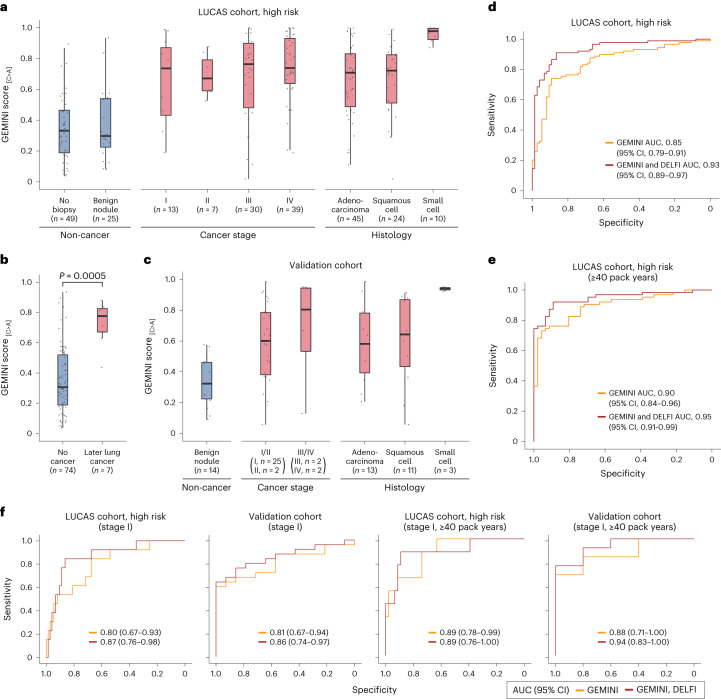
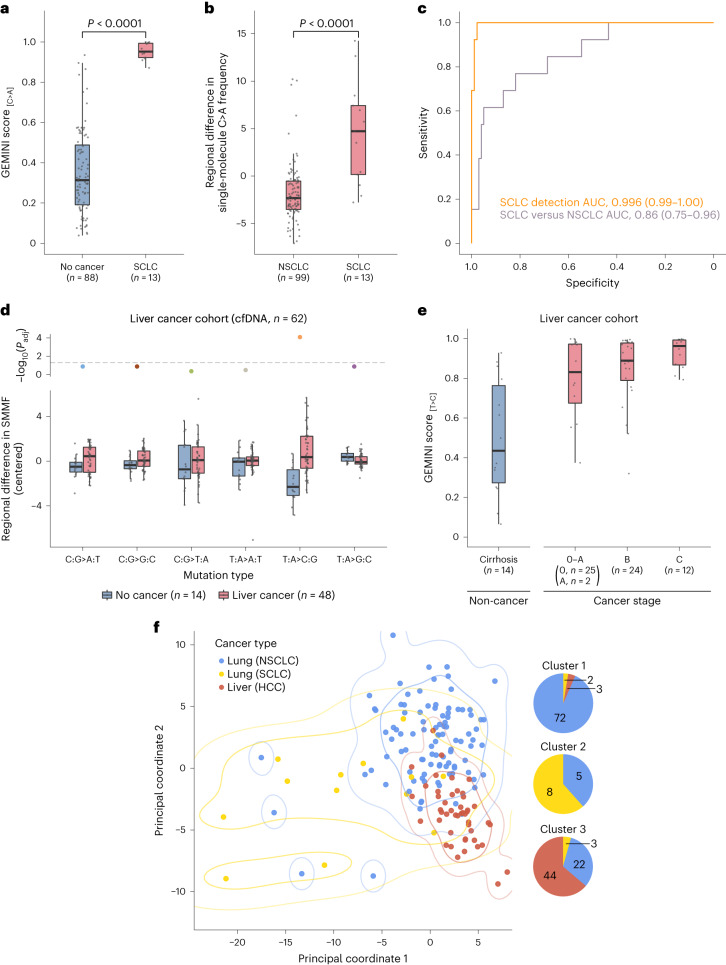
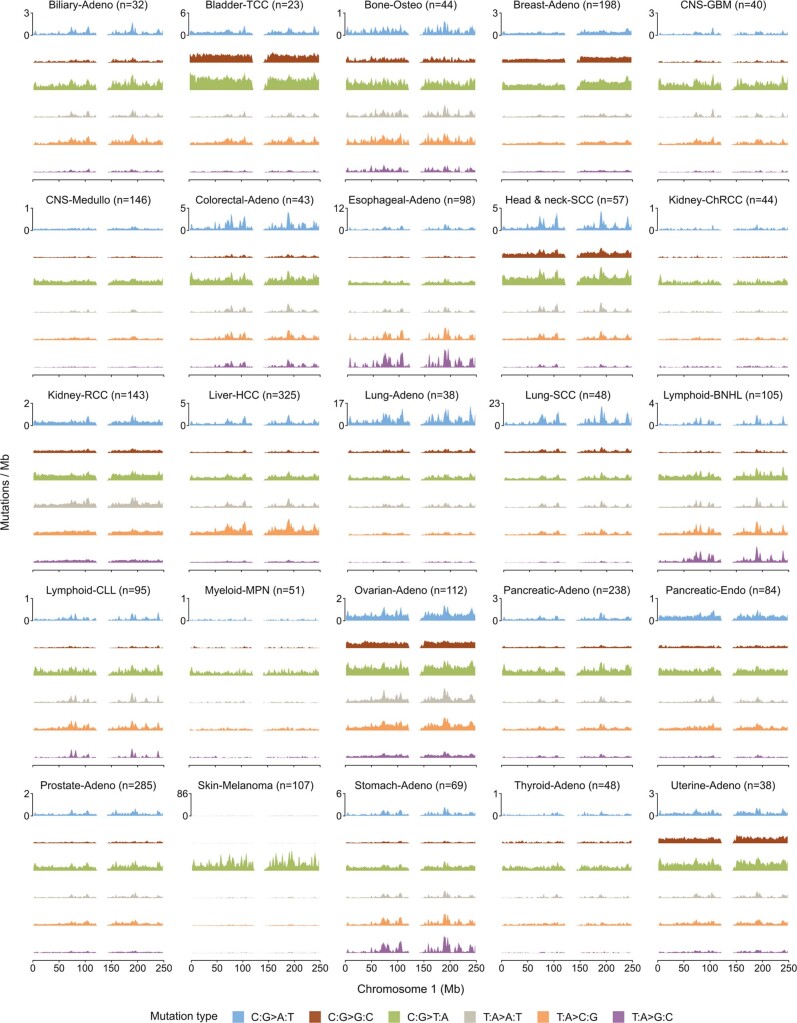
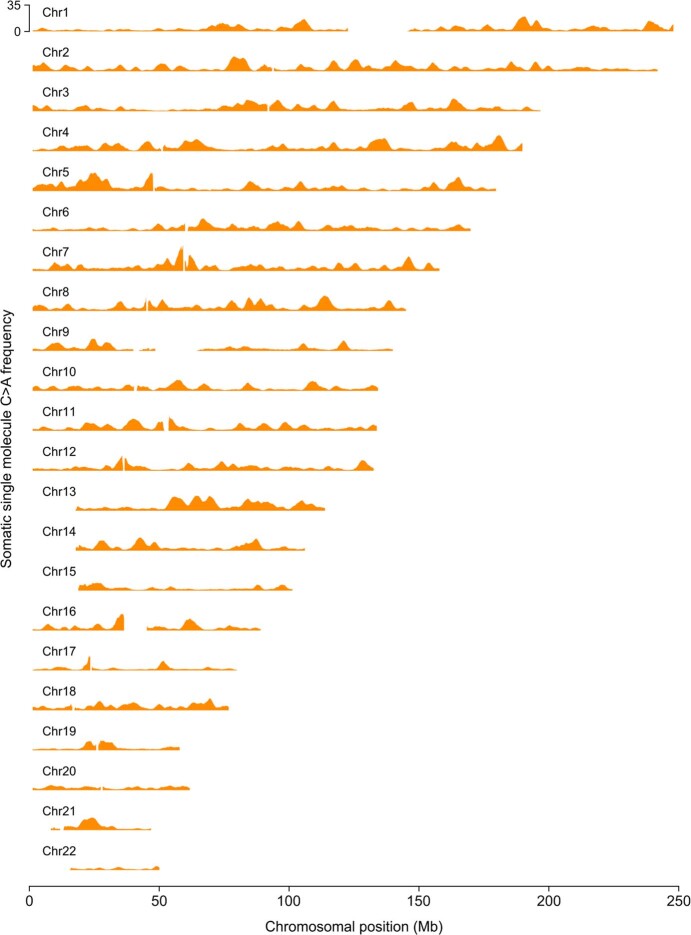
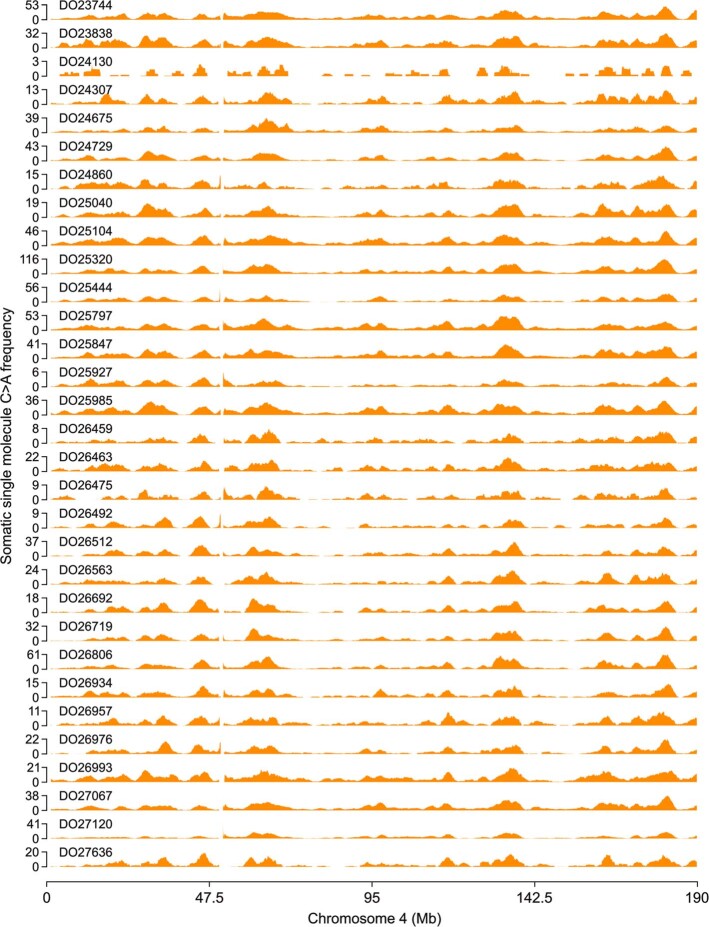
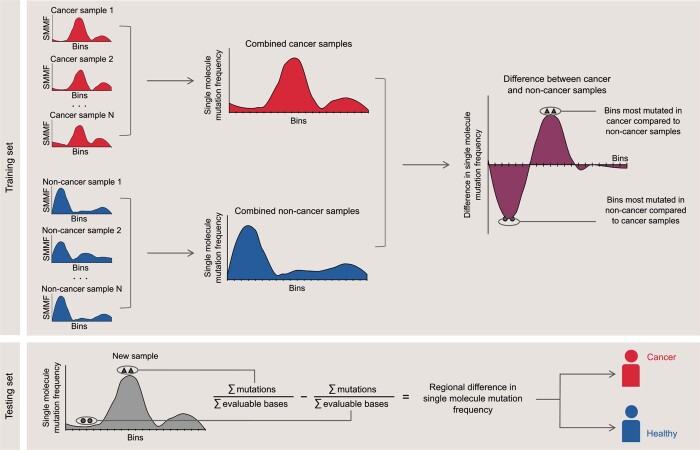
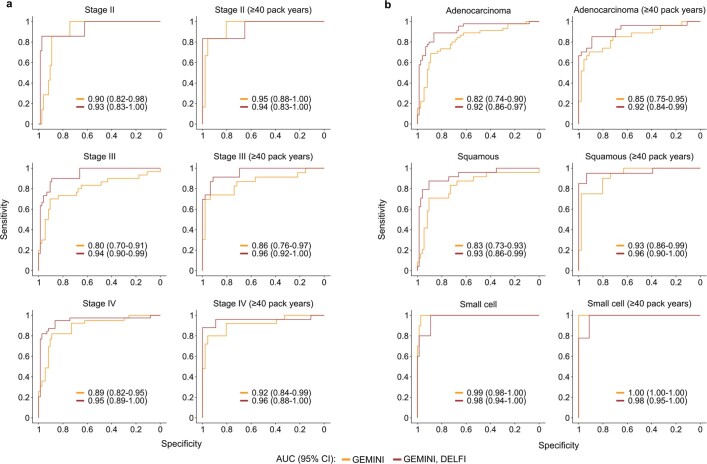
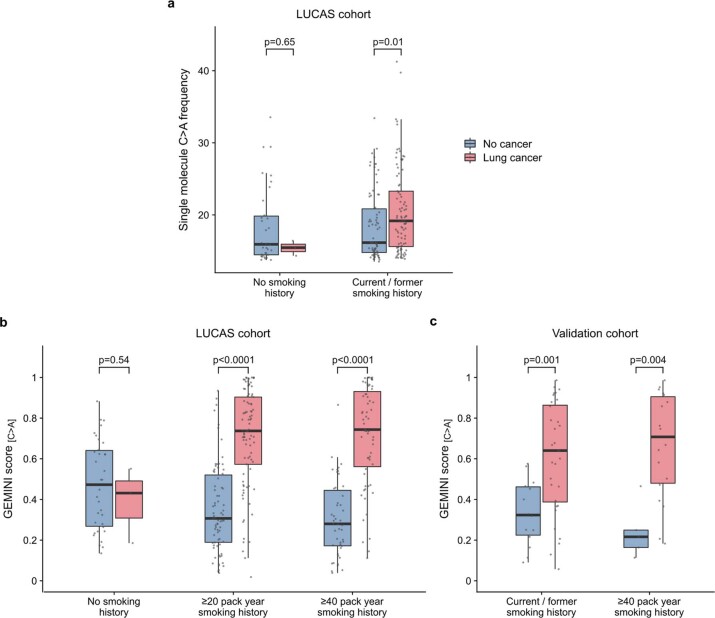
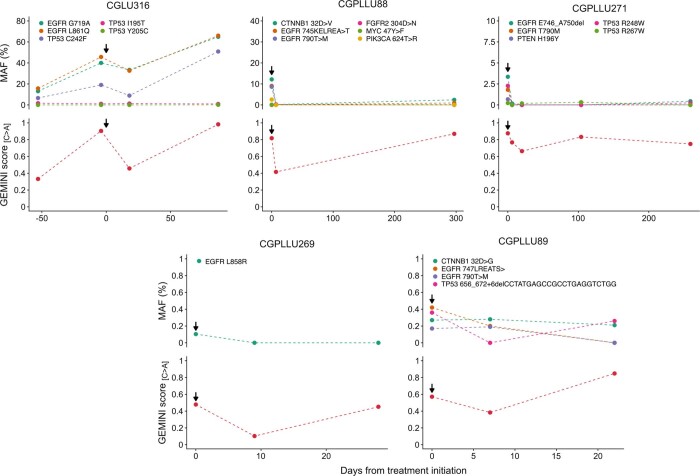
Somatic mutations are a hallmark of tumorigenesis and may be useful for non-invasive diagnosis of cancer. We analyzed whole-genome sequencing data from 2,511 individuals in the Pan-Cancer Analysis of Whole Genomes (PCAWG) study as well as 489 individuals from four prospective cohorts and found distinct regional mutation type-specific frequencies in tissue and cell-free DNA from patients with cancer that were associated with replication timing and other chromatin features. A machine-learning model using genome-wide mutational profiles combined with other features and followed by CT imaging detected >90% of patients with lung cancer, including those with stage I and II disease. The fixed model was validated in an independent cohort, detected patients with cancer earlier than standard approaches and could be used to monitor response to therapy. This approach lays the groundwork for non-invasive cancer detection using genome-wide mutation features that may facilitate cancer screening and monitoring.


Conflict of interest statement

D.C.B., D.M., S.C., V. Adleff, J.P., V. Anagnostou, R.B.S. and V.E.V. are inventors on patent applications submitted by Johns Hopkins University related to cfDNA for cancer detection. S.C., J.P., V. Adleff. and R.B.S. are founders of Delfi Diagnostics, and V. Adleff. and R.B.S. are consultants for this organization. J.R.W. is the founder and owner of Resphera Biosciences. V.E.V. is a founder of Delfi Diagnostics, serves on the Board of Directors and as an officer for this organization and owns Delfi Diagnostics stock, which is subject to certain restrictions under university policy. Additionally, Johns Hopkins University owns equity in Delfi Diagnostics. V.E.V. divested his equity in Personal Genome Diagnostics (PGDx) to LabCorp in February 2022. V.E.V. is an inventor on patent applications submitted by Johns Hopkins University related to cancer genomic analyses and cfDNA for cancer detection that have been licensed to one or more entities, including Delfi Diagnostics, LabCorp, Qiagen, Sysmex, Agios, Genzyme, Esoterix, Ventana and ManaT Bio. Under the terms of these license agreements, the University and inventors are entitled to fees and royalty distributions. V.E.V. is an advisor to Viron Therapeutics and Epitope. These arrangements have been reviewed and approved by Johns Hopkins University in accordance with its conflict-of-interest policies. The remaining authors declare no competing interests.

Figures

Fig. 1
Fig. 1. Schematic of overall approach for cancer detection using single-molecule cfDNA sequencing.
Blood is collected from a population of individuals, some of whom have cancer. Then, cfDNA is extracted from plasma and subjected to single-molecule sequencing using massively parallel sequencing approaches. Sequence alterations are used to obtain genome‐wide mutation profiles, and regional differences in cancer and non-cancer mutation frequencies are identified using machine learning to distinguish individuals with and without cancer.
Fig. 2
Fig. 2. Single-molecule mutation analyses of PCAWG lung cancers and normal samples.
a, Number of mutations detected in lung cancer samples from individuals who smoke, across sequencing coverage amounts and tumor fractions. b, Fraction of lung cancer mutations observed in single DNA molecules at the different coverage and tumor fractions indicated. c,d, Single-molecule mutation frequency (SMMF) for somatic and background C>A changes in lung cancer and blood-derived matched normal samples without quality or germline filters (c) or with these filters including filtering of 8-oxo-dG-related sequence changes (d). e, Frequency of single-molecule somatic and background C>A changes computed in a sliding 2.5 Mb window with a step size of 100 kb across a 50 Mb region of chromosome 1 in lung cancer and blood-derived normal samples from individual DO25320. Red and black dashed lines represent mutation frequencies of the top decile of bins most enriched in C>A changes in lung cancers and matched blood-derived normal samples. f, Background C>A frequency of the top decile of bins most enriched in C>A changes in lung cancer and matched white blood cell (WBC) samples obtained after removal of known somatic mutations. For each sample, background C>A frequencies are similar between these regions as can be seen with the solid identity line. g, Number of molecules with each background C>A change in lung cancer and blood-derived normal samples. Most background changes are observed only once. h, Regional C>A frequencies in normal or tumor samples after subtraction of the C>A frequency in the top decile of bins enriched in normal samples from the top decile of bins enriched in mutations in tumor samples. i, Regional differences in single-molecule C>A frequencies were positively correlated with the frequency of high-confidence somatic C>A mutations reported in these samples by the PCAWG Consortium (Spearman’s rho, 0.96; P < 0.0001, two-sided). j, Receiver operator characteristic curve for distinguishing lung cancer from normal samples using GEMINI with the testing set down-sampled to 1× coverage compared to using overall single-molecule C>A frequencies after quality and germline filtering. The GEMINI approach without filtering 8-oxo-dG-related changes results in an AUC of 0.47, highlighting the importance of removing these artefacts.
Fig. 3
Fig. 3. Genome-wide mutation profiles of tissue and plasma samples are associated with replication timing.
a, Somatic mutation frequencies in PCAWG lung cancers of individuals who smoke (n = 65) were computed in sliding 2.5 Mb windows with a step size of 100 kb across the genome and are represented as the average across individuals. b, Association of mutation frequencies across tissue-specific replication timing strata in PCAWG tissue samples and cfDNA from patients in the LUCAS cohort with NSCLC, melanoma, B cell non-Hodgkin lymphoma (BNHL) or no cancer. Replication timing was obtained as the wavelet‐smoothed transform of the six fraction profile, representing different time points during replication in 1 kb bins from IMR90, NHEK and GM12878 cell lines for analyses of NSCLC, melanoma and BNHL, respectively. The weighted average of the replication timing values was computed in 2.5 Mb bins, followed by grouping of bins into five equal bin sets containing bins with the earliest to latest replication timing. In each bin set, we computed the mutation frequency in tissue at different replication strata using the number of somatic mutations reported by the PCAWG Consortium per Mb of genome and compared this to the single-molecule mutation frequency in plasma using a two-sided Pearson’s correlation. To control for potential systematic variability in measured genome-wide mutational frequencies, we subtracted from both cancer and non-cancer cfDNA samples the single-molecule mutation frequency in each bin set in a separate panel of 20 non-cancer cfDNA samples. Mutation frequencies were then scaled within each sample and mutation type to have a minimum value of zero. NA, not applicable.
Fig. 4
Fig. 4. Detection of lung cancer using GEMINI and a combined GEMINI–DELFI approach.
a, Cross-validated GEMINI scores in the LUCAS cohort of high‐risk individuals (aged 50–80 years with a ≥20 pack-year smoking history with or without lung cancer), with the number of individuals indicated at each stage or histology. b, GEMINI scores of high‐risk individuals without lung cancer as well as individuals without lung cancer as determined by imaging at baseline but who later developed lung cancer. The difference between groups was evaluated using a two-sided Wilcoxon rank sum test. c, The fixed GEMINI model from the LUCAS cohort was used to evaluate individuals in a validation cohort of current or former smokers aged 50–80 years with and without cancer. d, Receiver operator characteristic (ROC) curve for detection of lung cancer in high‐risk individuals in the LUCAS cohort (n = 89 with lung cancer, n = 74 without cancer). e, ROC curve for detection of lung cancer in a subset of high‐risk individuals in the LUCAS cohort with at least 40 pack years (n = 63 with lung cancer, n = 46 without cancer) shows that the performance of GEMINI is better with higher smoking history. f, ROC curve for detection of high‐risk individuals from the LUCAS cohort who were diagnosed with stage I lung cancer (n = 13 with lung cancer, n = 74 without cancer) (left panel), stage I lung cancer among individuals in the validation cohort (n = 25 with lung cancer, n = 14 without cancer) (middle-left panel), high‐risk individuals from the LUCAS cohort with a ≥40 pack-year smoking history who were diagnosed with stage I lung cancer (n = 9 with lung cancer, n = 46 without cancer) (middle-right panel) and stage I lung cancer among individuals with a ≥40 pack-year smoking history in the validation cohort (n = 13 with lung cancer, n = 5 without cancer) (right panel). All boxplots represent the interquartile range, with whiskers drawn to the highest value within the upper and lower fences (upper fence, 0.75 quantile + 1.5× interquartile range; lower fence, 0.25 quantile – 1.5× interquartile range). The solid middle line in the boxplot represents the median value.
Fig. 5
Fig. 5. GEMINI approach for non-invasive detection across multiple cancer types.
a, GEMINI scores in patients with SCLC and high‐risk individuals without cancer in the LUCAS and validation cohorts show high performance for detecting cancer (two-sided Wilcoxon rank sum test, P < 0.0001). b, Regional differences in single-molecule C>A frequency in the LUCAS and validation cohorts demonstrate that GEMINI can be used to identify the bins that are most altered between SCLC and NSCLC (two-sided Wilcoxon rank sum test, P < 0.0001). c, ROC curves for the detection of SCLC (n = 13) compared to non‐cancer controls (n = 88) (orange) as well as for distinguishing SCLC (n = 13) from NSCLC (n = 99) (purple) in the combined LUCAS and validation cohorts. d, Cross-validated regional differences in SMMFs in cfDNA in the liver cancer cohort, median-centered within each mutation type, show a high level of T>C mutations in patients with HCC. Adjusted P values (Padj) were generated using the two-sided Wilcoxon rank sum test and were corrected for multiple comparisons using the Benjamini–Hochberg method. The horizontal dashed line indicates a P value of 0.05. e, GEMINI scores in the liver cancer cohort with the number of individuals indicated at each stage demonstrate high sensitivity for detection of liver cancer across all stages. f, Principal coordinate analysis of the Euclidean distance matrix reflecting cross-validated pairwise differences in regional mutation frequencies between NSCLC, SCLC and HCC. The first two principal coordinates are shown with contours indicating kernel density estimations for 0.7 and 0.95 probability for each cancer type. The composition of cancer types in clusters derived from K-means clustering with k = 3 is indicated to the right. All boxplots represent the interquartile range, with whiskers drawn to the highest value within the upper and lower fences (upper fence, 0.75 quantile + 1.5× interquartile range; lower fence, 0.25 quantile – 1.5× interquartile range). The solid middle line in the boxplot corresponds to the median value.
Extended Data Fig. 1
Extended Data Fig. 1. Genomic mutation profiles in common cancers.
Average somatic mutation frequencies computed in sliding 2.5 megabase (Mb) windows with a step size of 100 kb across chromosome 1 obtained from an analysis of 2,511 PCAWG samples across 25 common cancer types. Adeno, adenocarcinoma; TCC, transitional cell carcinoma; Osteo, osteosarcoma; CNS, central nervous system; GBM, glioblastoma multiforme; Medullo, medulloblastoma; SCC, squamous cell carcinoma; ChRCC, chromophobe renal cell carcinoma; RCC, renal cell carcinoma; HCC, hepatocellular carcinoma; BNHL, B cell non-Hodgkin lymphoma; CLL, chronic lymphoid leukemia; MPN, myeloproliferative neoplasm; Endo, endocrine.
Extended Data Fig. 2
Extended Data Fig. 2. Analyses of single molecule sequence changes in PCAWG lung cancer and normal samples.
a, Single molecule mutation frequencies in Pan-Cancer Analysis of Whole Genomes (PCAWG) lung cancers (n = 31) and blood derived matched normal samples (n = 31). Adjusted p-values (padj) were generated using the two-sided Wilcoxon rank sum test and were corrected for multiple comparisons using the Benjamini-Hochberg method. The horizontal dashed line indicates a p-value of 0.05. b, Cross-validated regional differences in single molecule mutation frequencies in PCAWG lung cancers (n = 31) and blood derived matched normal samples (n = 31), median-centered within each mutation type. Adjusted p-values were generated using the two-sided Wilcoxon rank sum test and were corrected for multiple comparisons using the Benjamini-Hochberg method. The horizontal dashed line indicates a p-value of 0.05. All boxplots represent the interquartile range with whiskers drawn to the highest value within the upper and lower fences (upper fence = 0.75 quantile + 1.5 × interquartile range; lower fence = 0.25 quantile – 1.5 × interquartile range). The solid middle line in the boxplot corresponds to the median value.
Extended Data Fig. 3
Extended Data Fig. 3. Genome‐wide somatic single molecule C > A mutation profiles in lung cancers.
Single molecule C > A somatic mutation frequencies computed in sliding 2.5 megabase (Mb) windows with a step size of 100 kb across the autosomes obtained from an aggregated analysis of the 31 PCAWG lung cancer samples showed widespread differences in mutation frequencies depending on genomic location. Chr, Chromosome.
Extended Data Fig. 4
Extended Data Fig. 4. Somatic single molecule C > A mutation profiles across chromosome 4 in PCAWG lung cancers.
Single molecule C > A somatic mutation frequencies computed in a sliding 2.5 megabase (Mb) window with a step size of 100 kb across chromosome 4 from PCAWG lung cancer samples (n = 31) revealed similar mutation profiles among different lung cancers. Patient IDs (for example DO23744) are indicated for each sample.
Extended Data Fig. 5
Extended Data Fig. 5. Schematic of GEMINI regional mutation frequency analysis.
The genome is divided into 1,144 non-overlapping 2.5 Mb bins (20 bins are depicted here) and the single molecule mutation frequency (SMMF) is computed in each bin as the number of sequence changes per million evaluable bases, defined as the number of positions in fragments in which each sequence change could be detected after quality and germline filtering. Samples in the training set are used to identify the bins that are most differentially mutated between cancer and non-cancer samples. In the training set, sequence data from all cancer samples and all non-cancer samples are combined, and the cancer and non-cancer single molecule mutation frequencies are computed in each bin. Next, the difference in single molecule mutation frequency is computed between cancer and non-cancer samples in each bin, and the 10% of bins most mutated in cancer samples relative to non-cancer samples, as well as the 10% of bins most mutated in non-cancer samples relative to cancer samples, are identified (indicated by triangles and circles respectively). In the testing set, the difference in single molecule mutation frequency is computed between these two sets of bins in a new sample not included in the training set, generating a regional difference in mutation frequency that can be used to classify the sample into being derived from a healthy individual or an individual with cancer. By taking the difference in single molecule mutation frequency between two sets of regions in the genome within an individual sample, this approach controls for the overall number of sequence changes in that sample that may result from technical variability in sequencing runs.
Extended Data Fig. 6
Extended Data Fig. 6. Regional differences in single molecule mutation frequencies in the high-risk LUCAS cohort.
Cross-validated regional differences in single molecule mutation frequencies in cell-free DNA (cfDNA) in individuals with lung cancer (n = 89) and individuals without cancer (n = 74), median-centered within each mutation type. Regional C > A mutation frequencies were preferentially altered between lung cancer and non-cancer samples, but not when randomly permuting class labels (p = 0.36, Wilcoxon rank sum test, two-sided). Adjusted p-values (padj) were generated using the two-sided Wilcoxon rank sum test and were corrected for multiple comparisons using the Benjamini-Hochberg method. The horizontal dashed line indicates a p-value of 0.05. All boxplots represent the interquartile range with whiskers drawn to the highest value within the upper and lower fences (upper fence = 0.75 quantile + 1.5 × interquartile range; lower fence = 0.25 quantile – 1.5 × interquartile range). The solid middle line in the boxplot corresponds to the median value.
Extended Data Fig. 7
Extended Data Fig. 7. Performance of GEMINI or the combined GEMINI / DELFI approach for detection of lung cancer.
a, ROC curves for detection of lung cancer in the high-risk LUCAS cohort using GEMINI or the combined GEMINI / DELFI approach in patients with stages II-IV disease and in the subset of these patients that smoked ≥40 pack years. b, ROC curves for detection of lung cancer in the high-risk LUCAS cohort using GEMINI or the combined GEMINI / DELFI approach in patients with adenocarcinoma, squamous cell carcinoma, or small cell lung cancer and in the subset of these patients that smoked ≥40 pack years. Performance for Stage I disease is shown in Fig. 4f. AUC, area under the curve; CI, confidence interval.
Extended Data Fig. 8
Extended Data Fig. 8. GEMINI / DELFI score and clinical outcome in lung cancer patients.
Patients with lung cancer in the high-risk LUCAS cohort (n = 89) were stratified in two groups based on the median GEMINI / DELFI score among lung cancer patients of 0.84. Patients with a GEMINI / DELFI score ≥0.84 (yellow) had a significantly worse overall survival compared to patients with a GEMINI / DELFI score < 0.84 (blue) (p = 0.004, Log-rank test).
Extended Data Fig. 9
Extended Data Fig. 9. GEMINI scores and smoking exposure in lung cancer patients.
a, Single molecule C > A frequencies were similar in never smokers with lung cancer (n = 3) or without lung cancer (n = 34) in the LUCAS cohort. In current or former smokers in the high-risk group, with a ≥20 pack year smoking history and age 50–80, the single molecule C > A frequencies were slightly higher in individuals with lung cancer (n = 89) compared to individuals without lung cancer (n = 74). b, GEMINI scores were similar in never smokers with lung cancer (n = 3) or without lung cancer (n = 34). In the high-risk group, GEMINI scores were higher in individuals with lung cancer (n = 89) compared to those without lung cancer (n = 74). Similarly, for individuals with a ≥40 pack year smoking history and age 50–80, the GEMINI scores were higher in those with lung cancer (n = 63) compared to those without lung cancer (n = 46). c, GEMINI scores were higher in individuals with lung cancer in the validation cohort in current/former smokers age 50–80 with (n = 32) and without lung cancer (n = 14) and in the subset with a ≥40 pack year smoking history with (n = 18) and without lung cancer (n = 5). P-values in a-c were obtained from two-sided Wilcoxon rank sum tests. All boxplots represent the interquartile range with whiskers drawn to the highest value within the upper and lower fences (upper fence = 0.75 quantile + 1.5 × interquartile range; lower fence = 0.25 quantile – 1.5 × interquartile range). The solid middle line in the boxplot corresponds to the median value.
Extended Data Fig. 10
Extended Data Fig. 10. GEMINI scores and MAF levels during therapy.
Individuals with a smoking history as well as availability of targeted deep sequencing and low coverage WGS data were analyzed before and during treatment with tyrosine kinase inhibitors (arrows indicate initiation of treatment). GEMINI scores were associated with the median mutant allele fraction (MAF) of detectable mutations at each timepoint with values of zero used in CGPLLU269 samples where no mutations were detected (Spearman’s correlation coefficient = 0.53, p = 0.02, two-sided). The range of median MAFs for all GEMINI positive patients was 0.17% to 50.91% at 80% specificity.

Comment in

References

    1. Sung H, et al. Global cancer statistics 2020: GLOBOCAN estimates of incidence and mortality worldwide for 36 cancers in 185 countries. CA Cancer J. Clin. 2021;71:209–249. doi: 10.3322/caac.21660. - DOI - PubMed
    1. Guide to Cancer Early Diagnosis (World Health Organization, 2017).
    1. Moyer VA. U.S. Preventive Services Task Force. Screening for lung cancer: U.S. Preventive Services Task Force recommendation statement. Ann. Intern. Med. 2014;160:330–338. - PubMed
    1. de Koning HJ, et al. Reduced lung-cancer mortality with volume CT screening in a randomized trial. N. Engl. J. Med. 2020;382:503–513. doi: 10.1056/NEJMoa1911793. - DOI - PubMed
    1. National Lung Screening Trial Research Team. Reduced lung-cancer mortality with low-dose computed tomographic screening. N. Engl. J. Med. 2011;365:395–409. doi: 10.1056/NEJMoa1102873. - DOI - PMC - PubMed

Publication types

Substances