. 2023 Jul 27;6(1):783.
doi: 10.1038/s42003-023-05046-z.

Nonclassical mechanisms to irreversibly suppress β-hematin crystal growth

Affiliations

Nonclassical mechanisms to irreversibly suppress β-hematin crystal growth

Wenchuan Ma et al. Commun Biol. .

Abstract

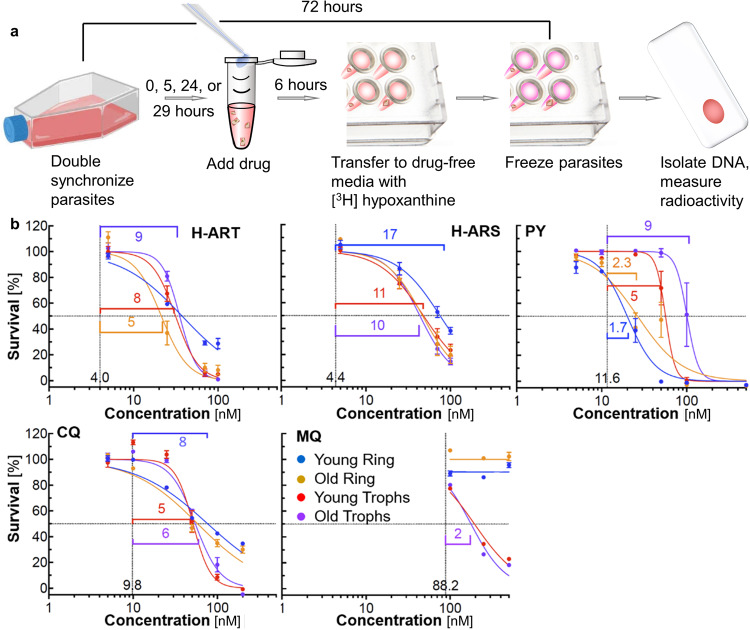
Hematin crystallization is an essential element of heme detoxification of malaria parasites and its inhibition by antimalarial drugs is a common treatment avenue. We demonstrate at biomimetic conditions in vitro irreversible inhibition of hematin crystal growth due to distinct cooperative mechanisms that activate at high crystallization driving forces. The evolution of crystal shape after limited-time exposure to both artemisinin metabolites and quinoline-class antimalarials indicates that crystal growth remains suppressed after the artemisinin metabolites and the drugs are purged from the solution. Treating malaria parasites with the same agents reveals that three- and six-hour inhibitor pulses inhibit parasite growth with efficacy comparable to that of inhibitor exposure during the entire parasite lifetime. Time-resolved in situ atomic force microscopy (AFM), complemented by light scattering, reveals two molecular-level mechanisms of inhibitor action that prevent β-hematin growth recovery. Hematin adducts of artemisinins incite copious nucleation of nonextendable nanocrystals, which incorporate into larger growing crystals, whereas pyronaridine, a quinoline-class drug, promotes step bunches, which evolve to engender abundant dislocations. Both incorporated crystals and dislocations are known to induce lattice strain, which persists and permanently impedes crystal growth. Nucleation, step bunching, and other cooperative behaviors can be amplified or curtailed as means to control crystal sizes, size distributions, aspect ratios, and other properties essential for numerous fields that rely on crystalline materials.


Conflict of interest statement

The authors declare no competing interests.

Figures

Fig. 1
Fig. 1. Inhibition of crystal length and width.
a A scanning electron microscopy (SEM) image and schematic illustrating the β-hematin crystal habit and the definitions of crystal length l and width w. In the hematin crystal structure, gray spheres represent C, blue, N, silver, H, and red, O. b SEM images of β-hematin crystals grown at times and compositions indicated with (i)–(iii) in (d) in the presence of 10 μM of PY. c Schematic of preservation of the crystal shape during growth in pure solutions and inhibitor-induced suppression of l or w by interaction of an inhibitor with axial and lateral crystal faces, respectively. Concentric contours denote crystal shape at increasing times of growth. d Schematic of inhibitor concentration variation used to test the reversibility of inhibition of l and w. Solid blue line indicates crystals exposed to an inhibitor concentration X μM (where X = 10 for H-ART, H-ARS, and PY; 2 for CQ; and 5 for MQ) for 3 days, after which the crystals were exposed to a metabolite- or drug-free solution for 10 days. The orange dashed line represents crystals that were kept at a constant inhibitor concentration X μM for 13 days. The dotted purple line indicates crystals exposed to inhibitor concentration X μM for 3 days; the short-dashed gray line indicates controls that grew in a metabolite- or drug-free solution for 13 days. Numbers (i)–(iii) indicate compositions and times of harvesting of crystals grown in the presence of PY and imaged in panel (b). e Lengths and widths of crystals grown in 0.5 mM hematin solutions and in the presence of 10 μM H-ART, H-ARS, and PY, 2 μM of CQ, and 5 μM of MQ in the starting solution. Error bars depict the standard deviations from averages over ca. 30 crystals for each composition regime and growth time. Vertical green and red braces define the length or width accrued during growth between days 3 and 13. Horizontal green and red brackets link length and width increments that are compared in, respectively, reversibility criterion 1, for H-ARS, and criterion 2, for PY.
Fig. 2
Fig. 2. The molecular mechanism of irreversible inhibition of β-hematin crystallization by H-ART.
a The structure of H-ART. b, Schematic of step inhibition by kink blockers, which associate with the kinks and obstruct the access of solute molecules. ce AFM images of (100) β-hematin crystal surfaces at hematin concentration CH = 0.50 mM. Gold arrowheads indicate nanocrystals on β-hematin surfaces. c Still image with added H-ART at 10 μM. d, e The evolutions of nanocrystals in the absence of H-ART, in (d), and in its presence in (e). fh Light scattering characterization of the evolution of aggregation in hematin solutions. f, g The evolutions of the autocorrelation functions G(τ) of the scattered light over 40 min in solutions with CH = 0.5 mM, in (f), and with added 10 μM H-ART, in (g). Deviations from zero manifest the formation of aggregates. h The evolutions of the amplitudes of the aggregates’ shoulders of G(τ) in (f) and (g), averaged over 10 measurements; the error bars denote the standard deviations and are smaller than the symbol sizes. i The correlations of step velocity v, the new layer nucleation rate J2D, and the crystal growth rate V with CH. Gold diamonds, metabolite-free solutions; orange spheres, in the presence of 10 μM H-ART. Error bars denote the standard deviations from the averages of ca. 30 measurements. j Sequential AFM images of step patterns on the (100) β-hematin crystal surface at hematin and H-ART concentrations indicated on the panel. Gold arrowhead indicates a nanocrystal. k The step velocity v at different combinations of hematin and H-ART concentrations, corresponding to morphologies in (j).
Fig. 3
Fig. 3. The molecular mechanism of irreversible inhibition of β-hematin crystallization by PY.
a The structure of PY. b Schematic illustration of step pair stabilization by PY. c, d AFM images of (100) β-hematin crystal surfaces at CH = 0.28 mM, in (c), and after the addition of 4 μM PY, in (d). Callouts in d zoom in on encircled segments d1 and d2, where macrosteps fold to engender a dislocation. eg The correlations of step velocity v, the dimensionless step density p, and the crystal growth rate V with CH in the presence of 2 and 4 μM PY. Error bars span two standard deviations from the averages of ca. 30 measurements. h Step patterns on the (100) β-hematin crystal surface at hematin and PY concentrations indicated on the panel. Arrows indicate dislocation outcrop points manifested as centers of spiral steps. i The step velocity v at different combinations of hematin and H-ART concentrations, corresponding to morphologies in (h).
Fig. 4
Fig. 4. Reversible inhibition by CQ.
a The structure of CQ. b Schematic of step inhibition by step pinners, which adsorb on the terraces between steps, thus forcing steps to bend to grow between the two pinners. If the separation between two pinners Δx is shorter than the critical two-dimension diameter 2Rcrit, step growth ceases. If Δx is longer but comparable to 2Rcrit step growth is delayed. c Step patterns on the (100) β-hematin crystal surface at hematin and CQ concentrations indicated on the panels. d The step velocity v at different combinations of hematin and CQ concentrations, corresponding to the morphologies in (c).
Fig. 5
Fig. 5. Irreversible suppression of malaria parasites in six-hour inhibitor pulses.
a Schematic of drug pulse assay with [3H] hypoxanthine detection of parasite survival. b Fraction of parasites surviving for 72 h after their lifecycles were synchronized. Concentrations refer to the inhibitor denoted in the respective panel. The parasites were exposed for 6 h to H-ART, H-ARS, PY, CQ, and MQ, introduced at 0, 5, 24, and 29 h of their lives. These parasite ages correspond to young ring-stage parasites, old ring-stage parasites, young trophozoites, and old trophozoites, respectively. The legend is in the MQ panel. Thin vertical lines and adjacent numbers denote independently measured continuous inhibitor IC50 values, the concentration of a drug that inhibits 50% of the parasites with a 72-h inhibitor exposure. These horizontal lines mark the 50% parasite survival. Horizontal brackets and adjacent numbers denote fold ratios of the inhibitor concentrations that suppress 50% of parasites of each age in a 6-h pulse to the drug’s continuous IC50.

References

    1. Pagola S, Stephens PW, Bohle DS, Kosar AD, Madsen SK. The structure of malaria pigment β-haematin. Nature. 2000;404:307–310. doi: 10.1038/35005132. - DOI - PubMed
    1. Miller LH, Ackerman HC, Su X-Z, Wellems TE. Malaria biology and disease pathogenesis: insights for new treatments. Nat. Med. 2013;19:156–167. doi: 10.1038/nm.3073. - DOI - PMC - PubMed
    1. Kapishnikov S, Hempelmann E, Elbaum M, Als-Nielsen J, Leiserowitz L. Malaria pigment crystals: the Achillesо heel of the malaria parasite. ChemMedChem. 2021;16:1515–1532. doi: 10.1002/cmdc.202000895. - DOI - PMC - PubMed
    1. Kapishnikov S, et al. Unraveling heme detoxification in the malaria parasite by in situ correlative X-ray fluorescence microscopy and soft X-ray tomography. Sci. Rep. 2017;7:7610. doi: 10.1038/s41598-017-06650-w. - DOI - PMC - PubMed
    1. Ma W, et al. A second mechanism employed by artemisinins to suppress Plasmodium falciparum hinges on inhibition of hematin crystallization. J. Biol. Chem. 2021;296:100123. doi: 10.1074/jbc.RA120.016115. - DOI - PMC - PubMed

Publication types