. 2023 Aug;24(8):1382-1390.
doi: 10.1038/s41590-023-01558-2. Epub 2023 Jul 27.

Exposure of iPSC-derived human microglia to brain substrates enables the generation and manipulation of diverse transcriptional states in vitro

Affiliations

Exposure of iPSC-derived human microglia to brain substrates enables the generation and manipulation of diverse transcriptional states in vitro

Michael-John Dolan et al. Nat Immunol. 2023 Aug.

Abstract

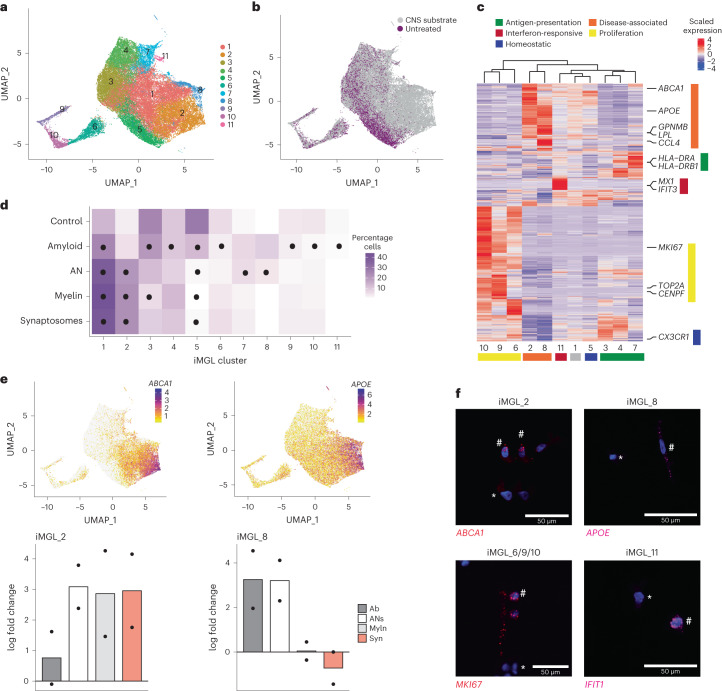
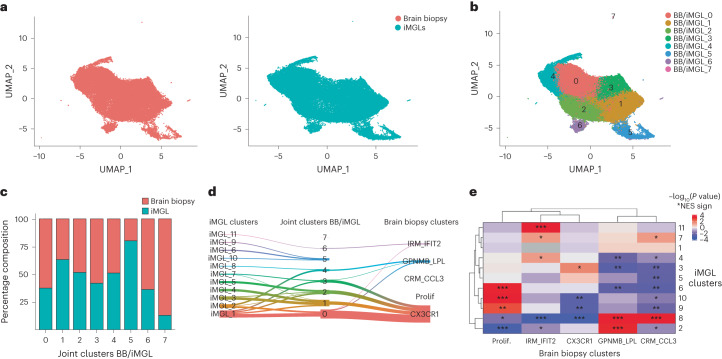
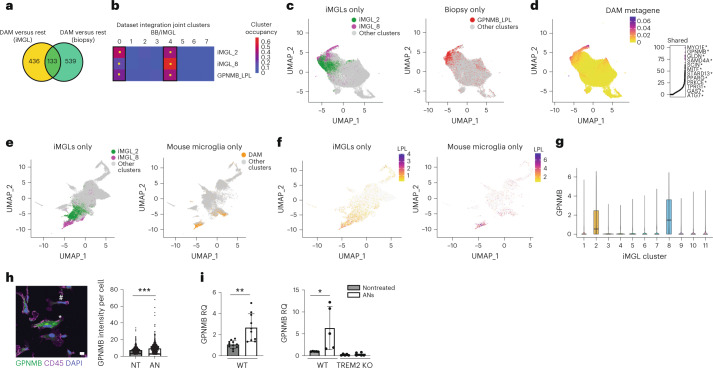
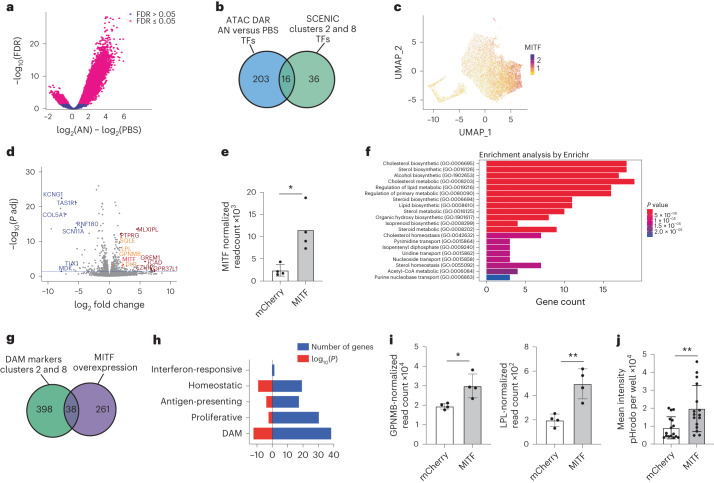
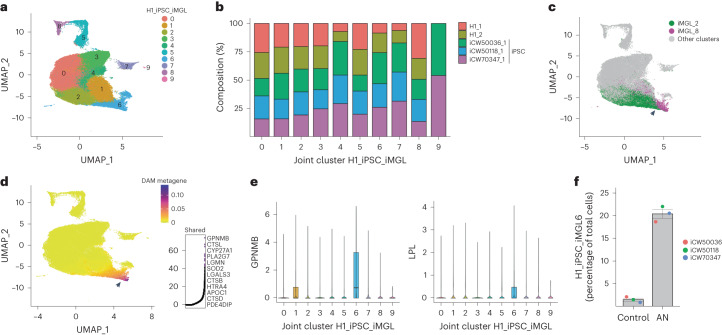
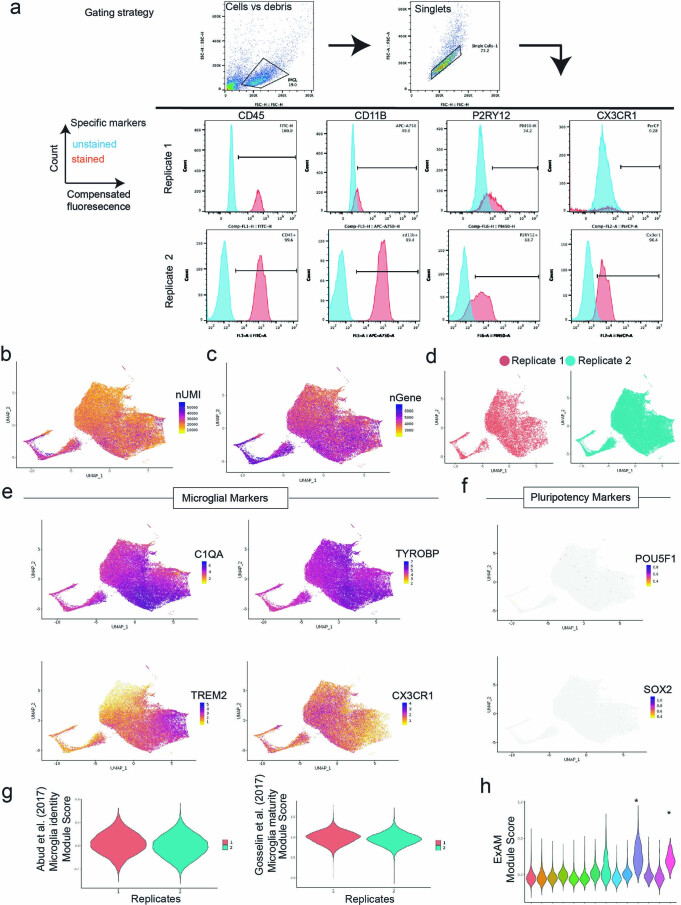
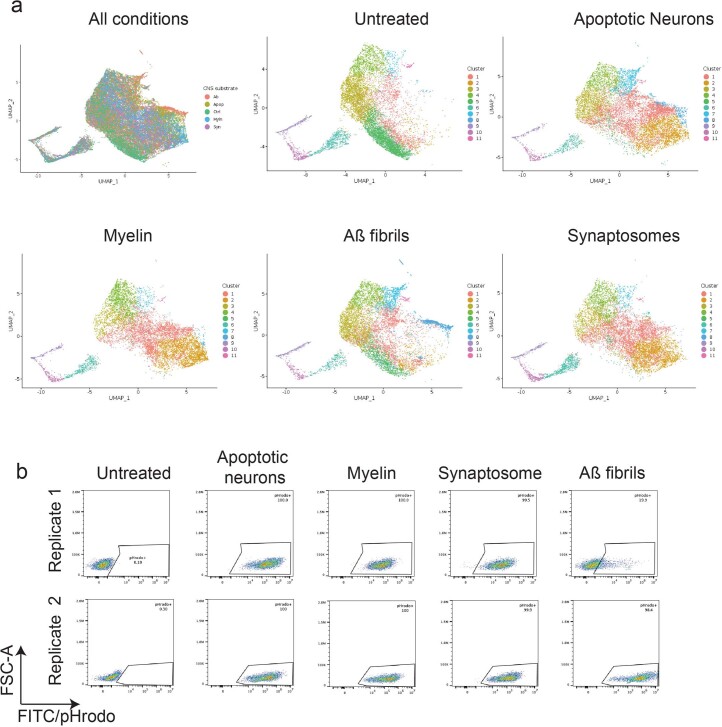
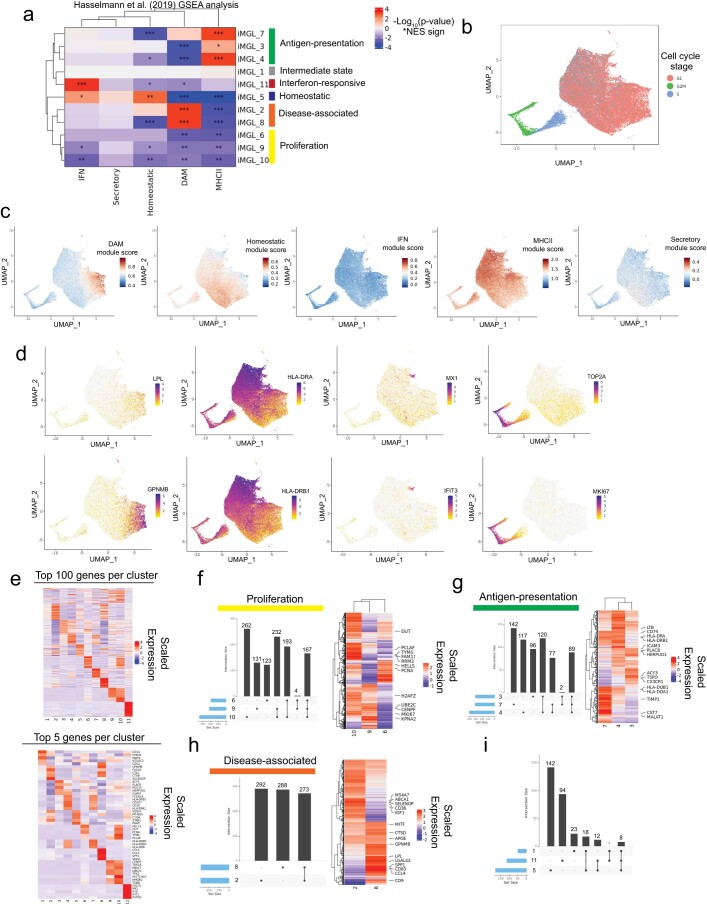
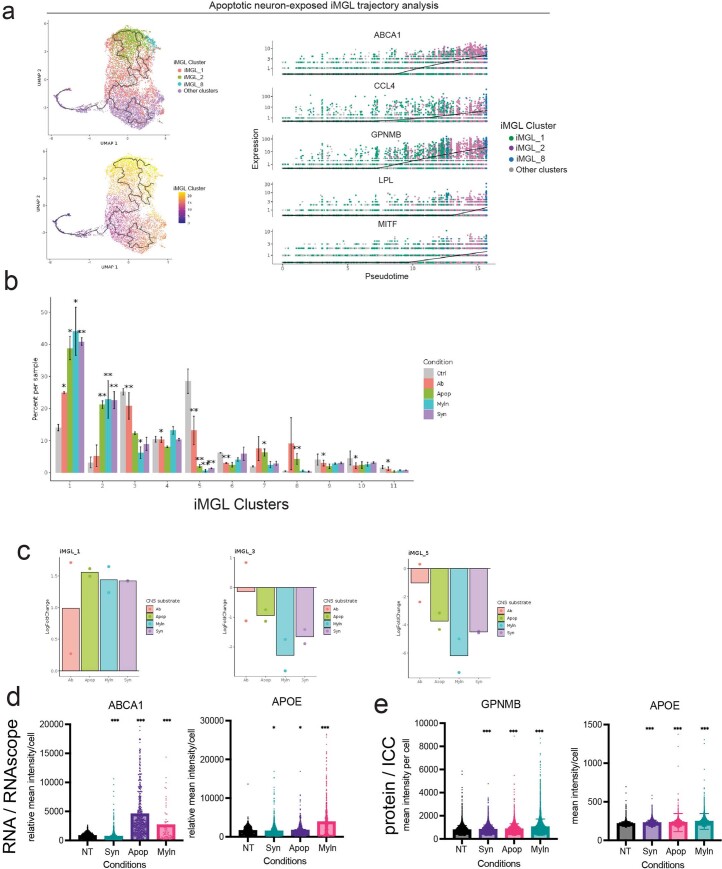
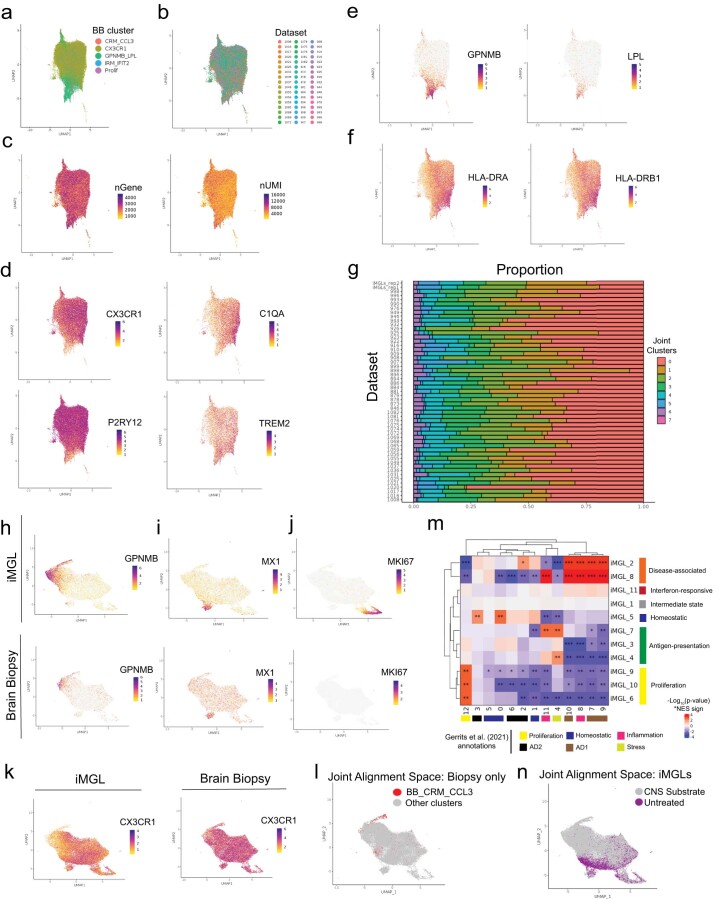
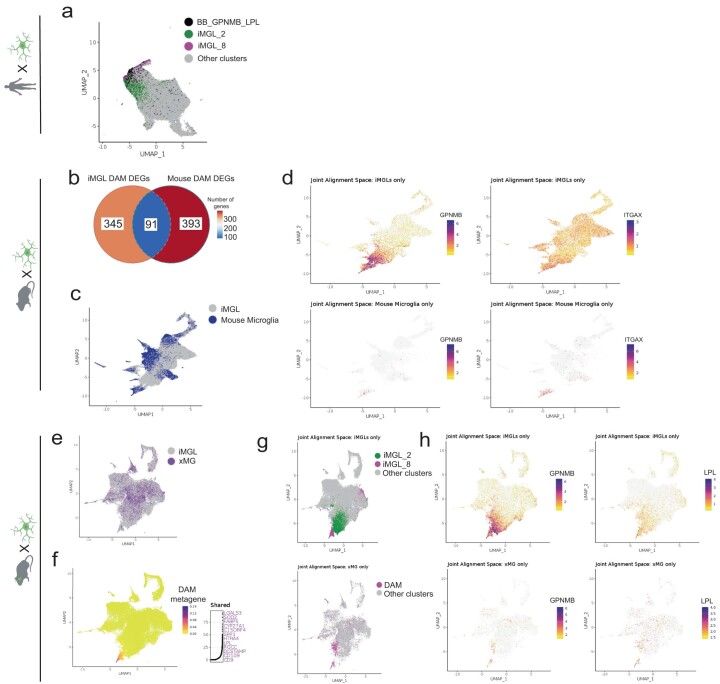
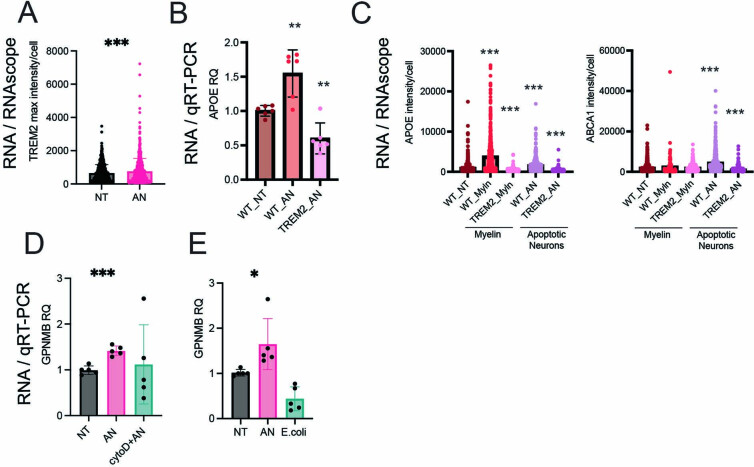
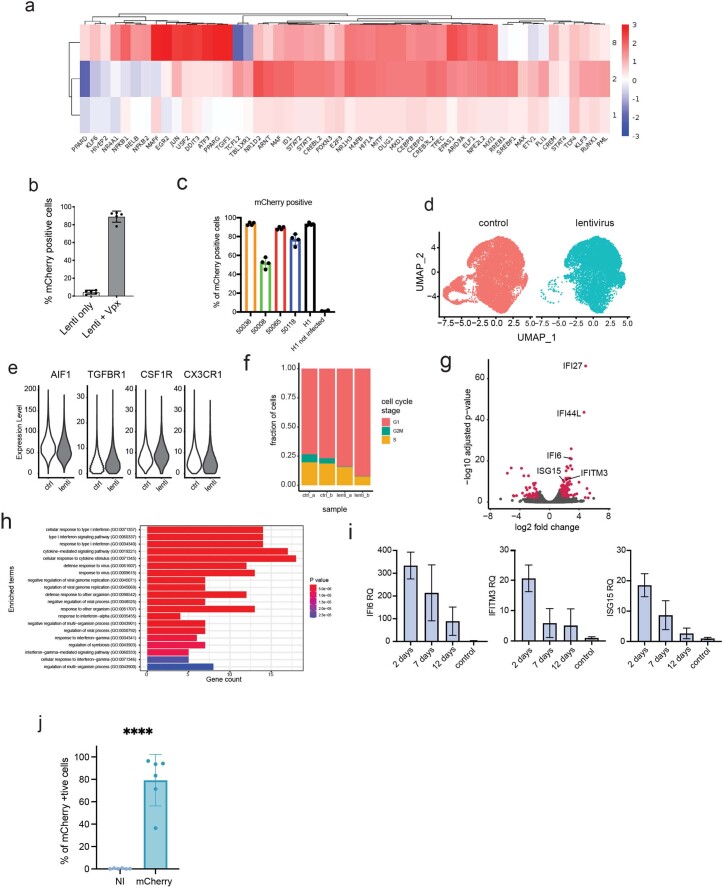
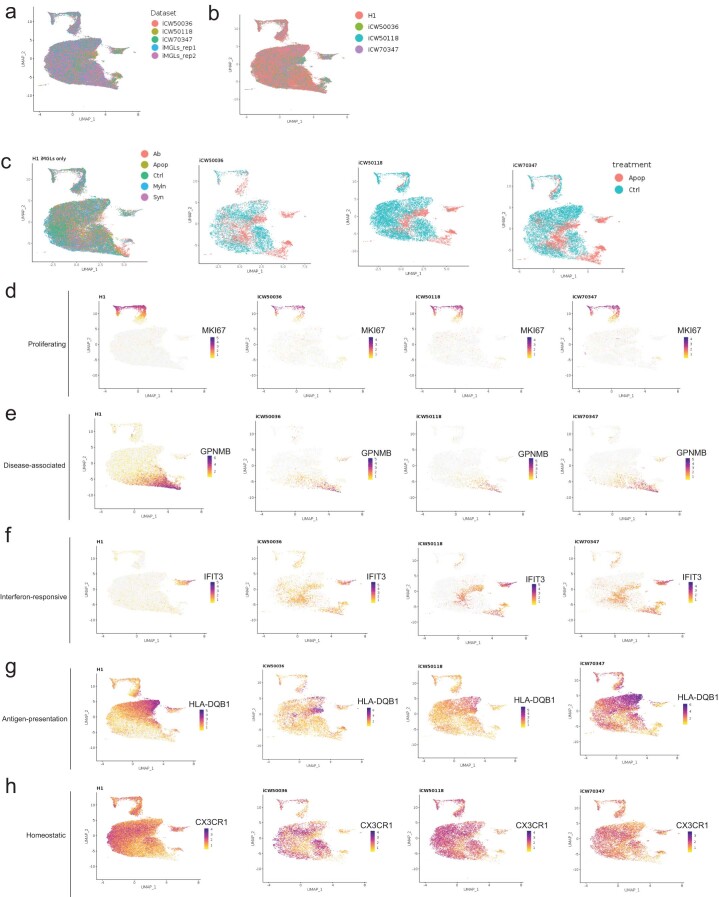
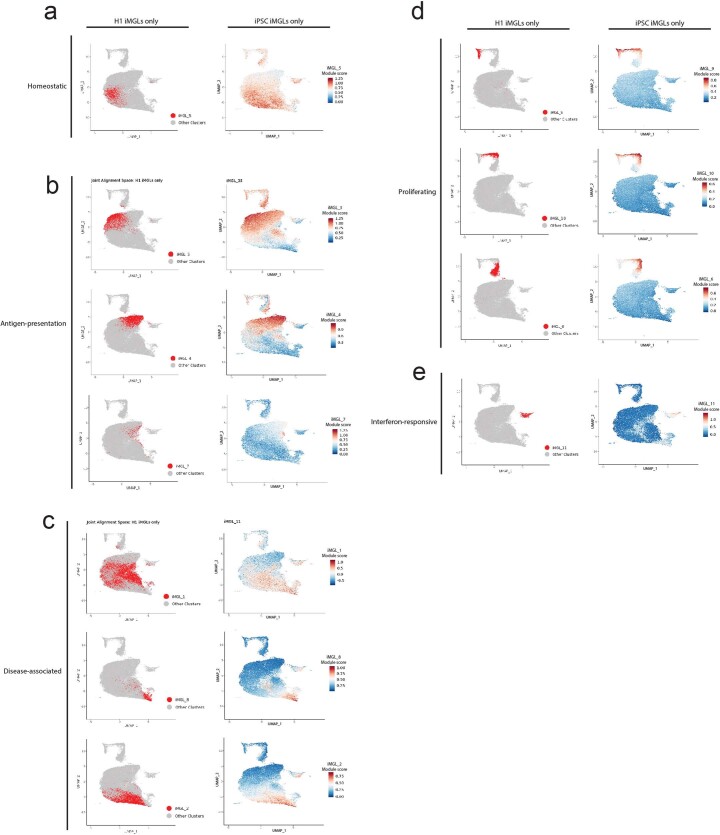
Microglia, the macrophages of the brain parenchyma, are key players in neurodegenerative diseases such as Alzheimer's disease. These cells adopt distinct transcriptional subtypes known as states. Understanding state function, especially in human microglia, has been elusive owing to a lack of tools to model and manipulate these cells. Here, we developed a platform for modeling human microglia transcriptional states in vitro. We found that exposure of human stem-cell-differentiated microglia to synaptosomes, myelin debris, apoptotic neurons or synthetic amyloid-beta fibrils generated transcriptional diversity that mapped to gene signatures identified in human brain microglia, including disease-associated microglia, a state enriched in neurodegenerative diseases. Using a new lentiviral approach, we demonstrated that the transcription factor MITF drives a disease-associated transcriptional signature and a highly phagocytic state. Together, these tools enable the manipulation and functional interrogation of human microglial states in both homeostatic and disease-relevant contexts.


Conflict of interest statement

K.E. is cofounder of Q-State Biosciences, Quralis and Enclear Therapies, and is group vice president at BioMarin Pharmaceutical. M.B.-J. is a coinventor of patent application WO/2018/160496, related to the differentiation of pluripotent stem cells into microglia, and cofounder of NovoGlia Inc. B.S. serves on the SAB and is also a minor shareholder in Annexon Biosciences and Neumora Therapeutics.

Figures

Fig. 1
Fig. 1. Treatment of iMGLs with CNS substrates induces diverse transcriptional states that map to those found in vivo.
a, Uniform manifold approximation and projection (UMAP) of iMGLs that were either untreated or treated for 24 h with synaptosomes, myelin debris, synthetic Aβ fibrils or ANs (collectively referred to as CNS substrates) followed by scRNA-seq; total of 56,454 cells across two replicates, cells colored by cluster. b, UMAP projection as in a; cells colored as untreated or CNS-substrate-treated condition. c, Heatmap of differentially enriched genes for each cluster (iMGL_1-11) sorted by similarity and microglial states; states are labeled. d, Mean relative abundance of each cluster across each condition. Circles represent significant differences (adjusted P < 0.05; Supplementary Table 3) determined by a Dirichlet regression test for differential abundance. e, Marker gene expression (top) and log fold change of cluster relative to untreated (bottom) for clusters iMGL_2 (left) and iMGL_8 (right) (n = 2). Syn, synaptosomes; Myln, myelin debris; Ab, synthetic Aβ fibrils. f, Representative images of gene expression with fluorescent in situ hybridization for disease-associated (iMGL_2 and iMGL_8), proliferation (iMGL_6/9/10) and interferon-responsive (iMGL_11) states. All cells were positive for expression of C1QA; not shown for clarity. The hash symbol indicates a positive cell and the asterisk indicates a negative cell. Scale bar, 50 μm. See Extended Data Fig. 4 for quantifications per condition.
Fig. 2
Fig. 2. Dataset integration of iMGL and human cortical biopsy microglia reveals analogous transcriptional states.
a, UMAP projection of integrated human brain biopsy microglia (left) and iMGL profiles (right). Cells are colored by dataset. b, UMAP projection of integrated human brain biopsy microglia and iMGL profiles. Cells are colored by BB/iMGL joint cluster. c, Proportion of cells per joint cluster from each source of data (human brain biopsy microglia or iMGLs), normalized by the proportion of total cells per dataset. d, River plot showing the relationship between joint clusters and the clusters defined in both the iMGL and brain biopsy datasets. Links with fewer than 200 cells have been removed for clarity. e, Heatmap illustrating the relative enrichment significance (as determined by fgsea; Methods) of positively enriched marker genes from each human brain biopsy cluster, within all differentially expressed genes for each iMGL cluster. Prolif, proliferative; NES, normalized enrichment score. *P < 0.05, **P < 0.01, ***P < 0.001.
Fig. 3
Fig. 3. DAMs generated in vitro are similar to those found in human and in mouse in vivo models.
a, Venn diagram showing overlap between DAM signature iMGL and brain biopsy (P = 3.06 × 10−68, hypergeometric test). b, Percentage distribution of cells from iMGL_2, iMGL_8 and BB_GPNMB_LPL over joint clusters BB/iMGL. Yellow square indicates significant enrichment using binomial test, P < 0.05. c, UMAP projection (as in Fig. 2) colored by cluster identity. d, UMAP projection (as in c) showing the metagene common to both iMGL and brain biopsy DAMs (left) and top genes (right). Asterisk labels genes in the ‘AD1’ DAM cells identified in ref. . e, UMAP projection of LIGER integration of iMGL and microglia from the 5xFAD mouse model, cells colored by cluster: iMGL_2 (green), iMGL_8 (magenta) or mouse microglia with DAMs (orange). f, UMAP projection (as in e) showing expression of LPL in iMGLs (left) and mouse microglia (right). g, Violin plot of GPNMB mRNA expression plotted by iMGL cluster; n = 2 replicates per condition, all five conditions pooled. Boxes show the first and third quartiles of the data with a line marking the median. Whiskers mark values closest to 1.5 times the interquartile range; no outliers are plotted. h, Immunocytochemistry of GPNMB expression in iMGLs treated with ANs or PBS. Left, representative image showing GPNMB (green) and CD45 (magenta, microglia marker). Asterisk indicates a positive cell, and hash indicates a negative cell. Right, quantitative analysis (two-tailed t-test, ***P < 0.001; at least 500 cells were counted per condition, data combined from four replicates, mean and s.d. are shown). Scale bar, 50 μm. i, Quantitative rtPCR of GPNMB expression in H1 iMGLs (left) and TREM2-deficient or isogenic iMGLs (right) treated with ANs or PBS. For H1 iMGL, two-tailed t-test, P = 0.0009, n > 4, mean and s.d. of relative quantification (RQ) are shown; for TREM2-deficient or isogenic iMGL, two-tailed t-test, P = 0.0427, n > 4, mean and s.d. are shown. KO, knockout; WT, wild type. *P < 0.05, **P < 0.01.
Fig. 4
Fig. 4. MITF is a key DAM regulator and driver of phagocytosis.
a, Volcano plot of differentially accessible peaks according to ATAC-seq of iMGLs exposed to ANs compared with untreated. Peaks with false discovery rate (FDR) ≤ 0.05 are shown in magenta. b, Intersection of transcription factors nominated by ATAC-seq and SCENIC analysis. c, UMAP projection of iMGL dataset (as in Fig. 1a) showing MITF expression in iMGLs treated with CNS substrates. d, Volcano plot of differentially expressed genes (DEG) in the iMGLs overexpressing MITF (n = 4) compared with those overexpressing mCherry (n = 4). Blue indicates top downregulated genes, dark red indicates top upregulated genes and orange indicates genes involved in DAM signature and lipid metabolism. Blue line represents adjusted FDR ≤ 0.05. P adj, adjusted P value. e, Quantification of MITF expression in iMGLs transduced with mCherry-expressing and MITF-expressing lentivirus (two-tailed t-test, P = 0.0129, mean and s.d. are shown; n = 4 for each condition). f, Bar graph of gene ontology analysis for MITF-overexpression DEG. Bar length represents the number of genes, and shading represents statistical significance. g, Venn diagram of overlap between DEG in iMGL samples transduced with MITF-expressing versus mCherry-expressing lentivirus, and DEG in iMGL_02 and iMGL_8; hypergeometric test, P = 1.098 × 10−12. h, Comparison of MITF-overexpression genes with iMGL states; numbers of genes and P values from the hypergeometric test are shown. i, Quantification of GPNMB expression (left, two-tailed t-test, P = 0.0159, *P < 0.05) and LPL expression (right, two-tailed t-test, P = 0.0042, **P < 0.01) in RNA sequencing samples as in d. j, Mean intensity of pHrodo-conjugated AN in iMGLs transduced with either MITF or mCherry (two-tailed t-test, P = 0.0051, **P < 0.01; n > 5 for each condition). In all bar graphs, error bars represent s.d.
Fig. 5
Fig. 5. Multiple iPSC-line-derived iMGLs also exhibit transcriptional diversity and DAM induction.
a, UMAP projection of integrated H1 iMGL and iPSC iMGL profiles; cells are colored by identity of H1_iPSC_iMGL joint clusters. b, Proportion of cells per H1_iPSC_iMGL joint cluster for each dataset (either iMGL H1 replicates or three separate iPSC lines differentiated into iMGLs). c, UMAP projection as in a. Green, iMGL_2; magenta, iMGL_8. d, UMAP projection (as in a) of the shared metagene common to both datasets in cluster 6. Right, top constituent genes of this shared factor. e, Violin plots showing expression of GPNMB and LPL across joint clusters in a. Boxes show the first and third quartiles of the data, with a line marking the median. Whiskers mark values closest to 1.5 times the interquartile range; no outliers are plotted. f, Percentages of nontreated (control) and AN-treated cells in joint cluster 6, from iPSC-derived iMGL only (two-tailed t-test, P = 0.00471; n = 3; mean and s.e.m. are shown). In c and d, the black arrow highlights joint cluster 6.
Extended Data Fig. 1
Extended Data Fig. 1. Single-cell RNAseq of iMGLs and quality control.
a) Flow cytometry gating strategy and plots illustrating expression of microglial protein markers from the two independent differentiations used for the scRNAseq dataset. Cells underwent either flow cytometry or single-cell RNAseq. b-c) UMAP projection (as in Fig. 1a) of quality control metrics for iMGL dataset highlighting the number of unique molecular identifiers (nUMI, b) and the number of genes (nGene, c). d) UMAP projection (as in Fig. 1a), cells colored by replicate. e) UMAP projection (as in Fig. 1a) showing expression of four key microglial markers. f) UMAP projection (as in Fig. 1a) showing expression of two stem cell markers. g) Module scores for microglia identity and maturity per cell, plotted by replicate h) Module scores for microgliaExAM signature per cells plotted per iMGL cluster. Two high ExAM clusters were removed(*). Note n = 2 independent differentiations for B-F.
Extended Data Fig. 2
Extended Data Fig. 2. Single-cell RNAseq data and phagocytosis of substrates for each condition.
a) UMAP projection of iMGL dataset for each condition (n = 2 independent differentiations per condition), cells are colored by conditions. b) Flow cytometry measurement of pHrodo-488/FITC for each CNS substrate exposed to the iMGL dataset. FSC=forward scatter. FITC/pHrodo=phagocytosis of substrate.
Extended Data Fig. 3
Extended Data Fig. 3. Annotation and gene expression signatures of iMGL datasets.
A) Heatmap illustrating the relative GSEA enrichment significance of positively enriched marker genes from each microglial cluster from xenotransplanted iMGLs in vivo, within all differentially expressed genes for each iMGL cluster. b) UMAP projection of iMGL dataset, cells colored by cell cycle phase (G1, G2M and S) c) UMAP projection of iMGL dataset, cells colored by module scores of transcriptional signature identified in xenotransplanted iMGLs in vivo. d) UMAP projection of iMGL dataset, cells colored by expression of LPL, GPNMB (iMGL_2 and iMGL_8), HLA-DRA, HLA-DRB1 (marker genes for iMGL_3, iMGL_4 and iMGL_7), MX1, IFIT3 (marker genes for iMGL_11), TOP2A or MKI67 (marker genes for iMGL_6, iMGL_9, iMGL_10). e) Heatmap of the top 100 (top) or top 5 (bottom) differentially expressed genes for each iMGL cluster. f-h) Upset plots (left) summarizing the number of unique and shared differentially expressed genes for each cluster within each microglial state identified and heatmaps (right) showing the expression of positively enriched genes for the constituent clusters of each state. i) Upset plots (as in g) for clusters iMGL_1, iMGL_5 and iMGL_11.
Extended Data Fig. 4
Extended Data Fig. 4. iMGL clusters by trajectory, substrate exposure and validation with in situ hybridization and ICC.
a) Single cell profiles of apoptotic neuron-exposed iMGLs (n = 2) in UMAP space (left) and ordered by pseudotime (right) for clusters iMGL_1, iMGL_2 and iMGL_8. b) Barchart of percentage composition of cells per condition per cluster. Statistical significance determined by Dirichlet regression. * = p-value < 0.05 and ** = p-value < 0.01. c) Fold change of iMGL_1,iMGL_2 and iMGL_4 relative to the untreated control condition d) Quantification of fluorescent in situ hybridization of ABCA1 and APOE by mean intensity per cell. ABCA1: NT vs Syn p < 0.0001, NT vs Apop p < 0.0001, NT vs Myln p < 0.0001. APOE: NT vs Syn p = 0.076, NT vs Apop p = 0.01786, NT vs Myln p < 0.0001. e) Quantification immunocytochemistry of GPNMB and APOE by mean intensity per cell. GPNMB: NT vs Syn p < 0.001, NT vs Apop p < 0.0001, NT vs Myln p < 0.0001. APOE: NT vs Syn < 0.001, NT vs Apop p < 0.0001, NT vs Myln <0.0001. For d-e) >500 cells were counted by conditions across 4 biological replicates. NT= Not treated, Syn=synaptosomes, Myln=myelin debris, Ab=synthetic Aβ fibrils, Apop= apoptotic neurons.
Extended Data Fig. 5
Extended Data Fig. 5. Summary of the human cortical biopsy microglial dataset and LIGER alignment with iMGL dataset.
a) UMAP projection of cluster annotations of human brain biopsy (BB dataset) single dataset from ref. . b) UMAP projection, cells colored by patient. c) UMAP projection (as in a) number of genes (nGene, left) and number of unique molecular identifiers (nUMI, right). d-f) UMAP projection (as in a), cells colored by expression of CX3CR1, C1QA, P2RY12, TREM2 (d), GPNMB and LPL (e), HLA-DRA and HLA-DRB1 (f). g) Proportion of cells across joint clusters for each dataset (iMGL or brain biopsy dataset). h-k) UMAP projection LIGER integration of iMGL or brain biopsy dataset, cells colored by datasets (iMGL top, brain biopsy bottom) for expression of GPNMB (h), MX1 (i), MKI67 (j), CX3CR1 (k, iMGL left, brain biopsy right). l) UMAP projection (as in h), brain biopsy cells only with the BB_CRM_CCL3 state highlighted. m) Heatmap of the relative enrichment significance of positively enriched marker genes from each in vivo human microglial cluster from ref. , within differentially expressed genes of each iMGL cluster (GSEA analysis). n) UMAP projection (as in h) of cells from iMGL dataset only colored by substrates or untreated.
Extended Data Fig. 6
Extended Data Fig. 6. Dataset integration of iMGLs with mouse AD and xenotransplanted human microglia.
a) UMAP projection of LIGER integration of iMGL or brain biopsy dataset, cells colored by identity to cluster iMGL_2 (green), iMGL_8 (magenta) highlighted or BB_GPNMB_LPL cluster (black). b) Comparing overlap of iMGL DAM (iMGL_2 and iMGL_8) enriched genes with those enriched in murine DAMs in the 5xFAD genotype (p value: 5.41e-19, hypergeometric test). c) UMAP projection of LIGER integration of iMGL datasets with in vivo mouse microglia (from wild-type and 5xFAD genotypes). Cells colored by dataset. d) UMAP projection (as in c) of iMGLs (top) or mouse microglia (bottom) cells colored for expression of GPNMB (left) and ITGAX (right). e) UMAP projection LIGER integration of iMGLs and xenotransplanted iMGLs. Cells colored by dataset. f) UMAP projection (as in e) colored by expression of shared factor DAM metagene. Right, top constituent genes of this shared factor. g) UMAP projection (as in e), of iMGLs (top) or xenograft microglia (bottom) colored by identity to iMGL_2, iMGL_8 or DAM. h) UMAP projection (as in e), of iMGLs (top) or xenograft microglia (bottom) cells colored for expression of GPNMB (left) and LPL (right).
Extended Data Fig. 7
Extended Data Fig. 7. Dependence of iMGL DAM formation on TREM2 expression and substrate.
a) Quantification of relative intensity of TREM2 antibody stain determined by immunocytochemistry (p-value < 0.0001). b) rtPCR of APOE expression in WT and TREM2 KO iMGL(APOE WT_NT vs WT_AN p-value < 0.0035, APOE WT_AN vs TREM2_AN p-value < 0.0002). ABCA1 WT_NT vs WT_MYLN p-value = 0.074, c) APOE, ABCA1 expression level measured by RNAscope. (APOE WT_NT vs WT_MYLN p-value < 0.0001, APOE WT_MYLN vs TREM2_MYLN p-value < 0.0001, APOE WT_NT vs WT_AN p-value < 0.0001, APOE WT_AN vs TREM2_AN p-value < 0.0001, ABCA1 WT_NT vs WT_MYLN p-value = 0.0740, ABCA1 WT_MYLN vs TREM2_MYLN p-value = 0.0754, ABCA1 WT_NT vs WT_AN p-value < 0.0001, ABCA1 WT_AN vs TREM2_AN p-value < 0.0001). For b-c: At least 500 cells were counted by conditions across 4 biological replicates d) rtPCR of GPNMB mRNA in iMGLs untreated or exposed to AN or AN+ cytochalasin D (p-value < 0.0001) e) rtPCR of GPNMB mRNA in iMGLs untreated, treated with AN or E. coli (p-value = 0.0374).
Extended Data Fig. 8
Extended Data Fig. 8. Lentivirus-mediated genetic modification of iMGLs.
a) Heatmap of TFs identified by SCENIC DAM iMGL clusters (iMGL_1, iMGL_2 and iMGL_8), plotted by a scaled and centered area under the curve (AUC) for each regulon b) % of mCherry positive cells in iMGLs transduced with lentivirus only and lentivirus with VPX virus-like particles, determined by flow cytometry (p-value = 0.0079, two-tailed Mann-Whitney test). c) Transduction efficiency of iMGLs transduced from multiple cell lines using co-transduction strategy with VPX. Vector is non-targeting Cas9 control co-expressing mCherry and positive cells determined by flow cytometry d) UMAP projection of single-cell sequencing data from two untreated and lentivirus transduced iMGL differentiations, cells colored by treatment. e) Expression of AIF1, TGFBR1, CSF1R and CX3CR1 in the control and lentivirus samples. (AIF1 p-value = 0.463, TGFBR1 p-value = 0.999, CSF1R p-value = 0.999 and CX3CR1 p-value = 0.2193, Wald test with multiple hypothesis correction was performed with DESeq2). f) Distribution of cells by cell cycle stage in the control and lentivirus transduced samples. g) Volcano plot of differentially expressed genes between control and lentivirus transduced samples. Genes highlighted in red have adjusted p-value < 0.01 and log2 fold change < 1.5. Cycling cells were excluded prior to analysis. h) Gene ontology analysis of differentially expressed genes between control and lentivirus transduced samples. i) rtPCR time-course analysis of expression of three interferon-induced genes in iMGLs after lentivirus transduction. j) Percentage of mCherry-positive cells determined by flow cytometry, the number of cells transduced successfully (**** = p-value < 0.0001) (NI = non-infected). Error bars represent standard deviation.
Extended Data Fig. 9
Extended Data Fig. 9. Comparison of H1 and iPSC-derived iMGLs revealed similar transcriptional signatures.
a) UMAP projection of LIGER dataset integration of iMGL dataset and iPSC-derived iMGLs. Cells colored by dataset. b) UMAP projection (as in a), cells colored by line. c) UMAP projection (as in a), cells separated by line identity and colored by treatment condition. d-h) UMAP projection (as in a), cells separated by line identity and colored by expression of MKI67 (d), GPNMB (e), IFIT3 (f), HLA-DQB1 (g) or CXCR3 (h).
Extended Data Fig. 10
Extended Data Fig. 10. H1-derived and iPSC-derived iMGLs share similar transcriptional states, as demonstrated by module scores.
UMAP projection of LIGER dataset integration of iMGL dataset and iPSC-derived iMGLs. Cells colored by iMGL cluster identity (left) or expression of corresponding module score (right) for homeostatic (a), antigen-presentation (b), disease-associated (c) proliferating (d), interferon-responsive (e) states.

Comment in

References

    1. Salter MW, Stevens B. Microglia emerge as central players in brain disease. Nat. Med. 2017;23:1018–1027. - PubMed
    1. Kunkle BW, et al. Genetic meta-analysis of diagnosed Alzheimer’s disease identifies new risk loci and implicates Aβ, tau, immunity and lipid processing. Nat. Genet. 2019;51:414–430. - PMC - PubMed
    1. Jansen IE, et al. Genome-wide meta-analysis identifies new loci and functional pathways influencing Alzheimer’s disease risk. Nat. Genet. 2019;51:404–413. - PMC - PubMed
    1. Hickman S, Izzy S, Sen P, Morsett L, El Khoury J. Microglia in neurodegeneration. Nat. Neurosci. 2018;21:1359–1369. - PMC - PubMed
    1. Hammond TR, et al. Single-cell RNA sequencing of microglia throughout the mouse lifespan and in the injured brain reveals complex cell-state changes. Immunity. 2019;50:253–271.e6. - PMC - PubMed

Publication types