. 2023 Sep;7(9):1503-1514.
doi: 10.1038/s41559-023-02145-2. Epub 2023 Jul 27.

Ghost admixture in eastern gorillas

Affiliations

Ghost admixture in eastern gorillas

Harvinder Pawar et al. Nat Ecol Evol. 2023 Sep.

Abstract

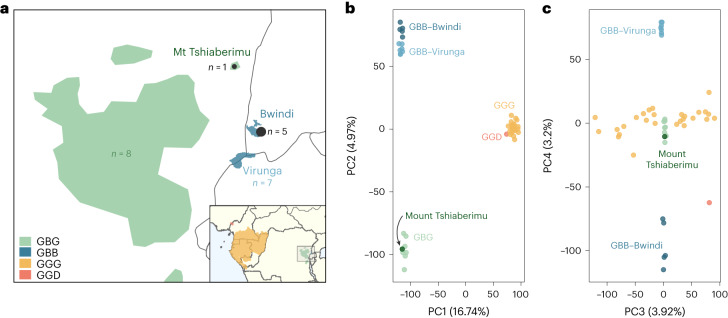
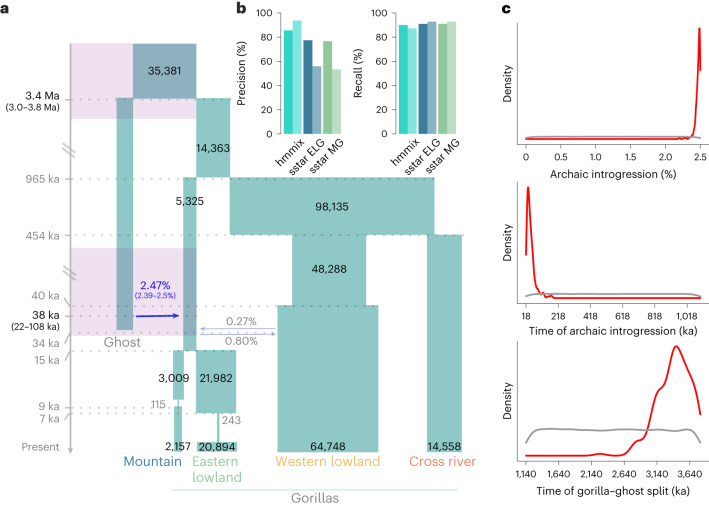
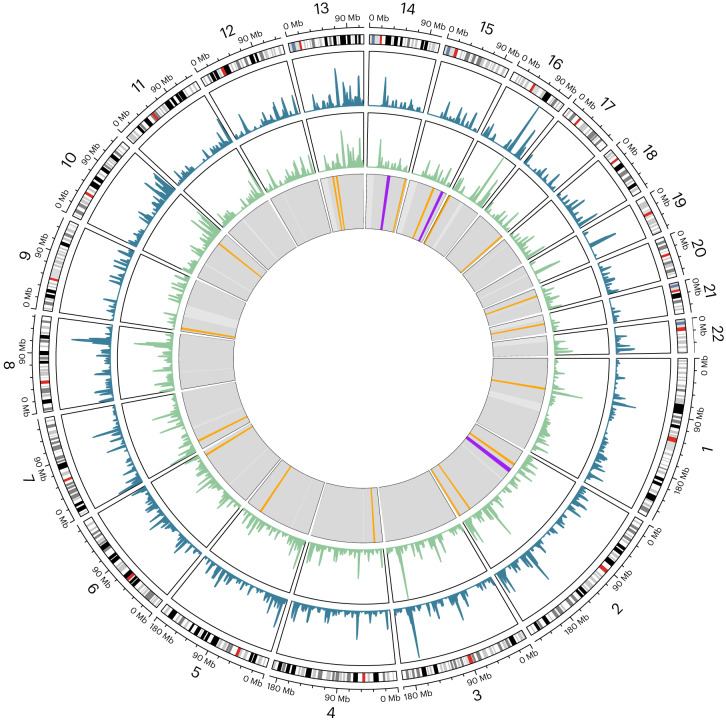
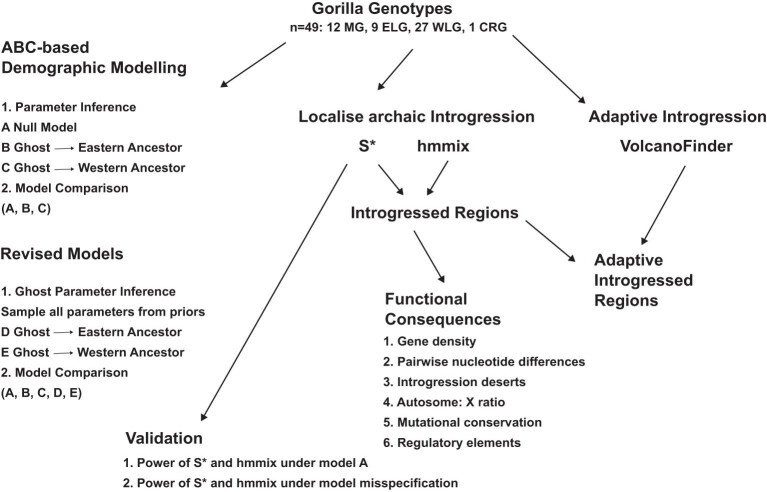
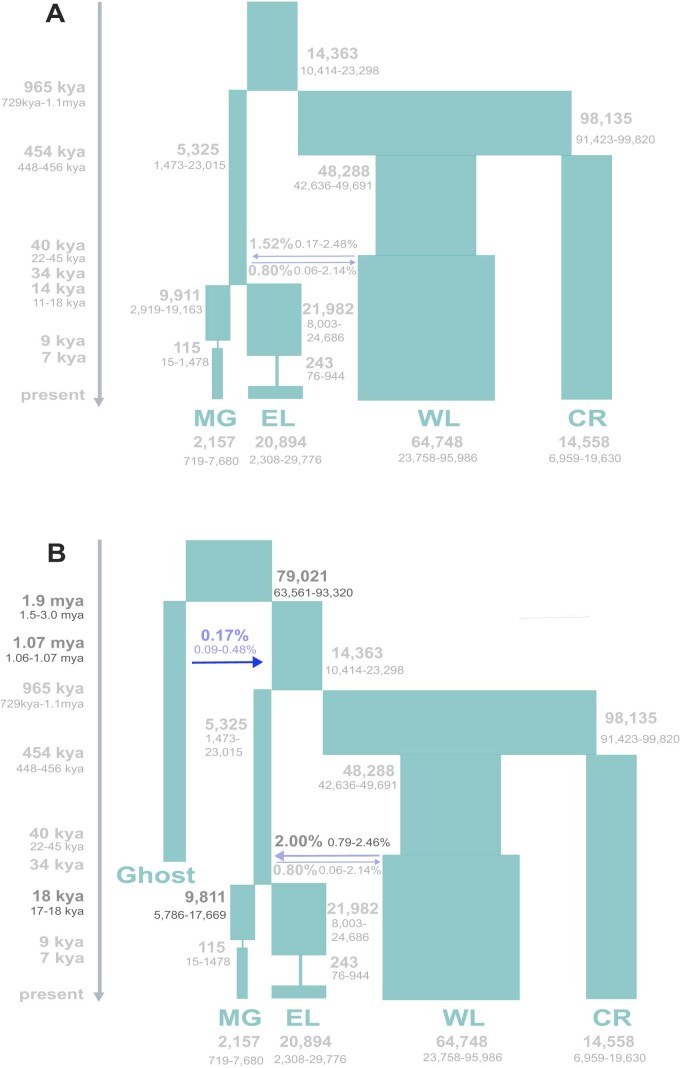
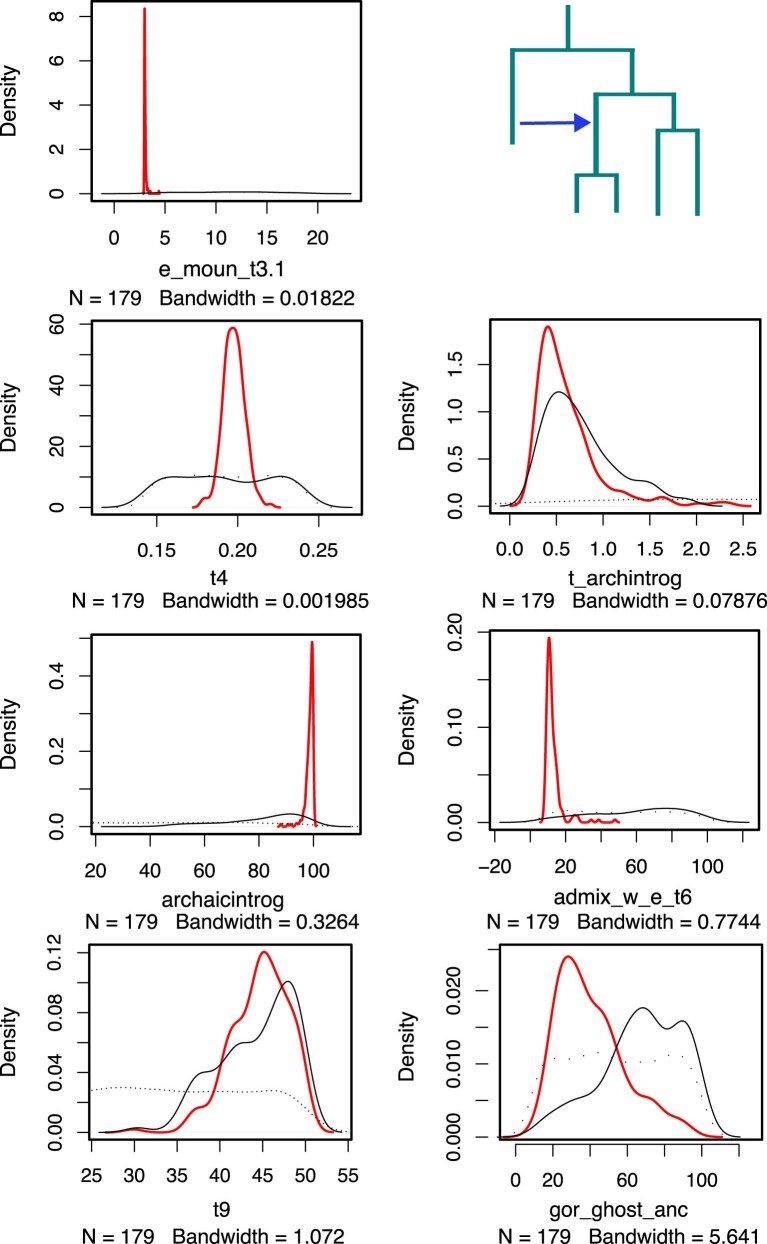
Archaic admixture has had a substantial impact on human evolution with multiple events across different clades, including from extinct hominins such as Neanderthals and Denisovans into modern humans. In great apes, archaic admixture has been identified in chimpanzees and bonobos but the possibility of such events has not been explored in other species. Here, we address this question using high-coverage whole-genome sequences from all four extant gorilla subspecies, including six newly sequenced eastern gorillas from previously unsampled geographic regions. Using approximate Bayesian computation with neural networks to model the demographic history of gorillas, we find a signature of admixture from an archaic 'ghost' lineage into the common ancestor of eastern gorillas but not western gorillas. We infer that up to 3% of the genome of these individuals is introgressed from an archaic lineage that diverged more than 3 million years ago from the common ancestor of all extant gorillas. This introgression event took place before the split of mountain and eastern lowland gorillas, probably more than 40 thousand years ago and may have influenced perception of bitter taste in eastern gorillas. When comparing the introgression landscapes of gorillas, humans and bonobos, we find a consistent depletion of introgressed fragments on the X chromosome across these species. However, depletion in protein-coding content is not detectable in eastern gorillas, possibly as a consequence of stronger genetic drift in this species.


Conflict of interest statement

The authors declare no competing interests.

Figures

Fig. 1
Fig. 1. Gorilla samples used in this study.
a, Present geographic distribution of eastern gorillas, with that of the four gorilla subspecies shown in the inset. The newly sequenced samples are given in black, numbers of previously sequenced eastern gorillas are given in colour. GBG, Gorilla beringei graueri (Eastern lowland gorilla, n = 9); GBB, Gorilla beringei beringei (Mountain gorilla, n = 12); GGG, Gorilla gorilla gorilla (Western lowland gorilla, n = 27); GGD, Gorilla gorilla diehli (Cross River gorilla, n = 1). Shape files for the distribution of gorilla subspecies were obtained from IUCN. b, PCA with PCs 1 and 2 shown. c, PCA with PCs 3 and 4 shown.
Fig. 2
Fig. 2. ABC-based demographic model.
a, Model of gorilla population history with archaic admixture from an unsampled ‘ghost’ lineage into the common ancestor of eastern gorillas. The 95% CrI are shown for the archaic introgression proportion, timing of archaic introgression and archaic divergence (purple timeframes), inferred under ABC modelling. Numbers on blocks represent effective population sizes. b, Precision and recall of hmmix (at the 95% posterior probability cutoff) and S* (at the 99% quantile using sstar) in simulated data using msprime. Precision (percentage of recovered introgressed fragments) and recall (percentage of true among inferred introgressed fragments) for hmmix and S* (for ELG, eastern lowland gorilla and MG, mountain gorilla). Dark bars represent performance using the model presented in a, light bars represent the ‘worst’ model with large Ne, in the case of hmmix to simulate the data to detect fragments, in the case of S* to obtain the expected distribution of S* scores. c, Posterior distributions for the archaic introgression proportion, time of archaic introgression and gorilla–ghost split time. The grey line indicates the prior distribution. The red line represents the posterior inferred with neural networks. Neural networks reduce the dimensionality of the summary statistics used and account for possible mismatch between the observed and simulated summary statistics.
Fig. 3
Fig. 3. Characterization of introgressed fragments.
a, Sharing of putative introgressed regions across eastern gorillas for autosomal regions detected using the S* statistic and hmmix. b, Pairwise nucleotide differences in introgressed regions (x axis) and in random regions (y axis) matched for length and proportion of positions with sufficient coverage (avoiding genomic regions without callable sites). Colours indicate the comparison: among eastern gorillas (EG–EG, green), among western gorillas (WG–WG, orange) and between eastern and western gorillas (EG–WG, purple). c, Percentage of overlapping base pairs in introgressed regions (red lines) and random regions (violin plots) for eastern gorillas. For details of the definition of random regions see Methods. d, Percentage of protein-coding content detected in introgressed regions (red lines) and random regions (violin plots) for eastern gorillas. e, Percentage of high impact GERP content detected in introgressed regions (red lines) and random regions (violin plots) for eastern gorillas. f, Autosome: X ratio of introgressed fragments inferred using hmmix for eastern gorillas (violin plots), with reference lines for the equivalent values for bonobos (red line) and humans (distribution as grey bar). In cf: MG, mountain gorillas; EL, eastern lowlands. In cf, data are presented in violin plots with overlaid boxplots, which represent the median and interquartile range (25th and 75th percentiles). In f, individual datapoints are additionally plotted as black circles. For ce, the data in violin plots consist of population-wise means for n = 100 iterations of random genomic regions; for f, the data consist of hmmix fragments for n = 12 mountain gorillas and n = 9 eastern lowland gorillas.
Fig. 4
Fig. 4. Distribution of introgressed fragments.
Outer circle: karyogram of the autosomes based on the human genome (hg19). Second circle from outside: introgression landscape in mountain gorillas (blue), as cumulative amount of introgressed material in sliding windows of 2 million base pairs, Mb). Third circle from outside: introgression landscape in eastern lowland gorillas (green) in sliding windows of 2 Mb. Inner circle: long regions depleted of introgression content are shown in orange (length ≥5 Mb) and purple (length ≥8 Mb). Grey: genomic regions with sufficient data (>20% of 40 kb windows passing threshold). White: genomic regions without sufficient data.
Extended Data Fig. 1
Workflow of the main analyses.
Extended Data Fig. 2
Extended Data Fig. 2. Demographic models A and C.
A Null model of gorilla population history (only extant populations). 95% credible intervals are shown for all parameters inferred. B Alternate model allowing the possibility of ghost introgression into the common ancestor of western gorillas, resulted in a model of ancestral population structure being inferred. We note under a model of ghost gene flow to the western common ancestor, the posteriors indicate a small contribution to the common ancestor of all gorillas (consistent with ancestral substructure), rather than a defined pulse to the western common ancestor. In darker colours are the parameters inferred under this alternate model with their 95% credible intervals.
Extended Data Fig. 3
Extended Data Fig. 3. Prior and posterior distributions for model B.
Parameter distributions for all parameters inferred under the ABC model allowing gene flow from a ghost lineage into the common ancestor of eastern gorillas. Red indicates the posterior distribution inferred with neural networks. Black indicates the posterior distribution inferred under a rejection method. The dotted grey line indicates the prior distribution.
Extended Data Fig. 4
Extended Data Fig. 4. Performance of S* and hmmix.
Precision-recall curves for the S* statistic as implemented in sstar and for hmmix. Main model refers to a model taking the weighted median posteriors from the ABC-based null demography presented herein (Extended Data Fig. 2A). Worst model refers to a model taking the maximum value of the 95% credible interval for all ancestral Ne parameters from the ABC-based null demography. For the S* statistic we consider the target population as alternately eastern lowland or mountain gorillas, eg Main Model EL. Worst mis-specified is where we generate simulated data under the worst model but run the S* analysis using the ‘quantile’ or outlier values inferred under the main model. Skov=hmmix method, EL=eastern lowland gorillas, M=mountain gorillas.

References

    1. Grubb P, et al. Assessment of the diversity of African primates. Int. J. Primatol. 2003;24:1301–1357. doi: 10.1023/B:IJOP.0000005994.86792.b9. - DOI
    1. Gray M, et al. Genetic census reveals increased but uneven growth of a critically endangered mountain gorilla population. Biol. Conserv. 2013;158:230–238. doi: 10.1016/j.biocon.2012.09.018. - DOI
    1. Plumptre AJ, et al. Catastrophic decline of world’s largest primate: 80% loss of Grauer’s gorilla (Gorilla beringei graueri) population justifies critically endangered status. PLoS ONE. 2016;11:e0162697. doi: 10.1371/journal.pone.0162697. - DOI - PMC - PubMed
    1. Maisels, F., Williamson, E. A. & Bergl, R. IUCN Red List of Threatened Species: Gorilla gorilla (IUCN, 2016); https://www.iucnredlist.org/species/9404/136250858
    1. Fünfstück T, Vigilant L. The geographic distribution of genetic diversity within gorillas. Am. J. Primatol. 2015;77:974–985. doi: 10.1002/ajp.22427. - DOI - PubMed

Publication types