. 2023 Aug;3(8):948-964.
doi: 10.1038/s43587-023-00451-9. Epub 2023 Jul 27.

Multi-omic rejuvenation and life span extension on exposure to youthful circulation

Affiliations

Multi-omic rejuvenation and life span extension on exposure to youthful circulation

Bohan Zhang et al. Nat Aging. 2023 Aug.

Abstract

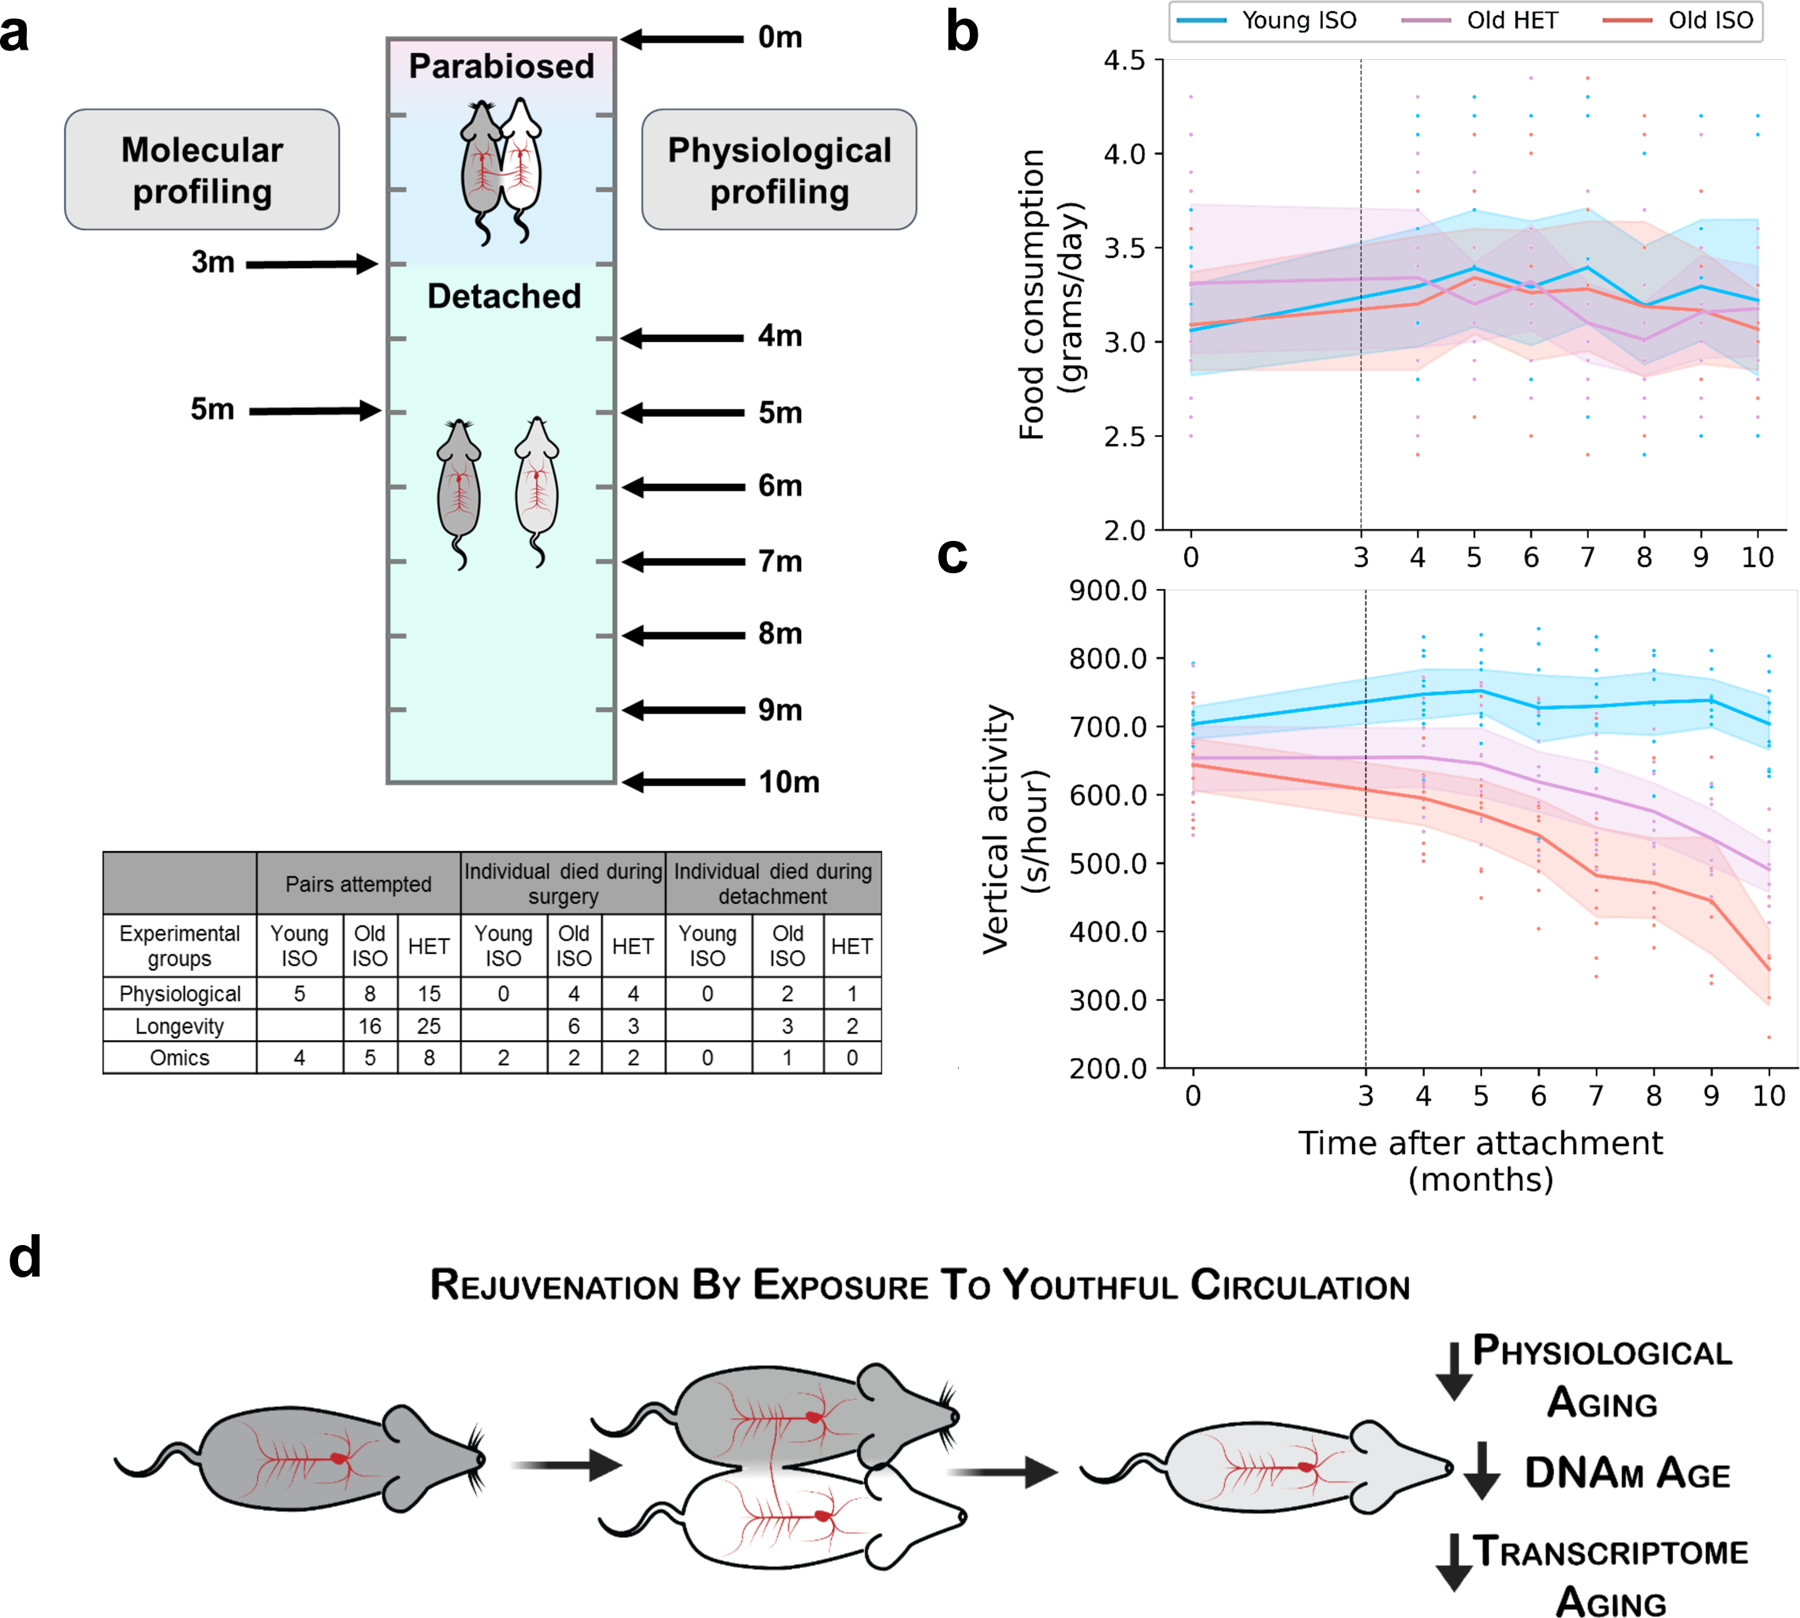
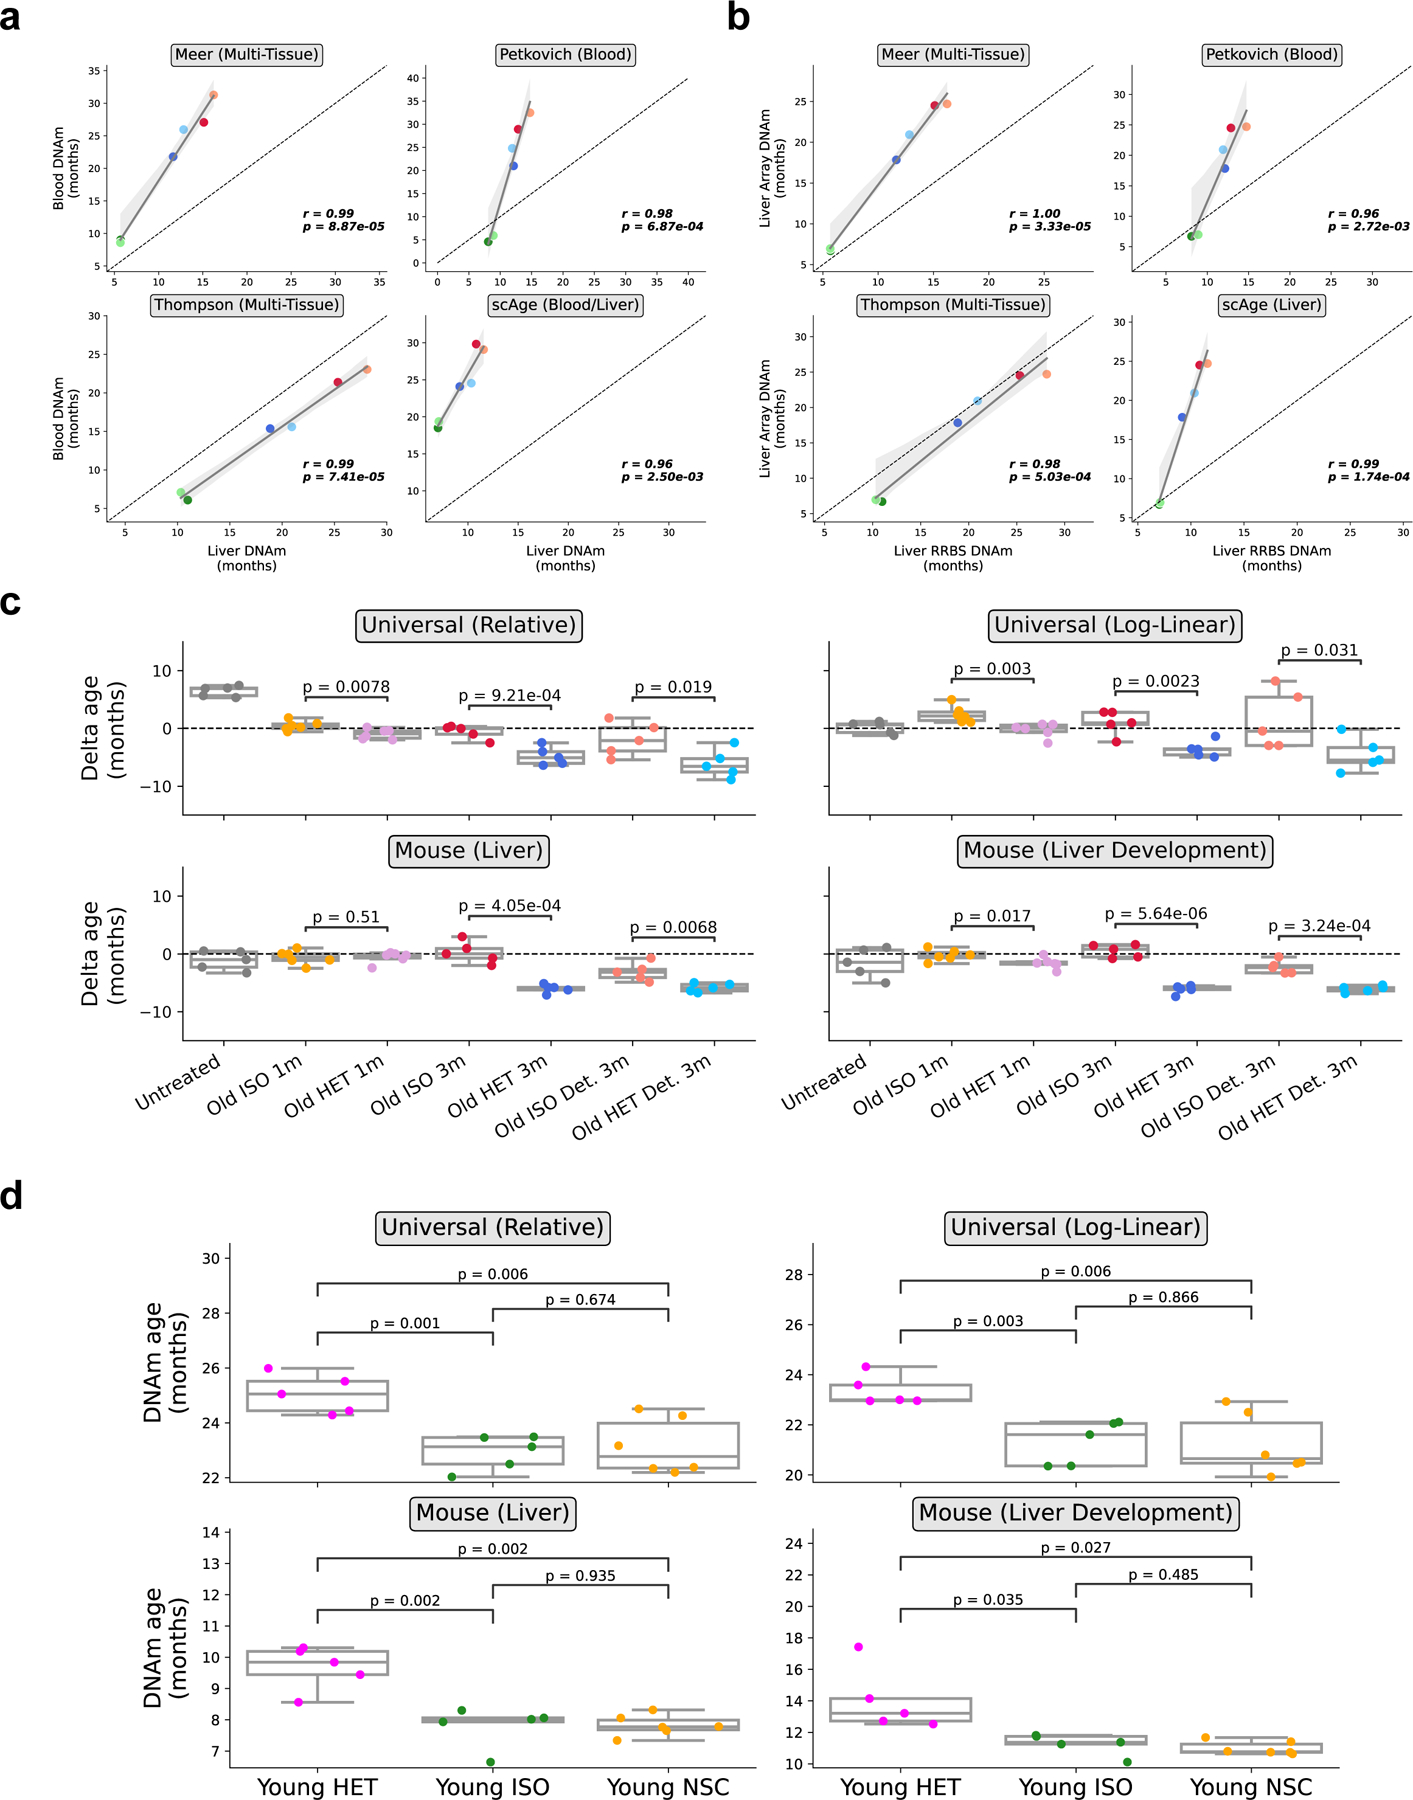
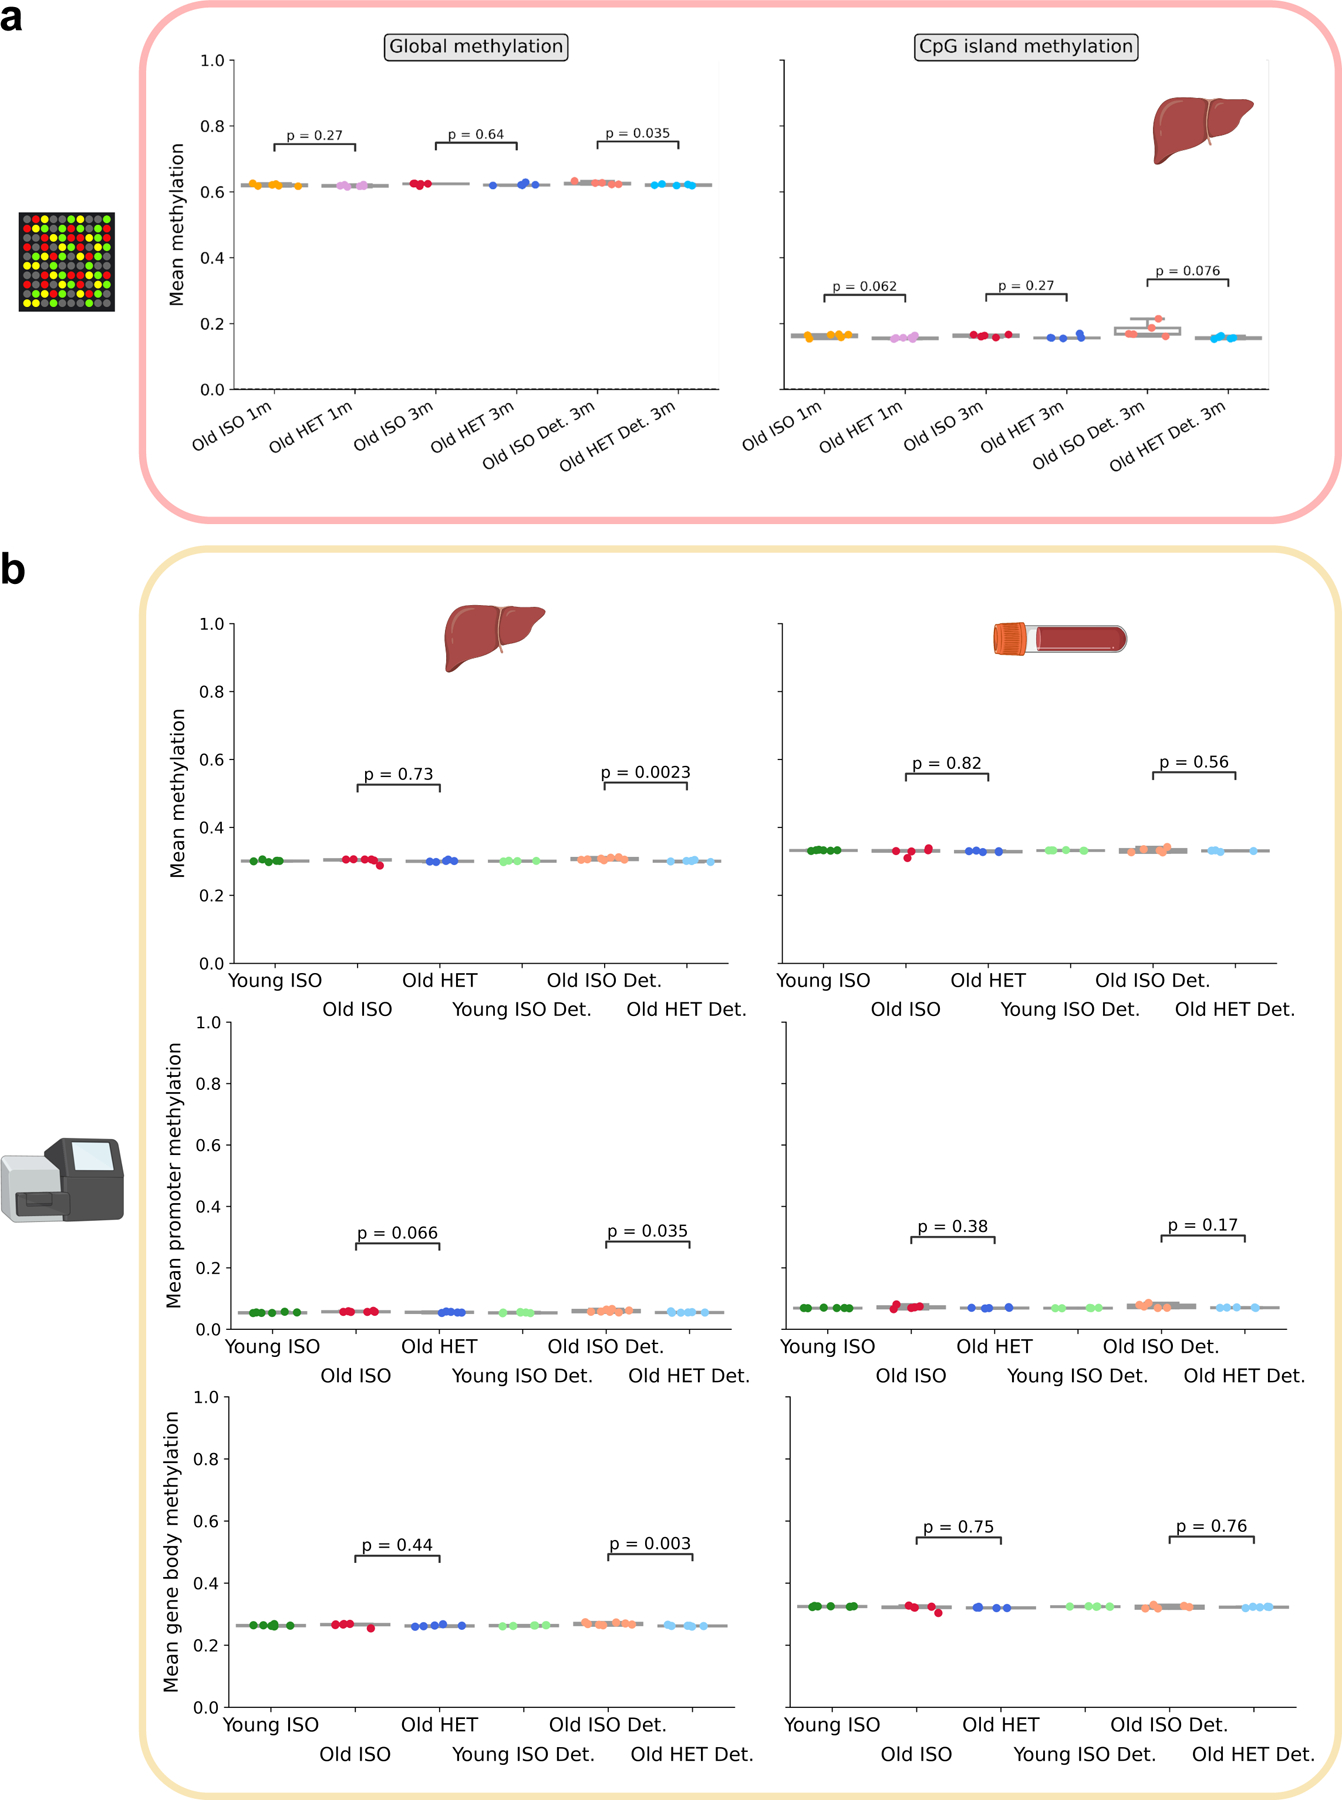
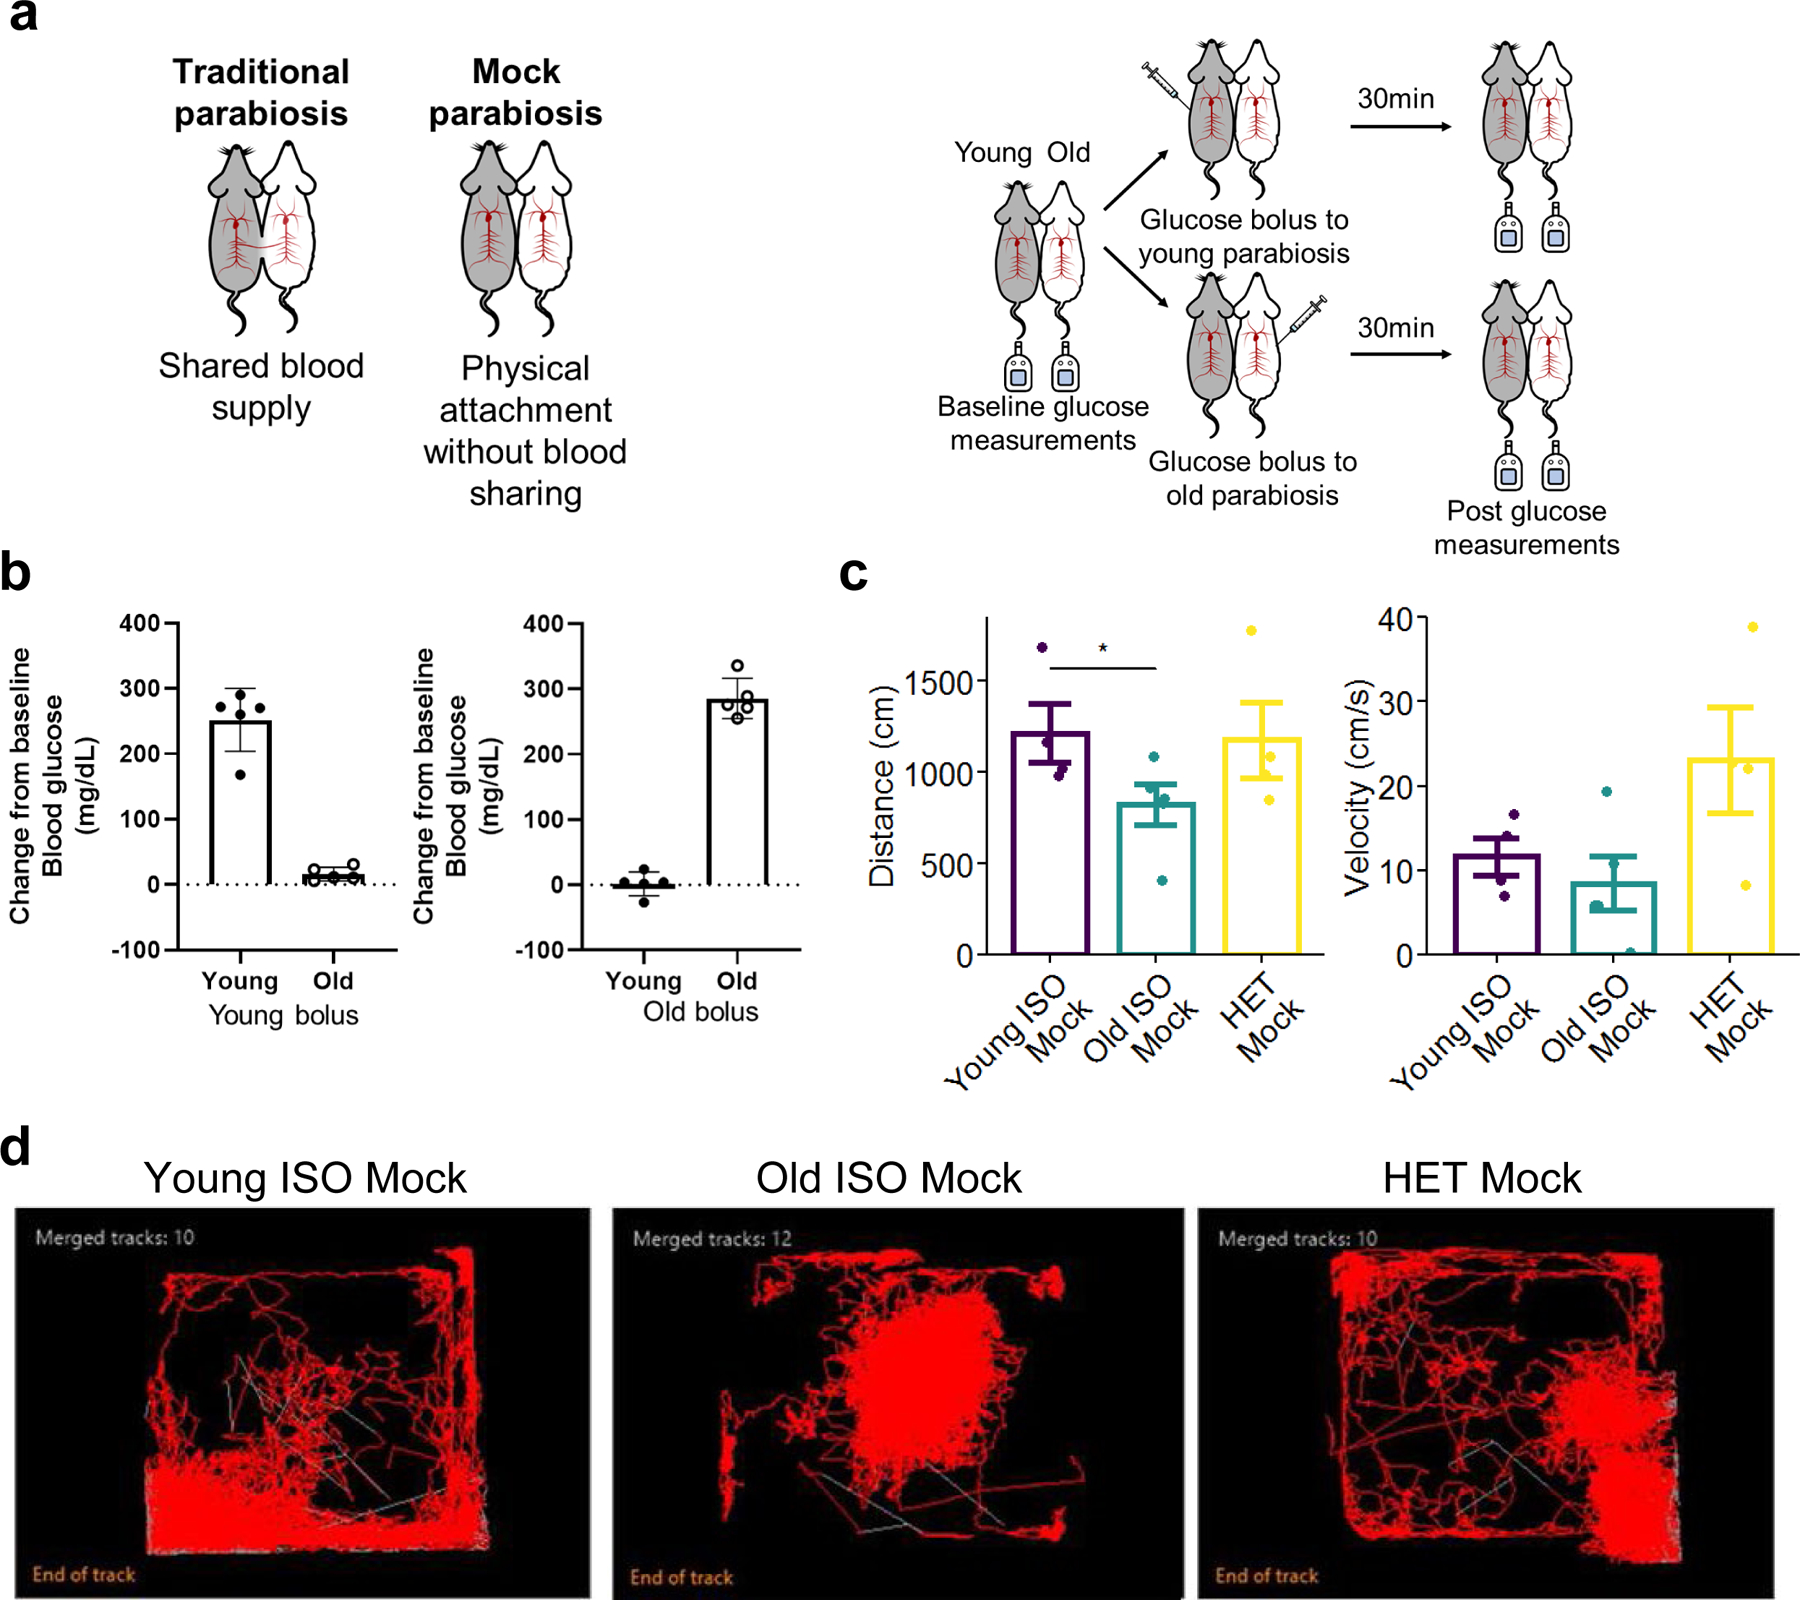
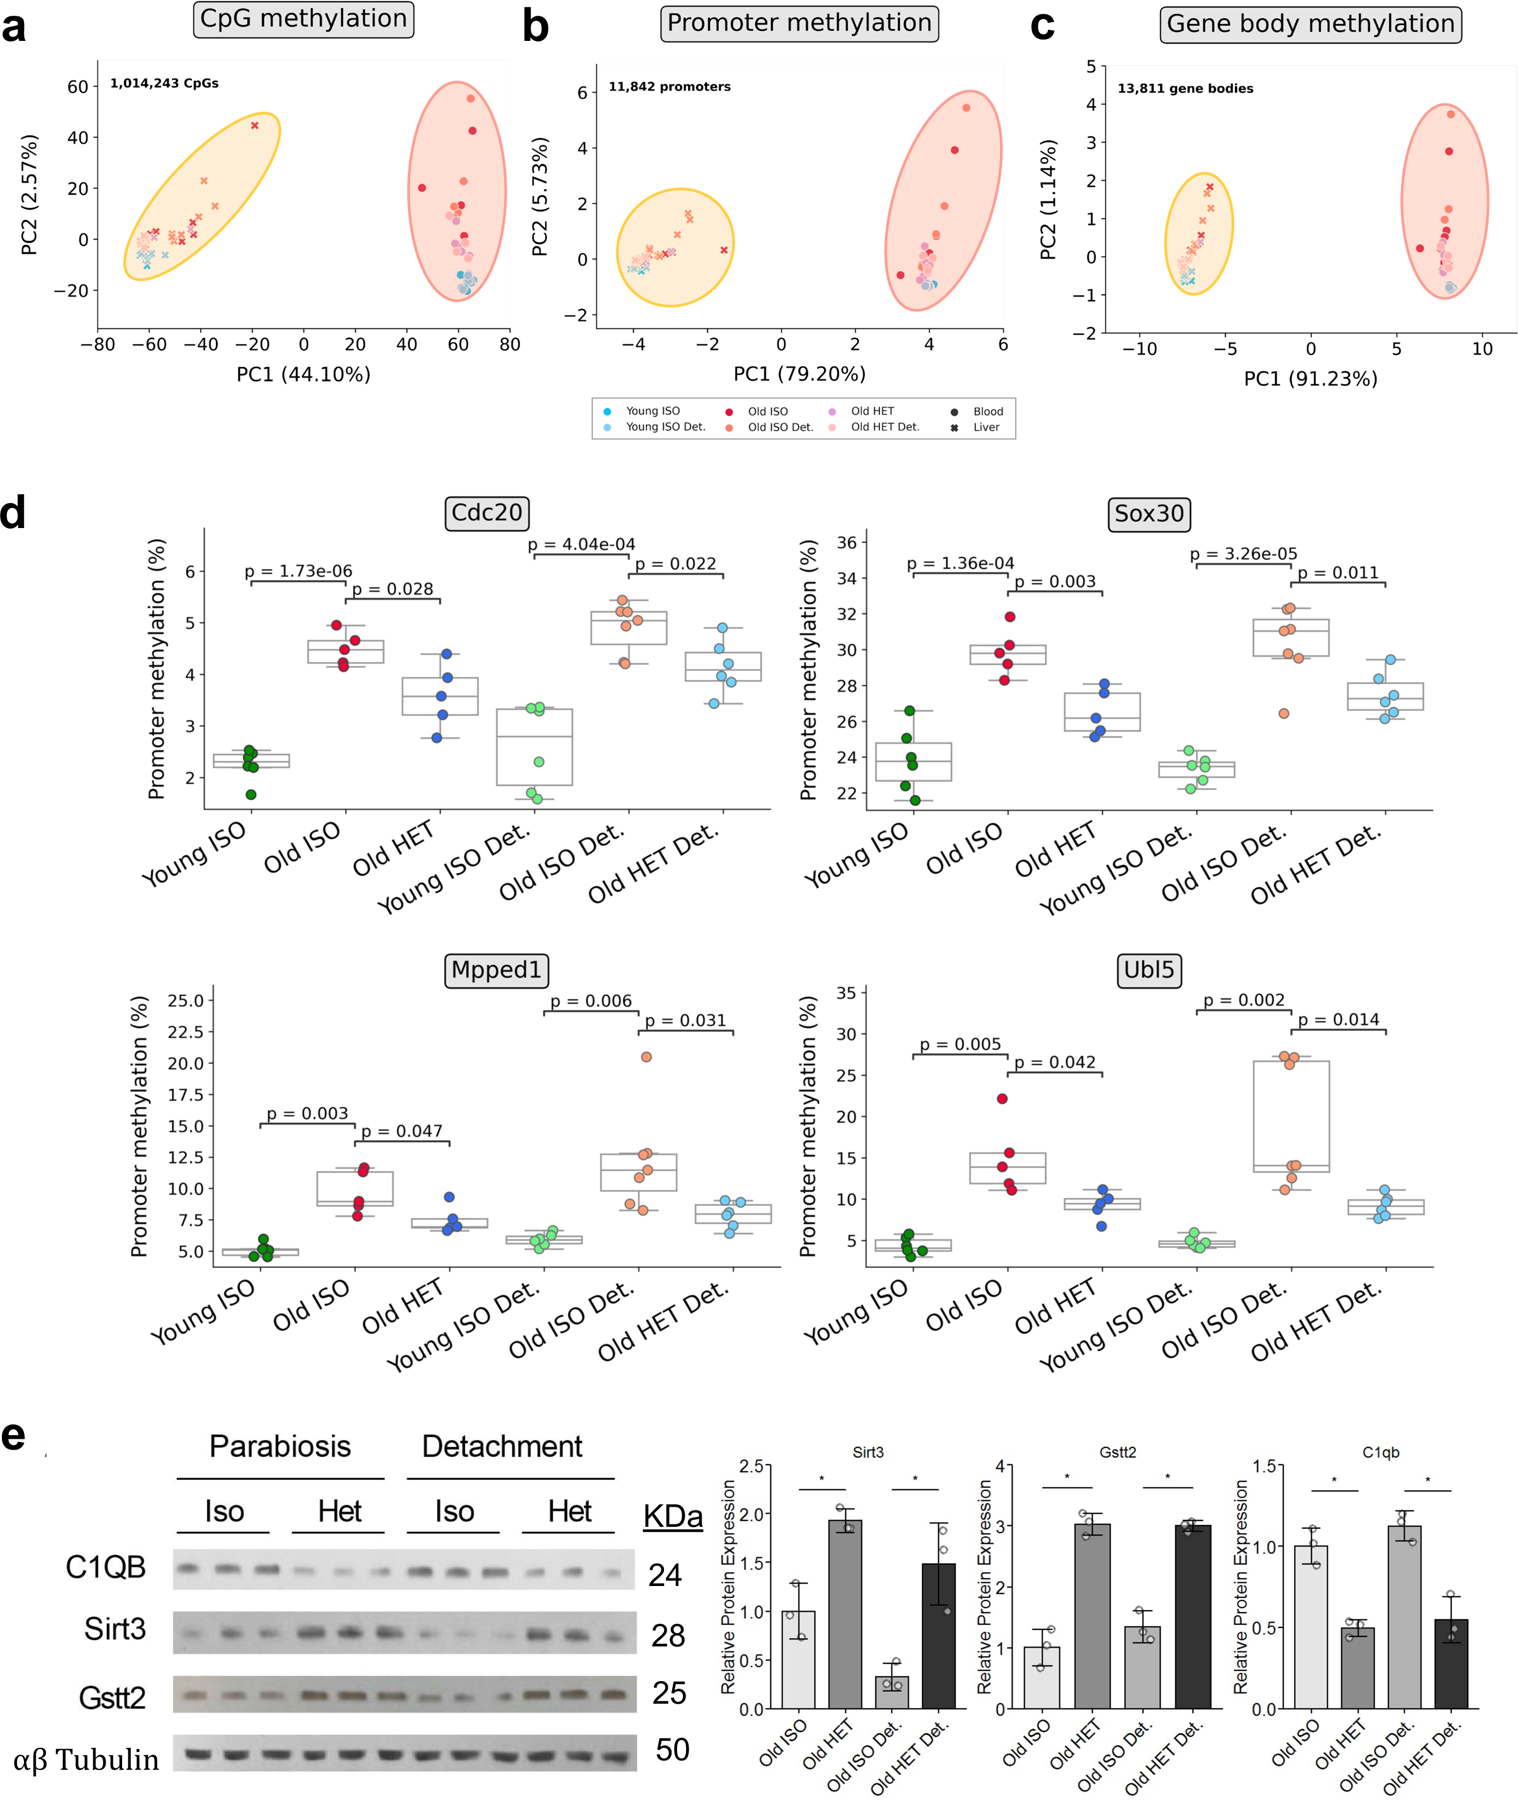
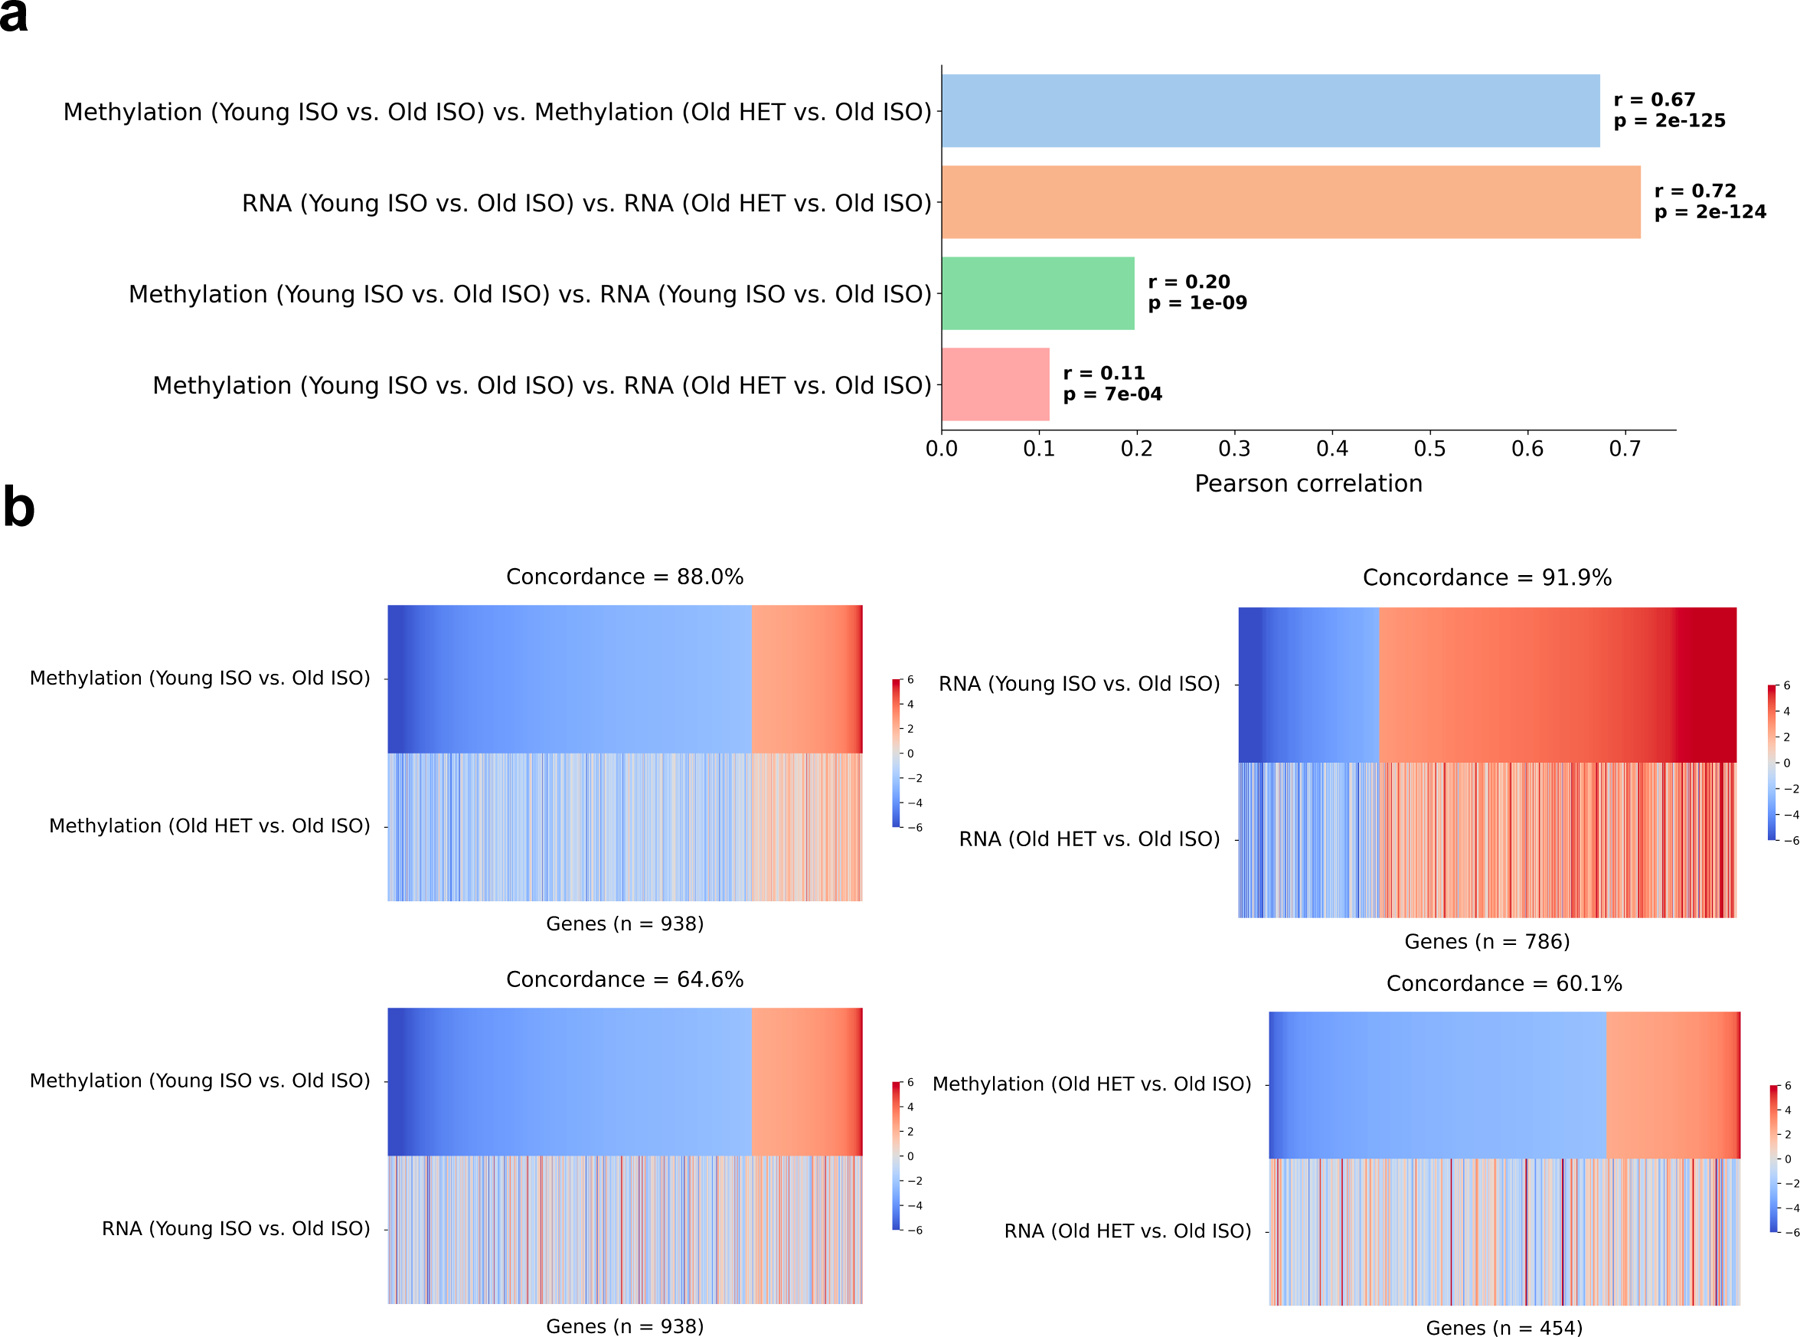
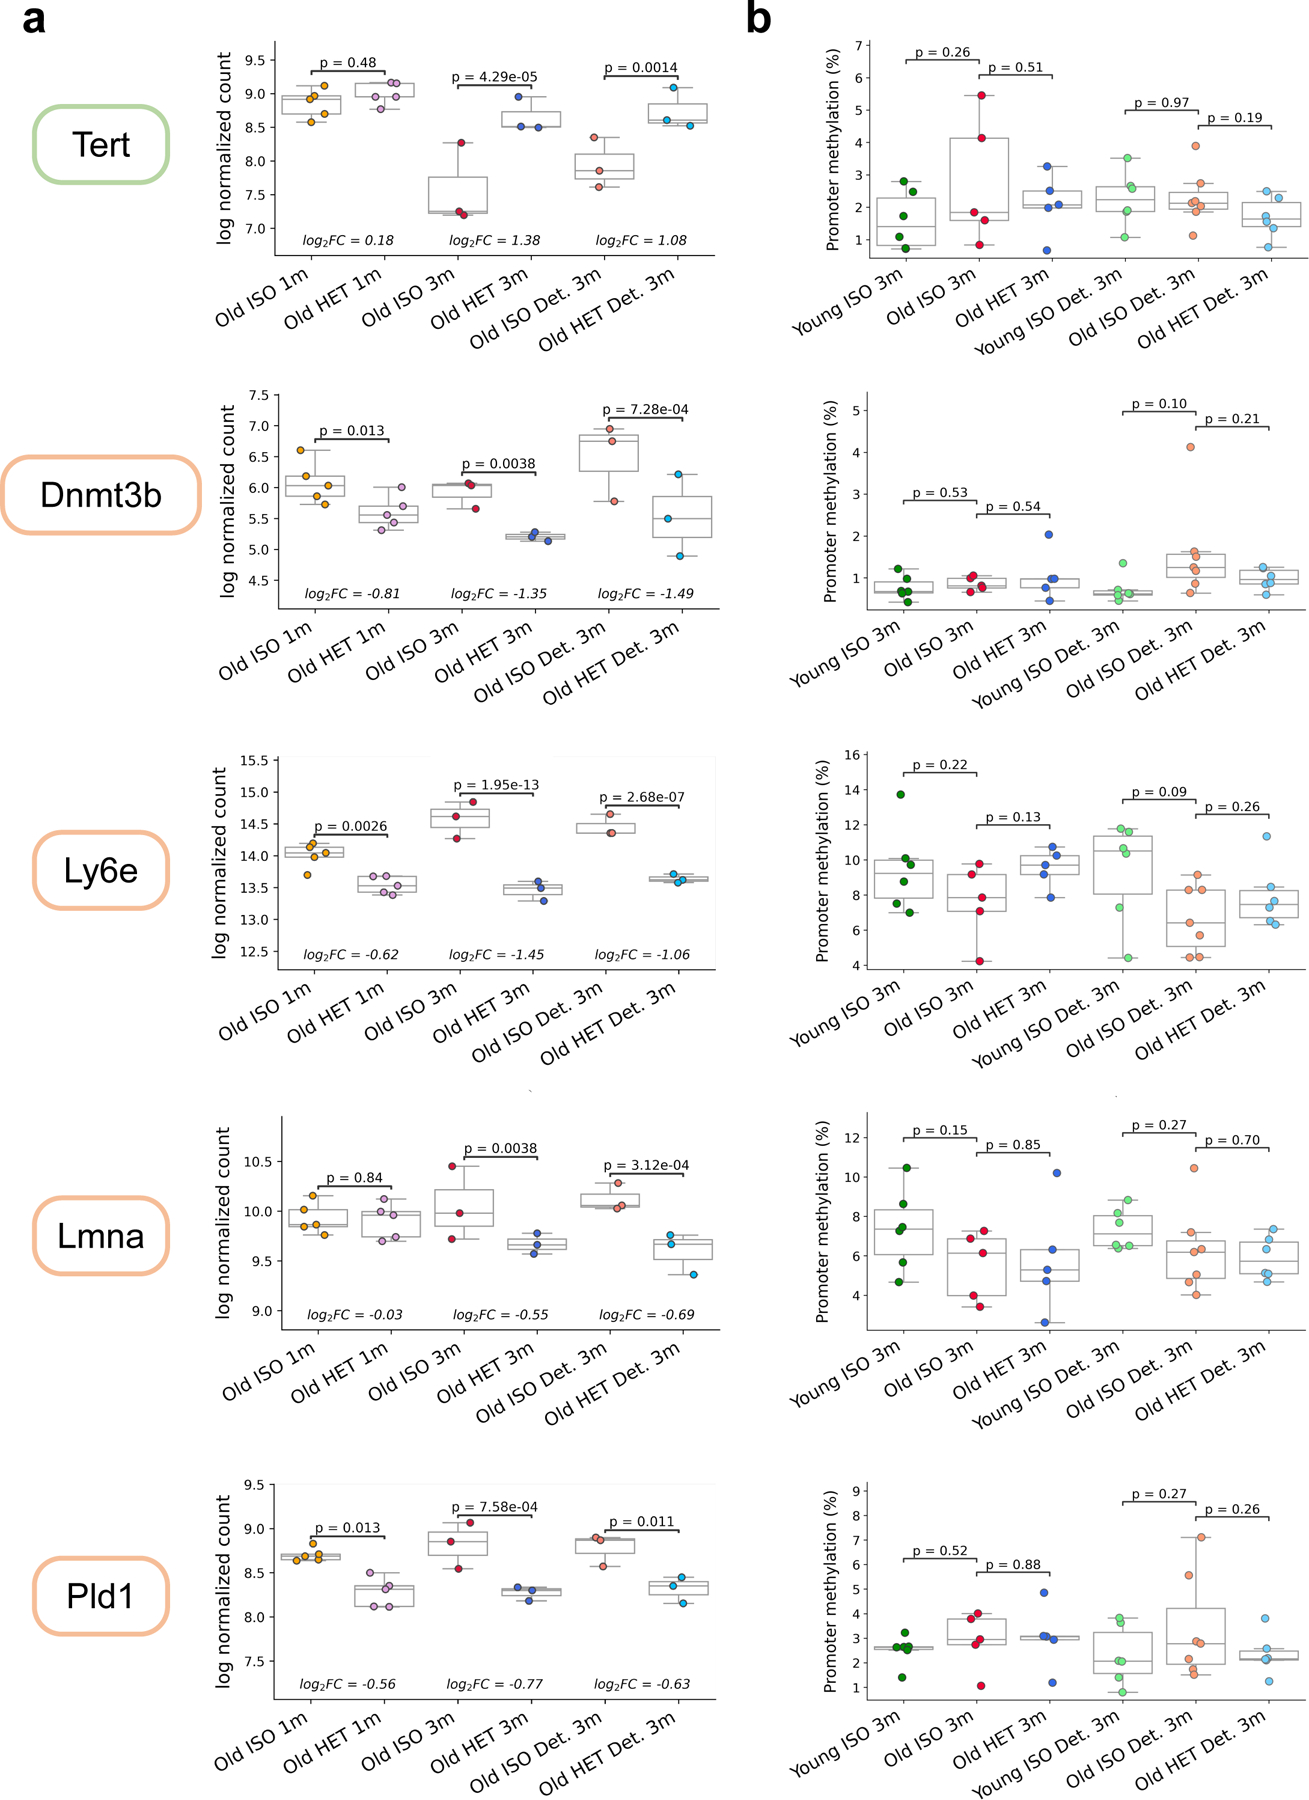
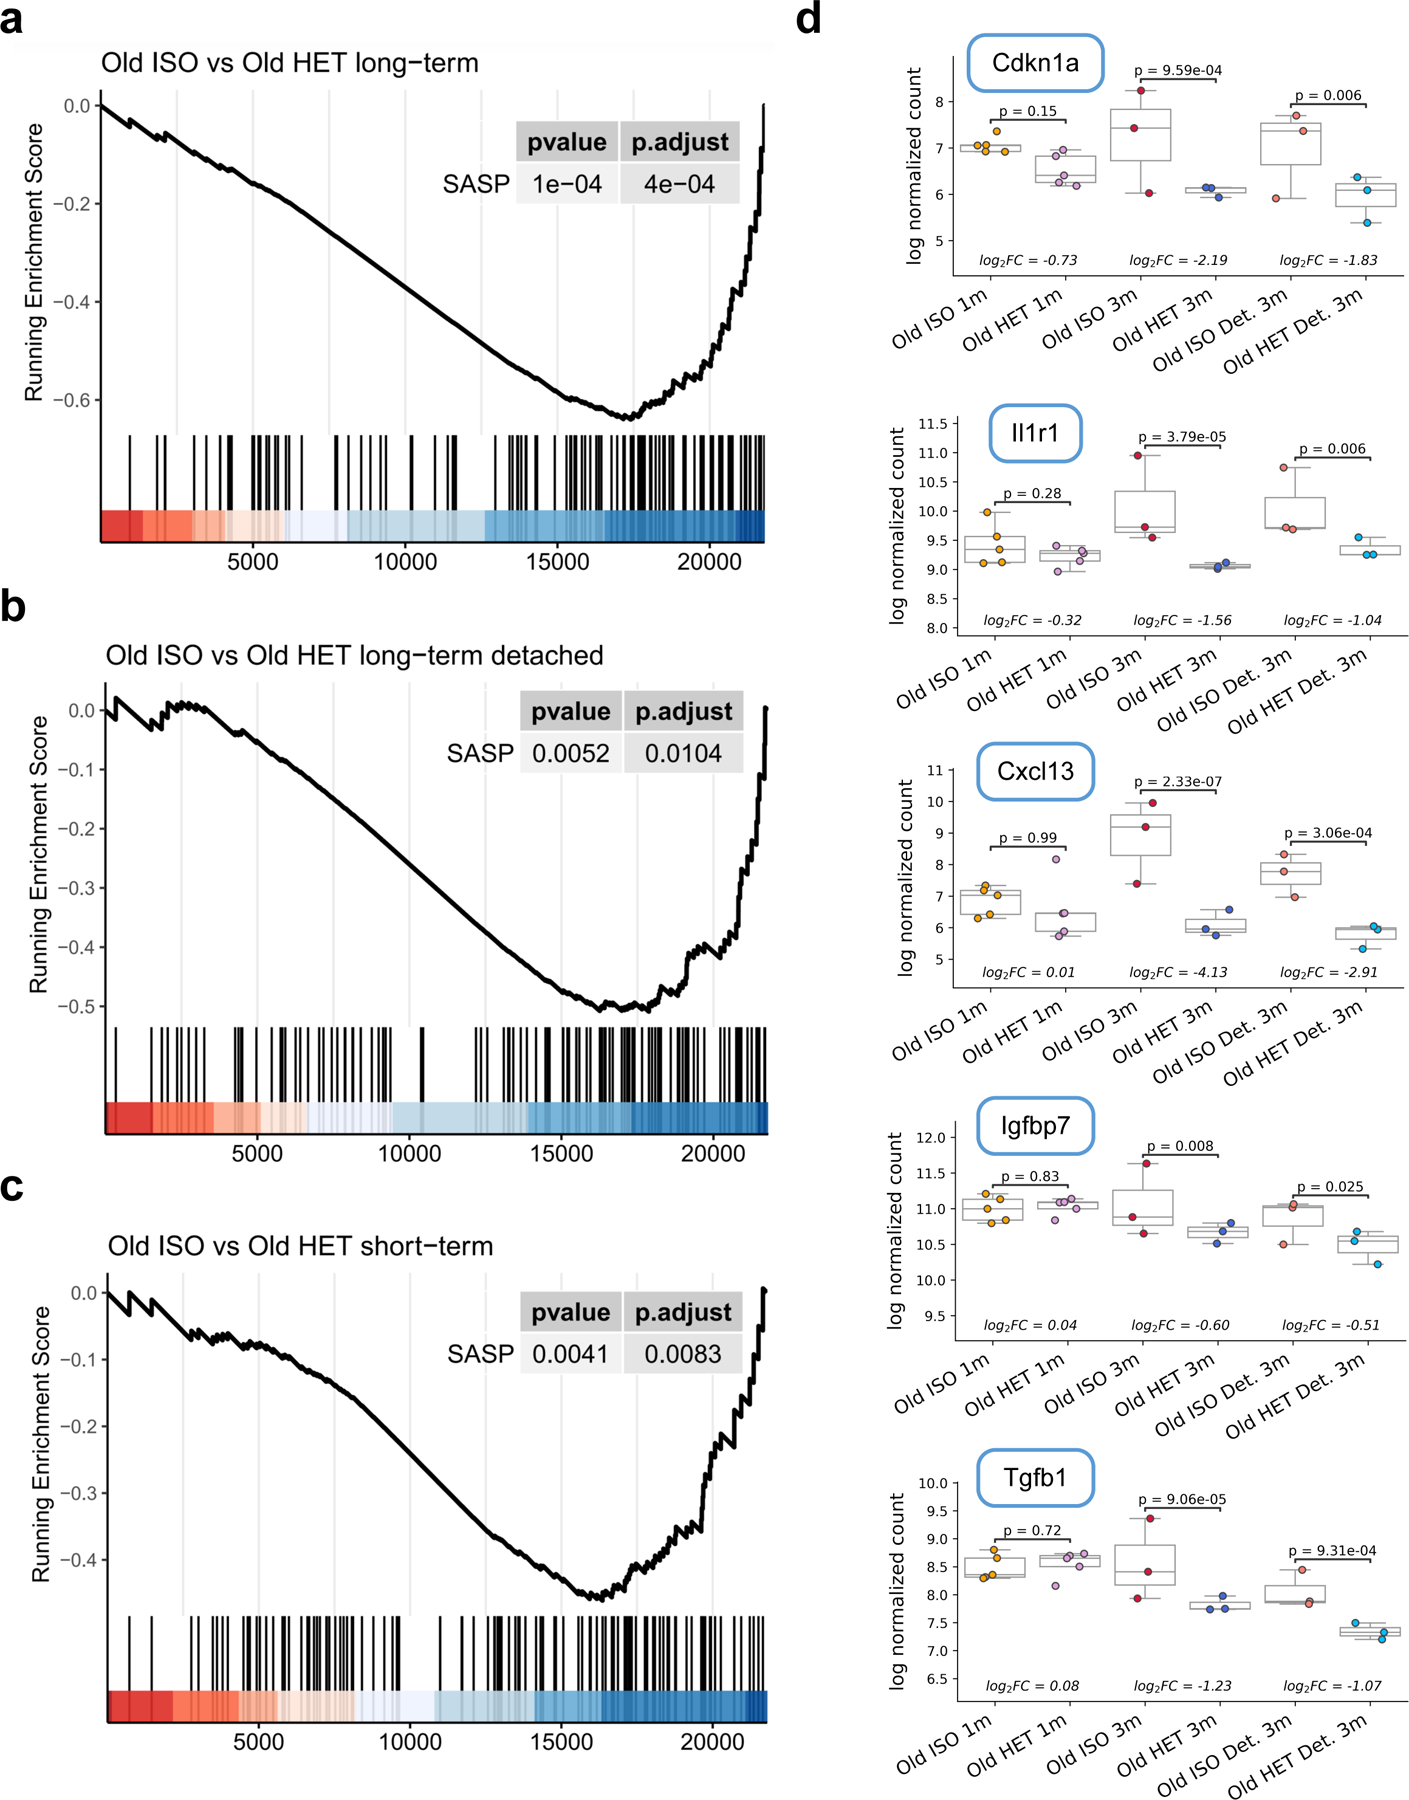
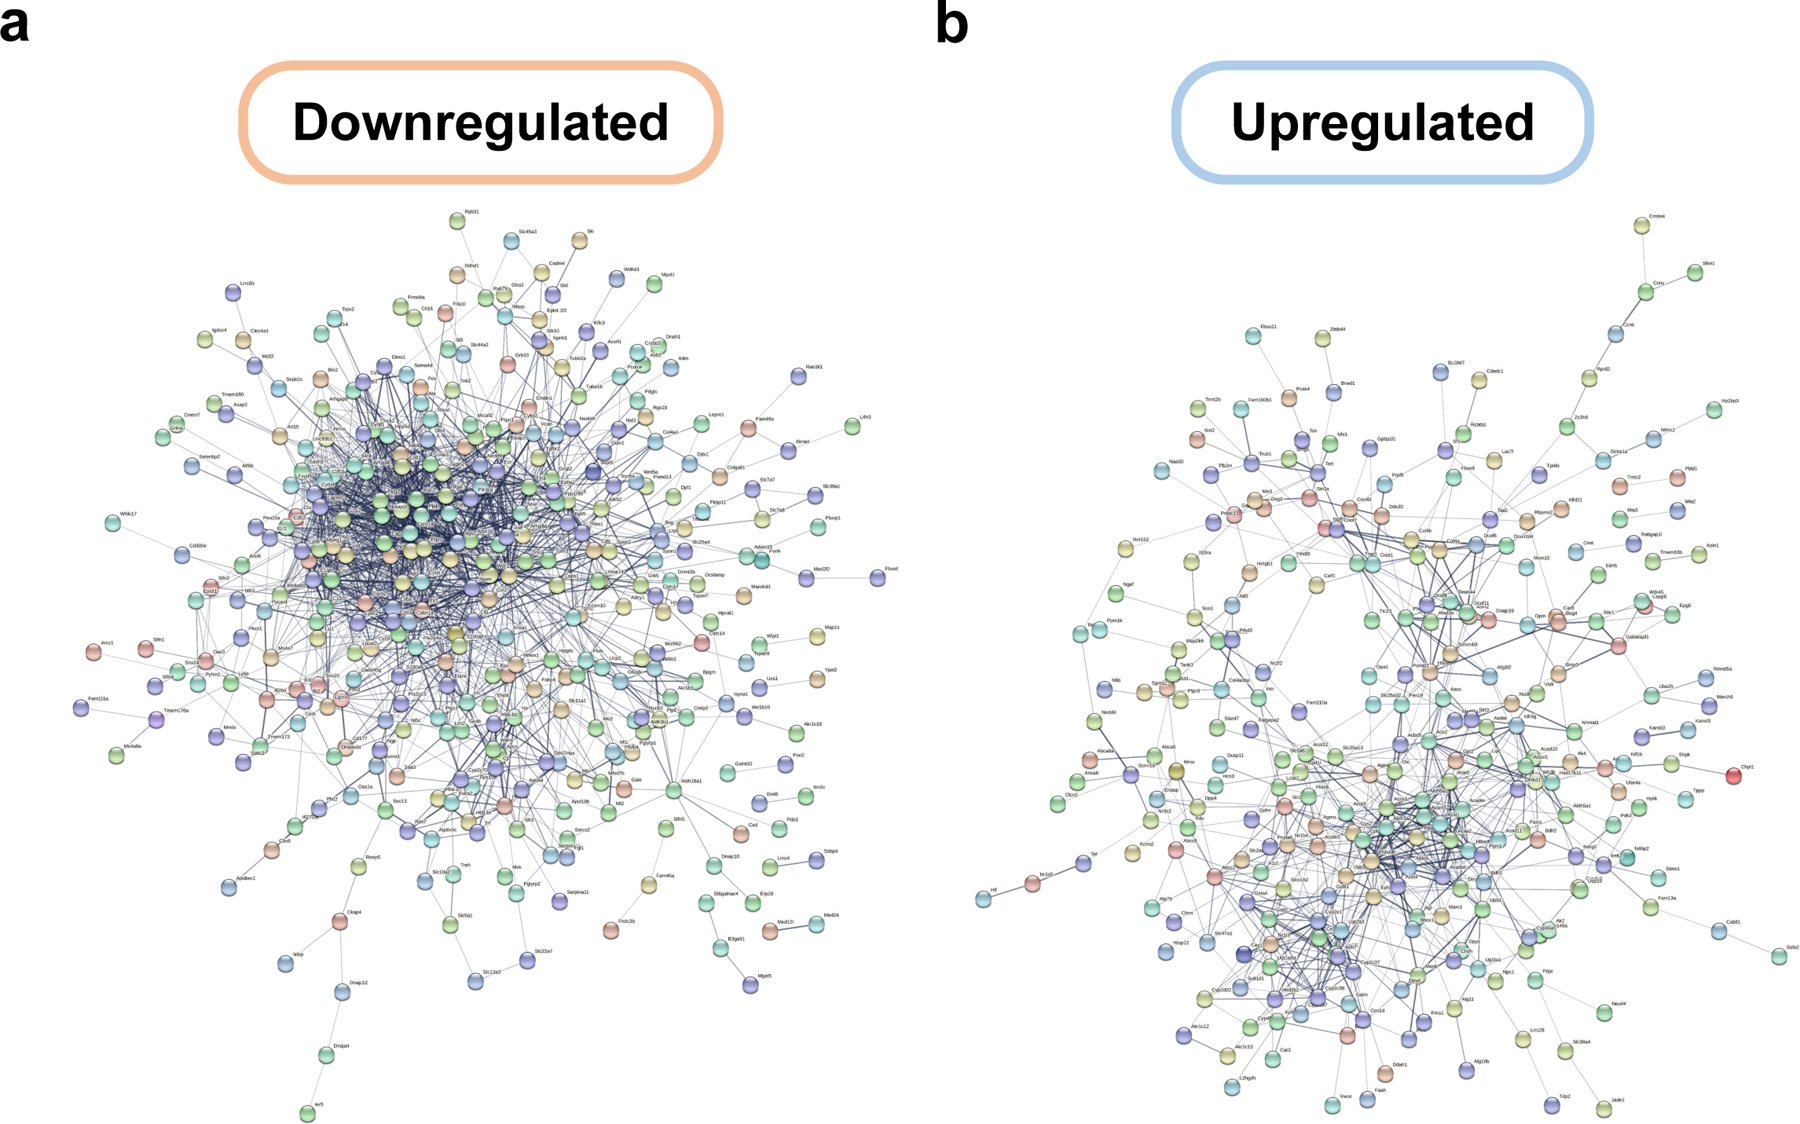
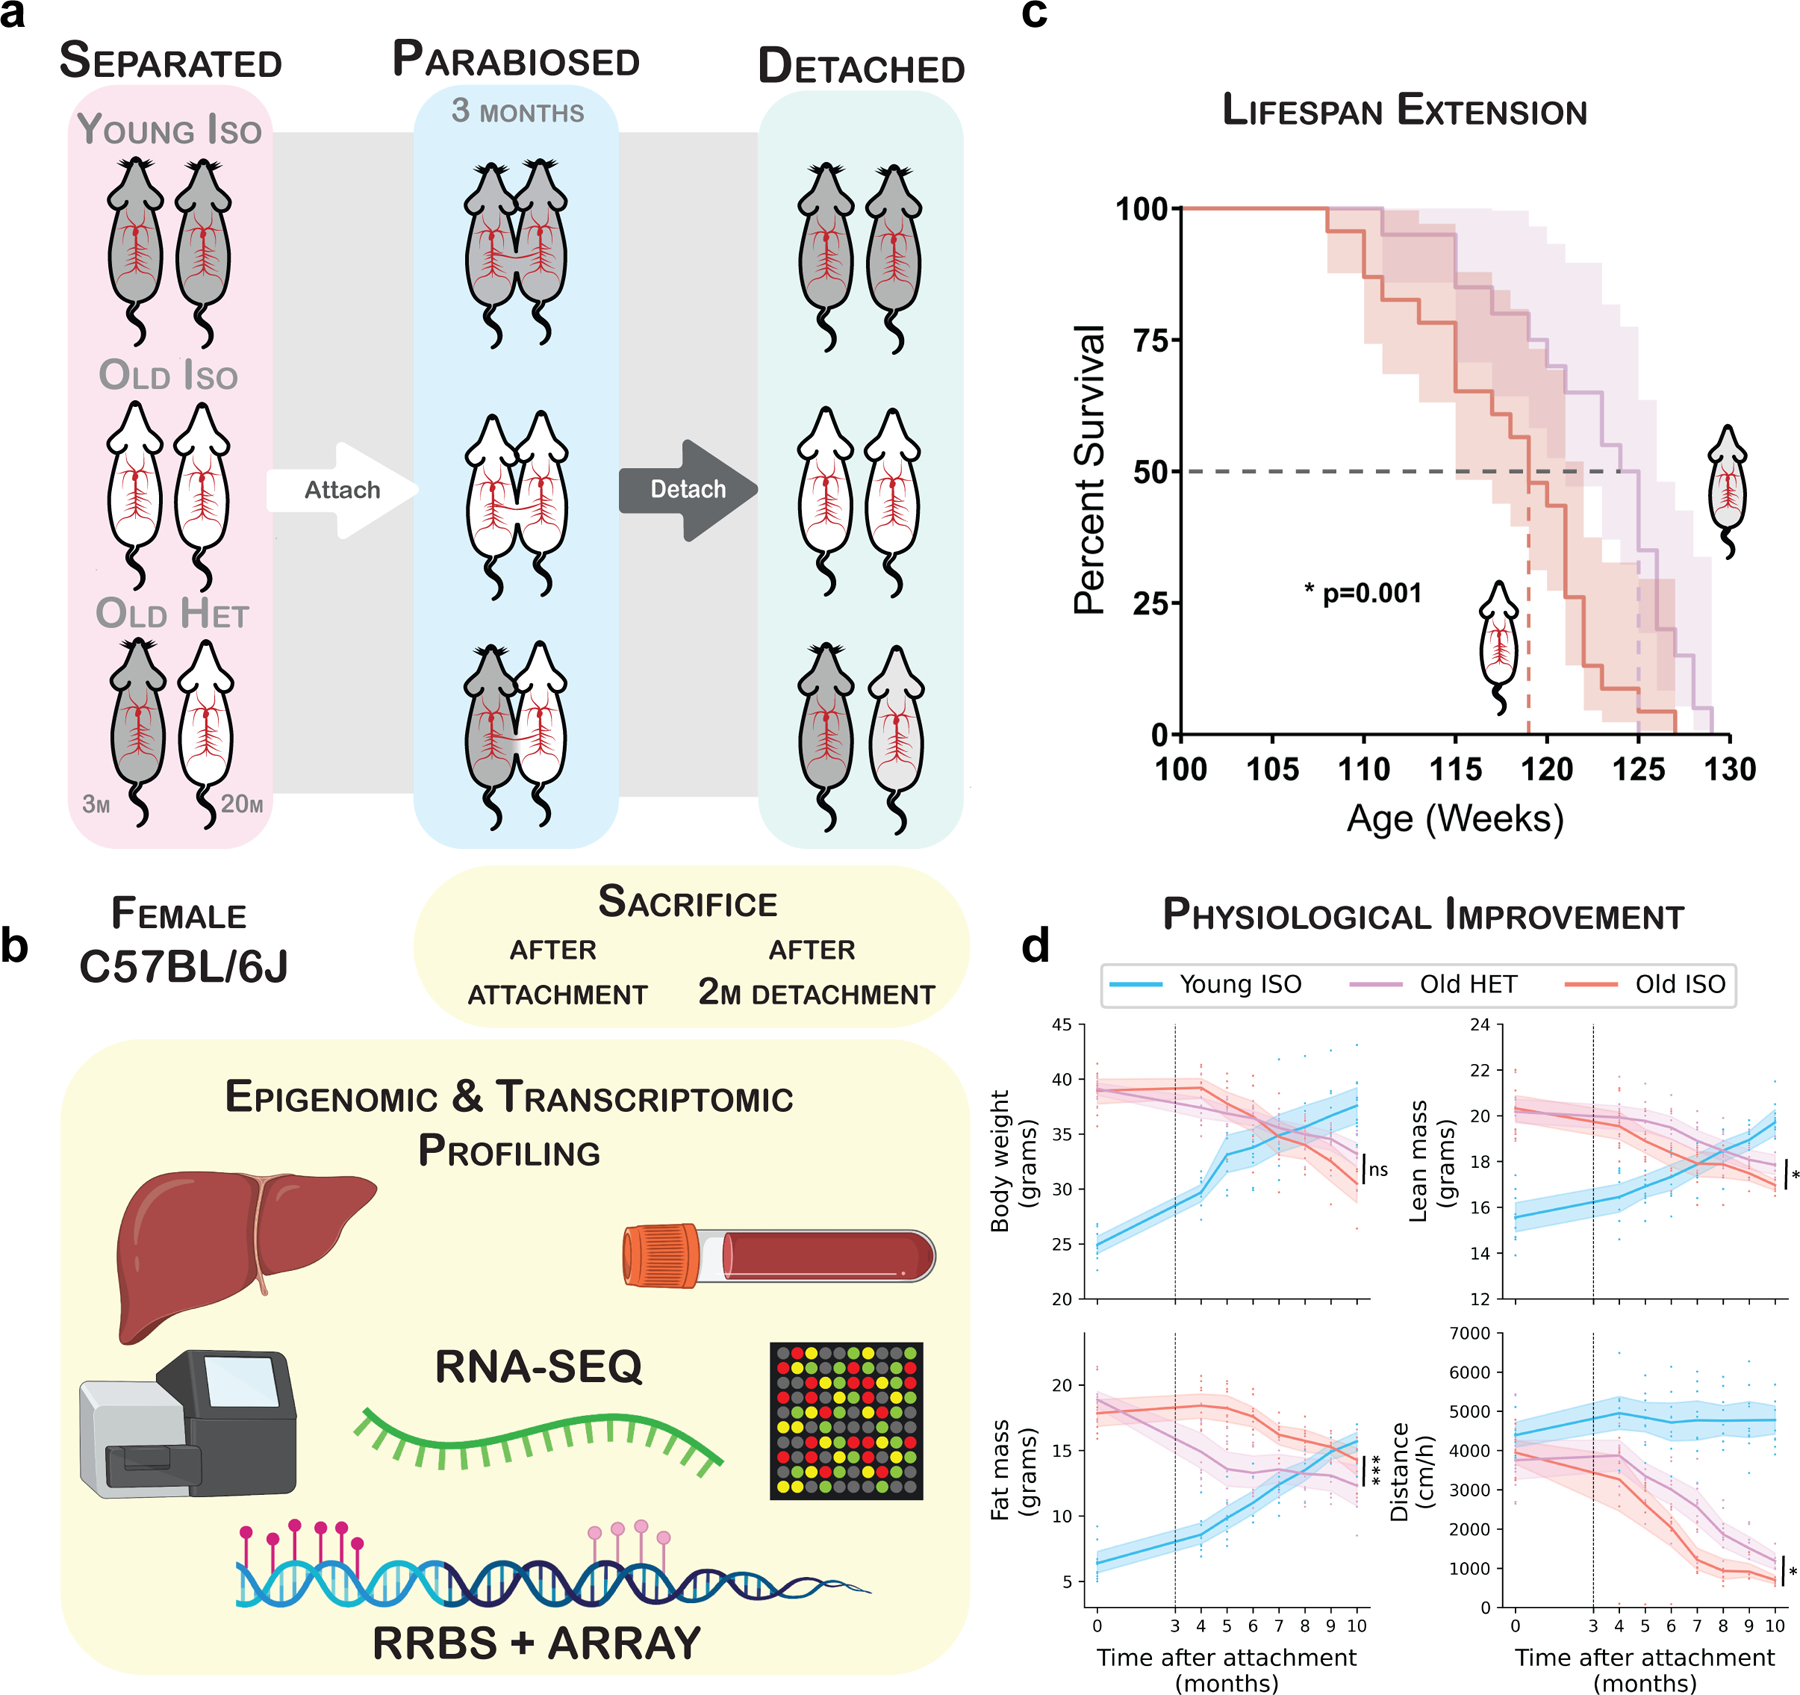
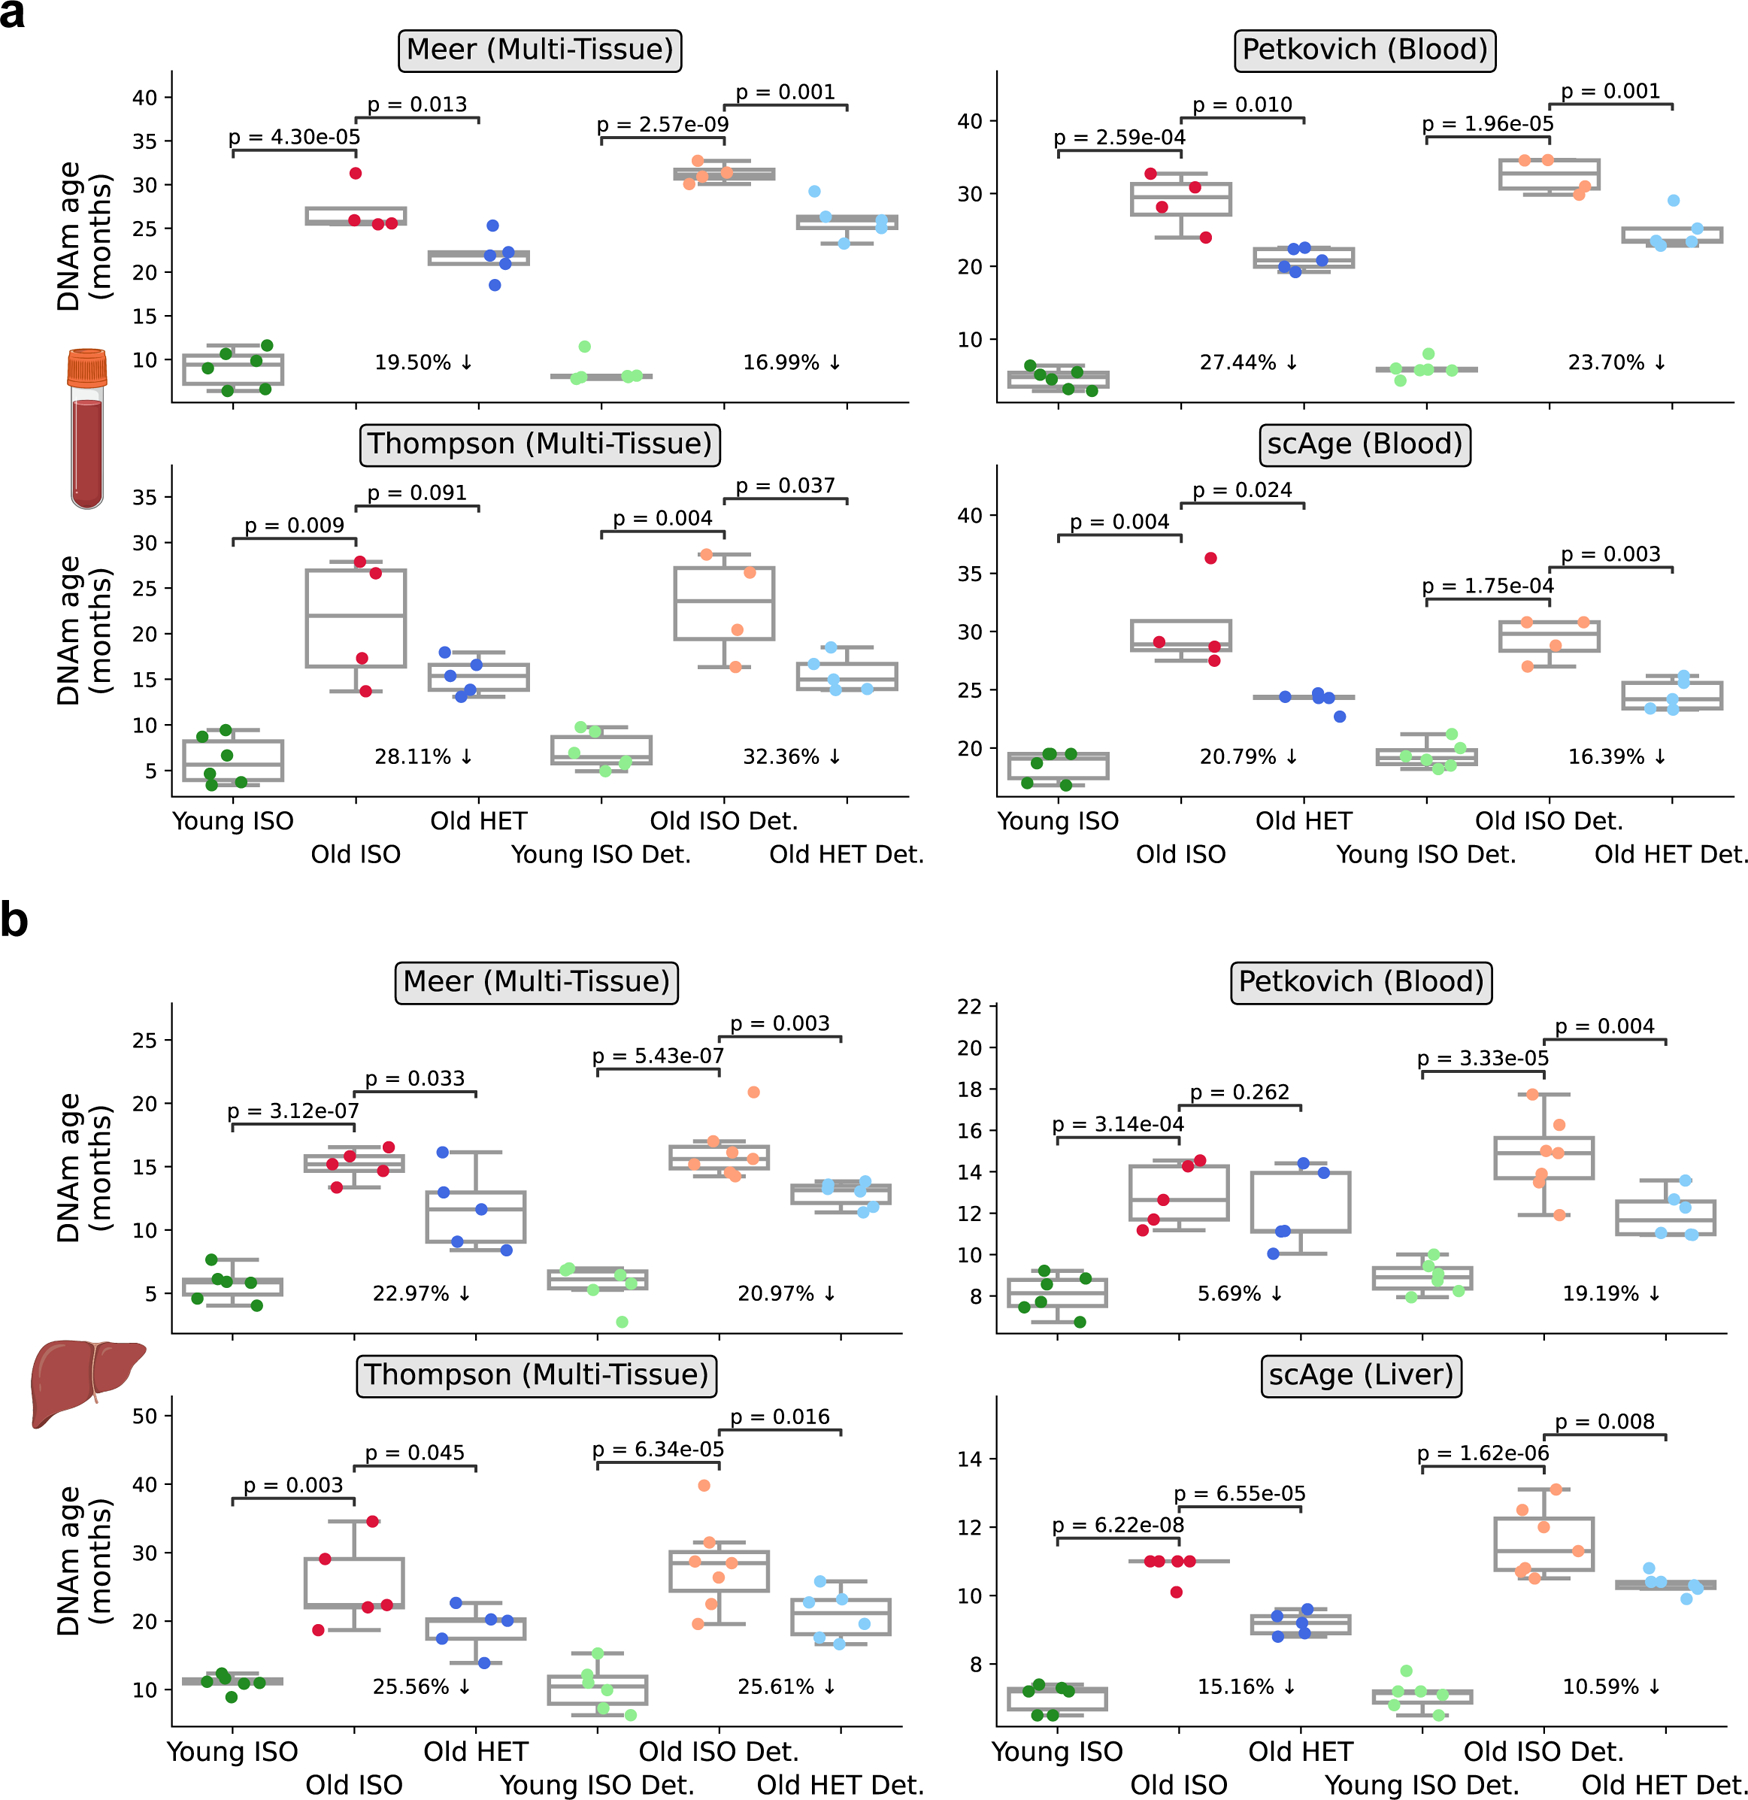
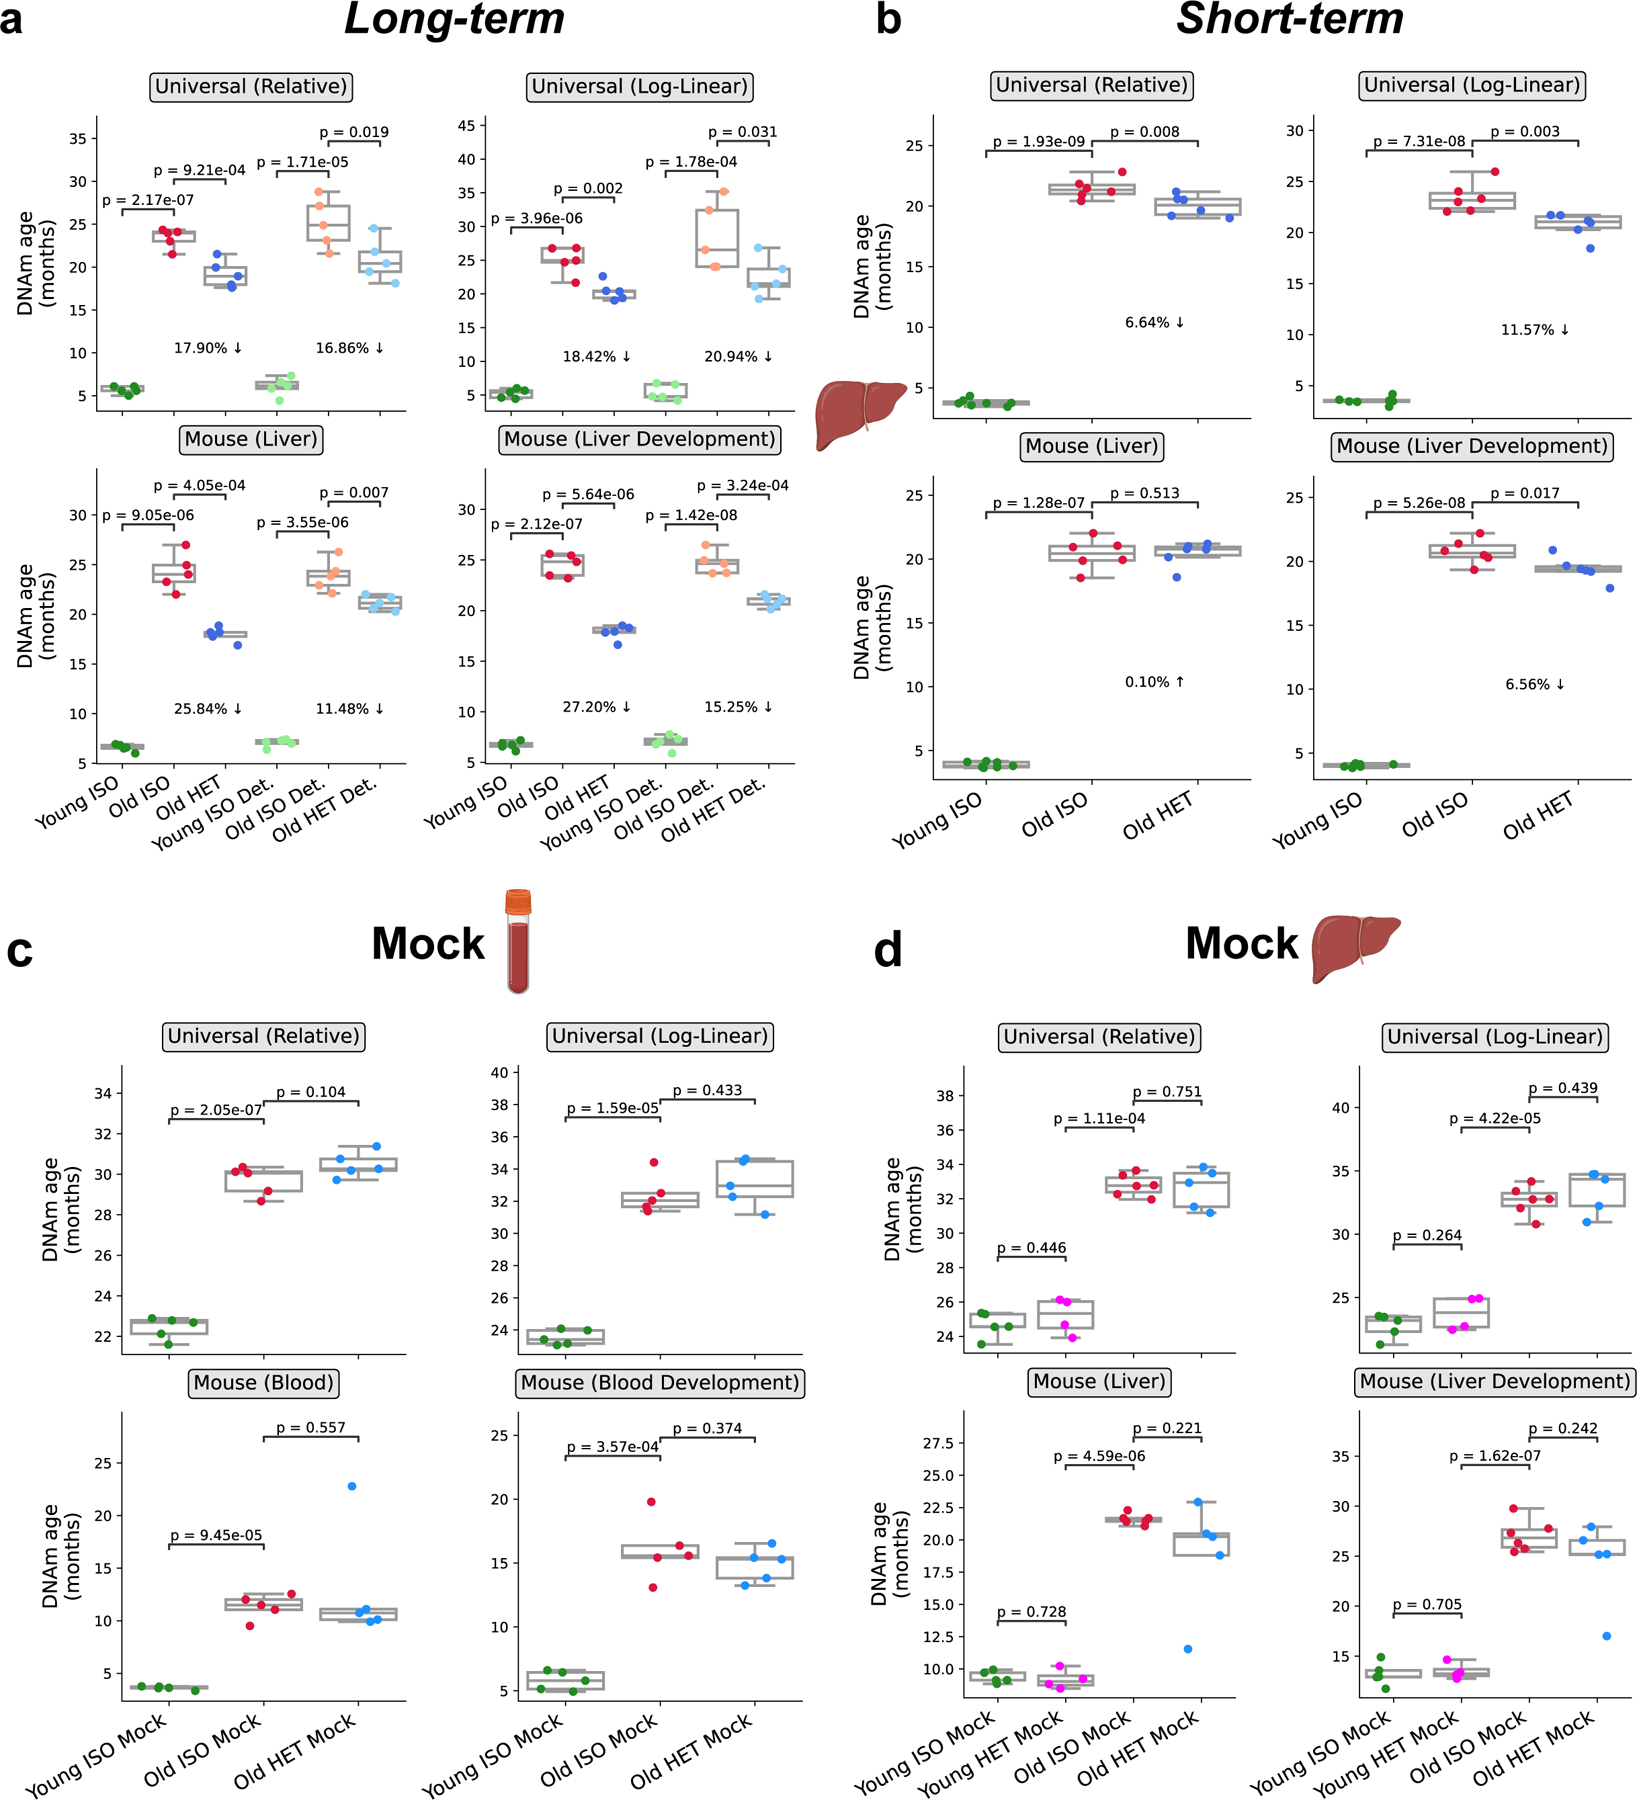
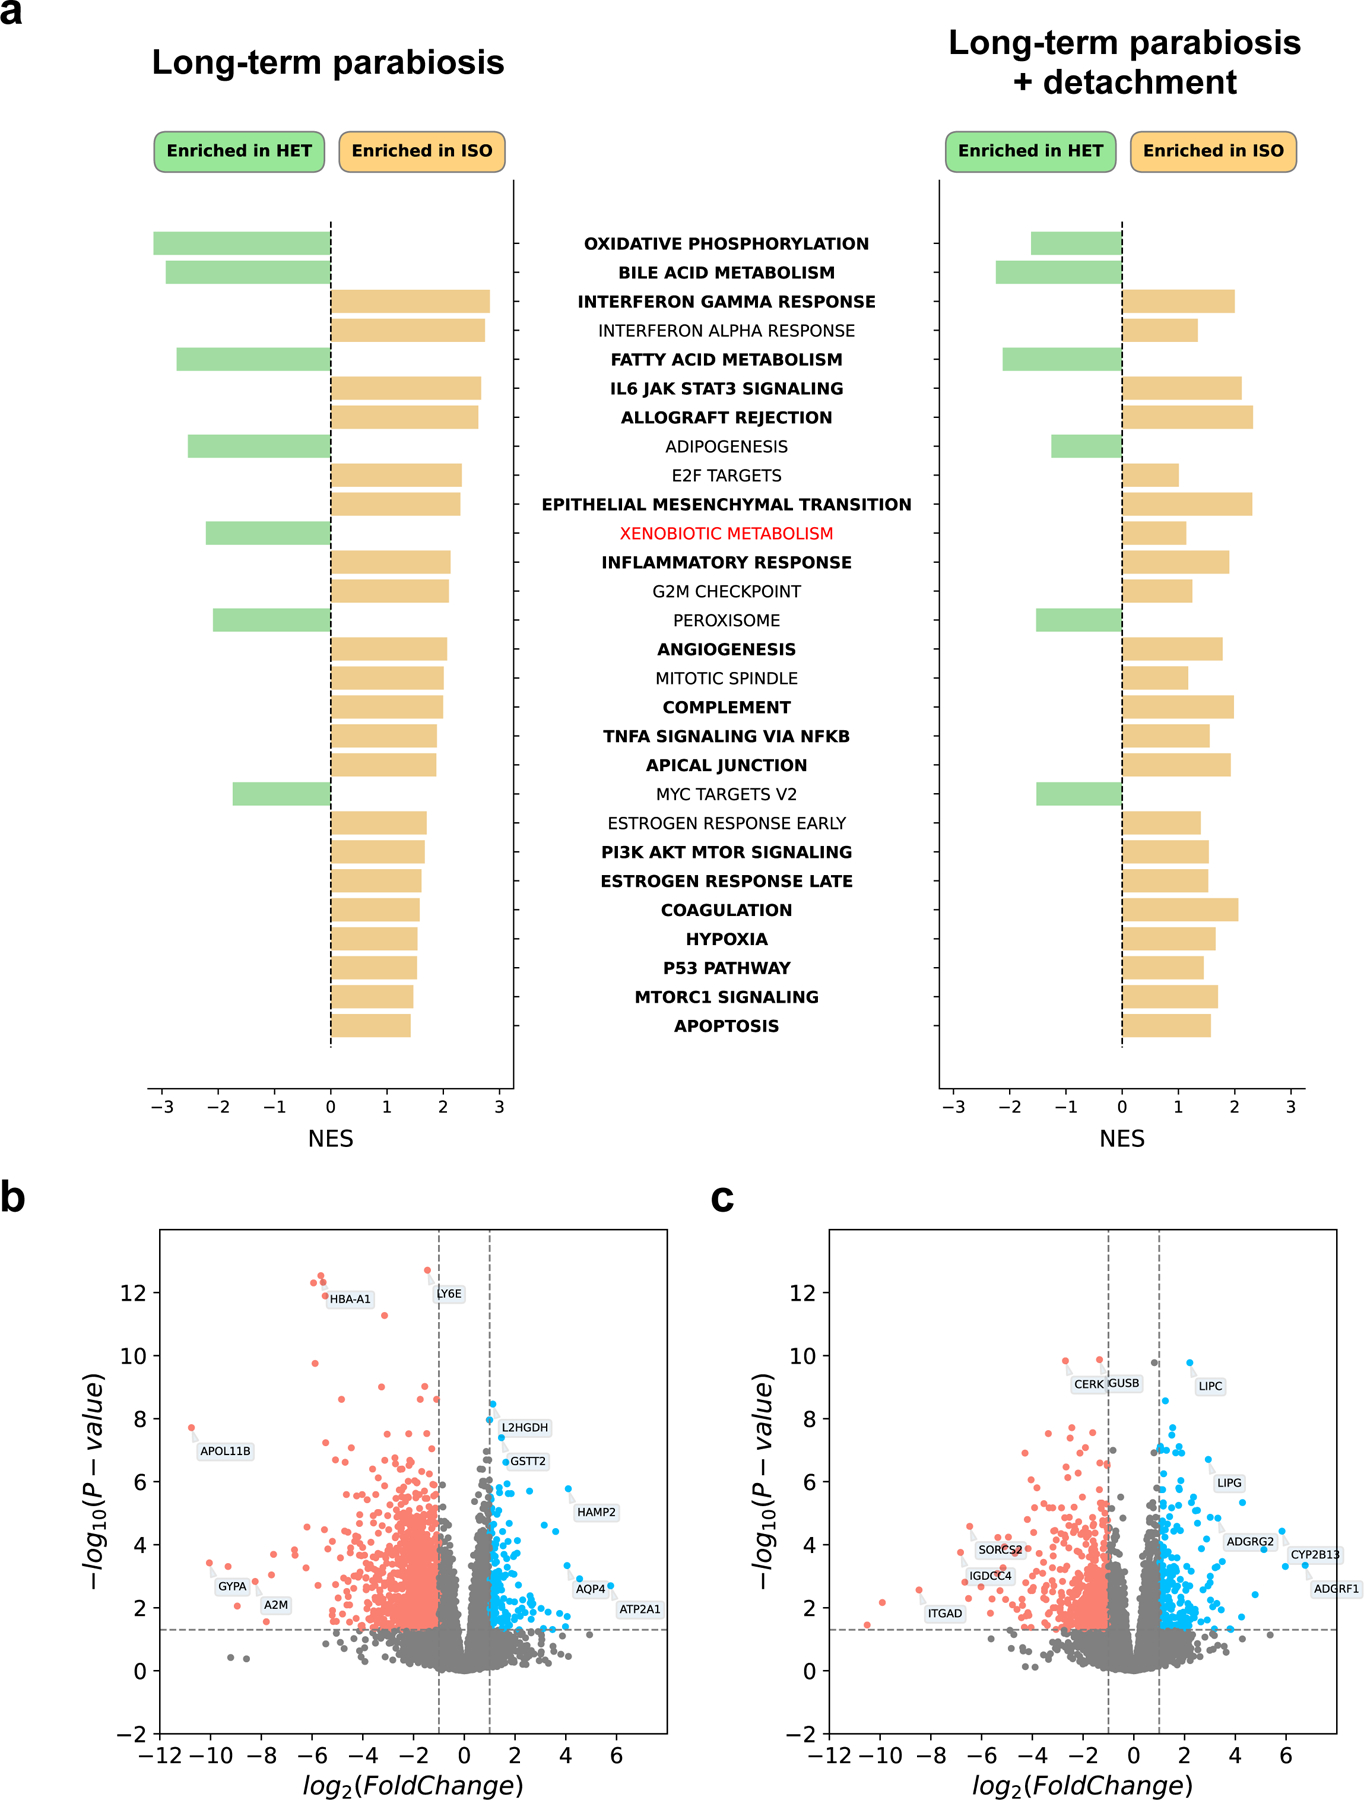
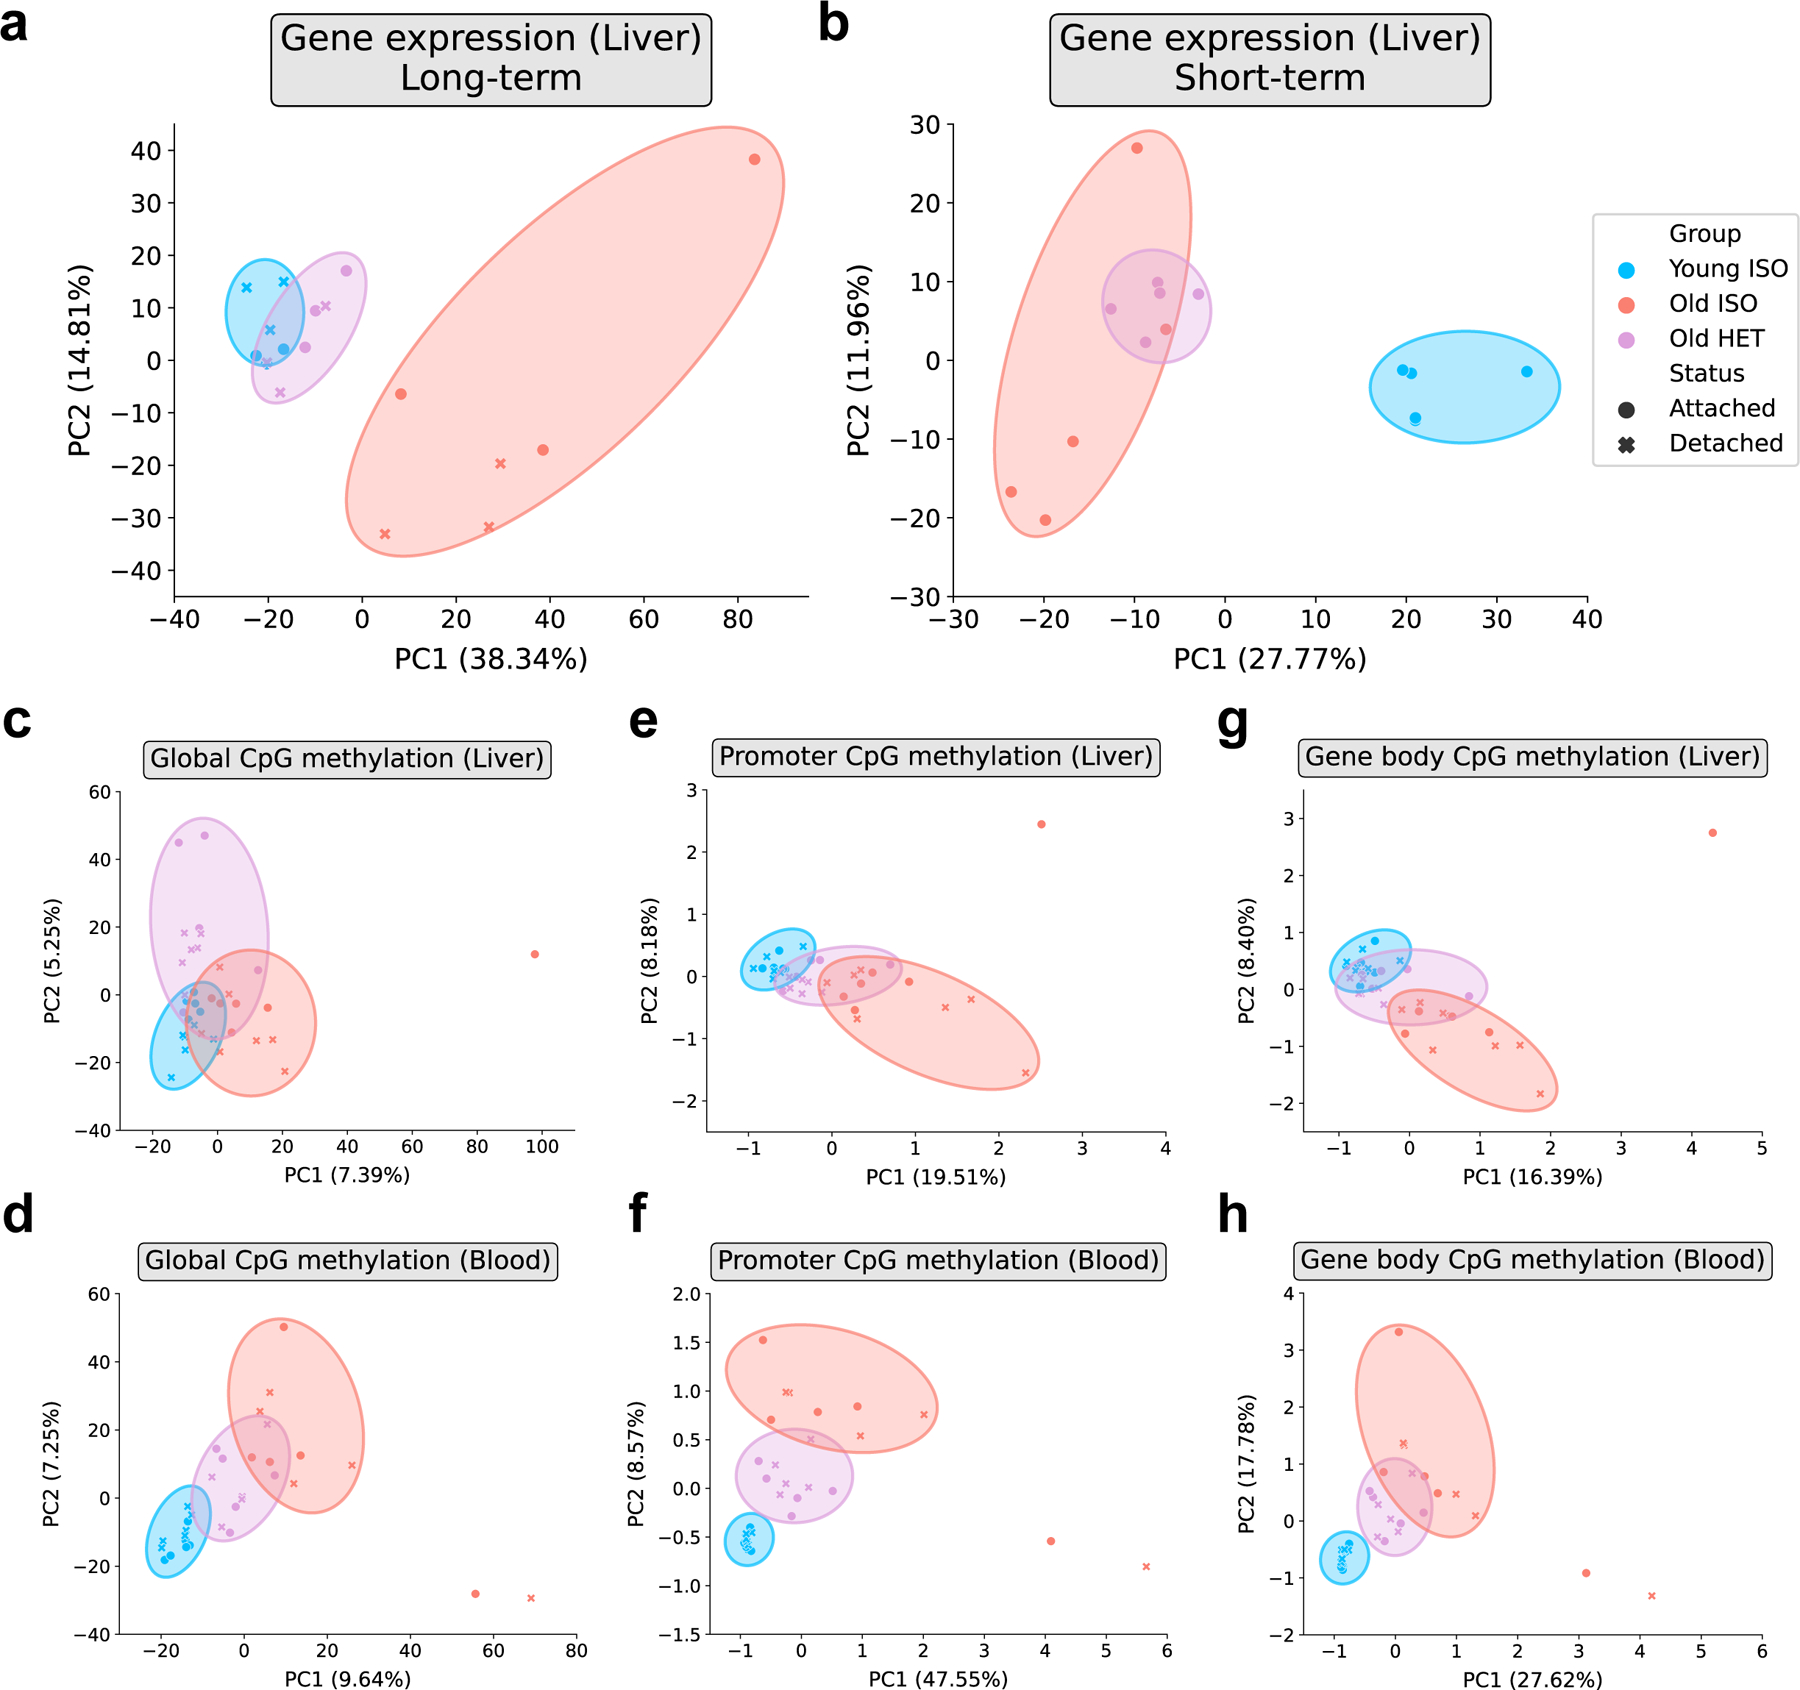
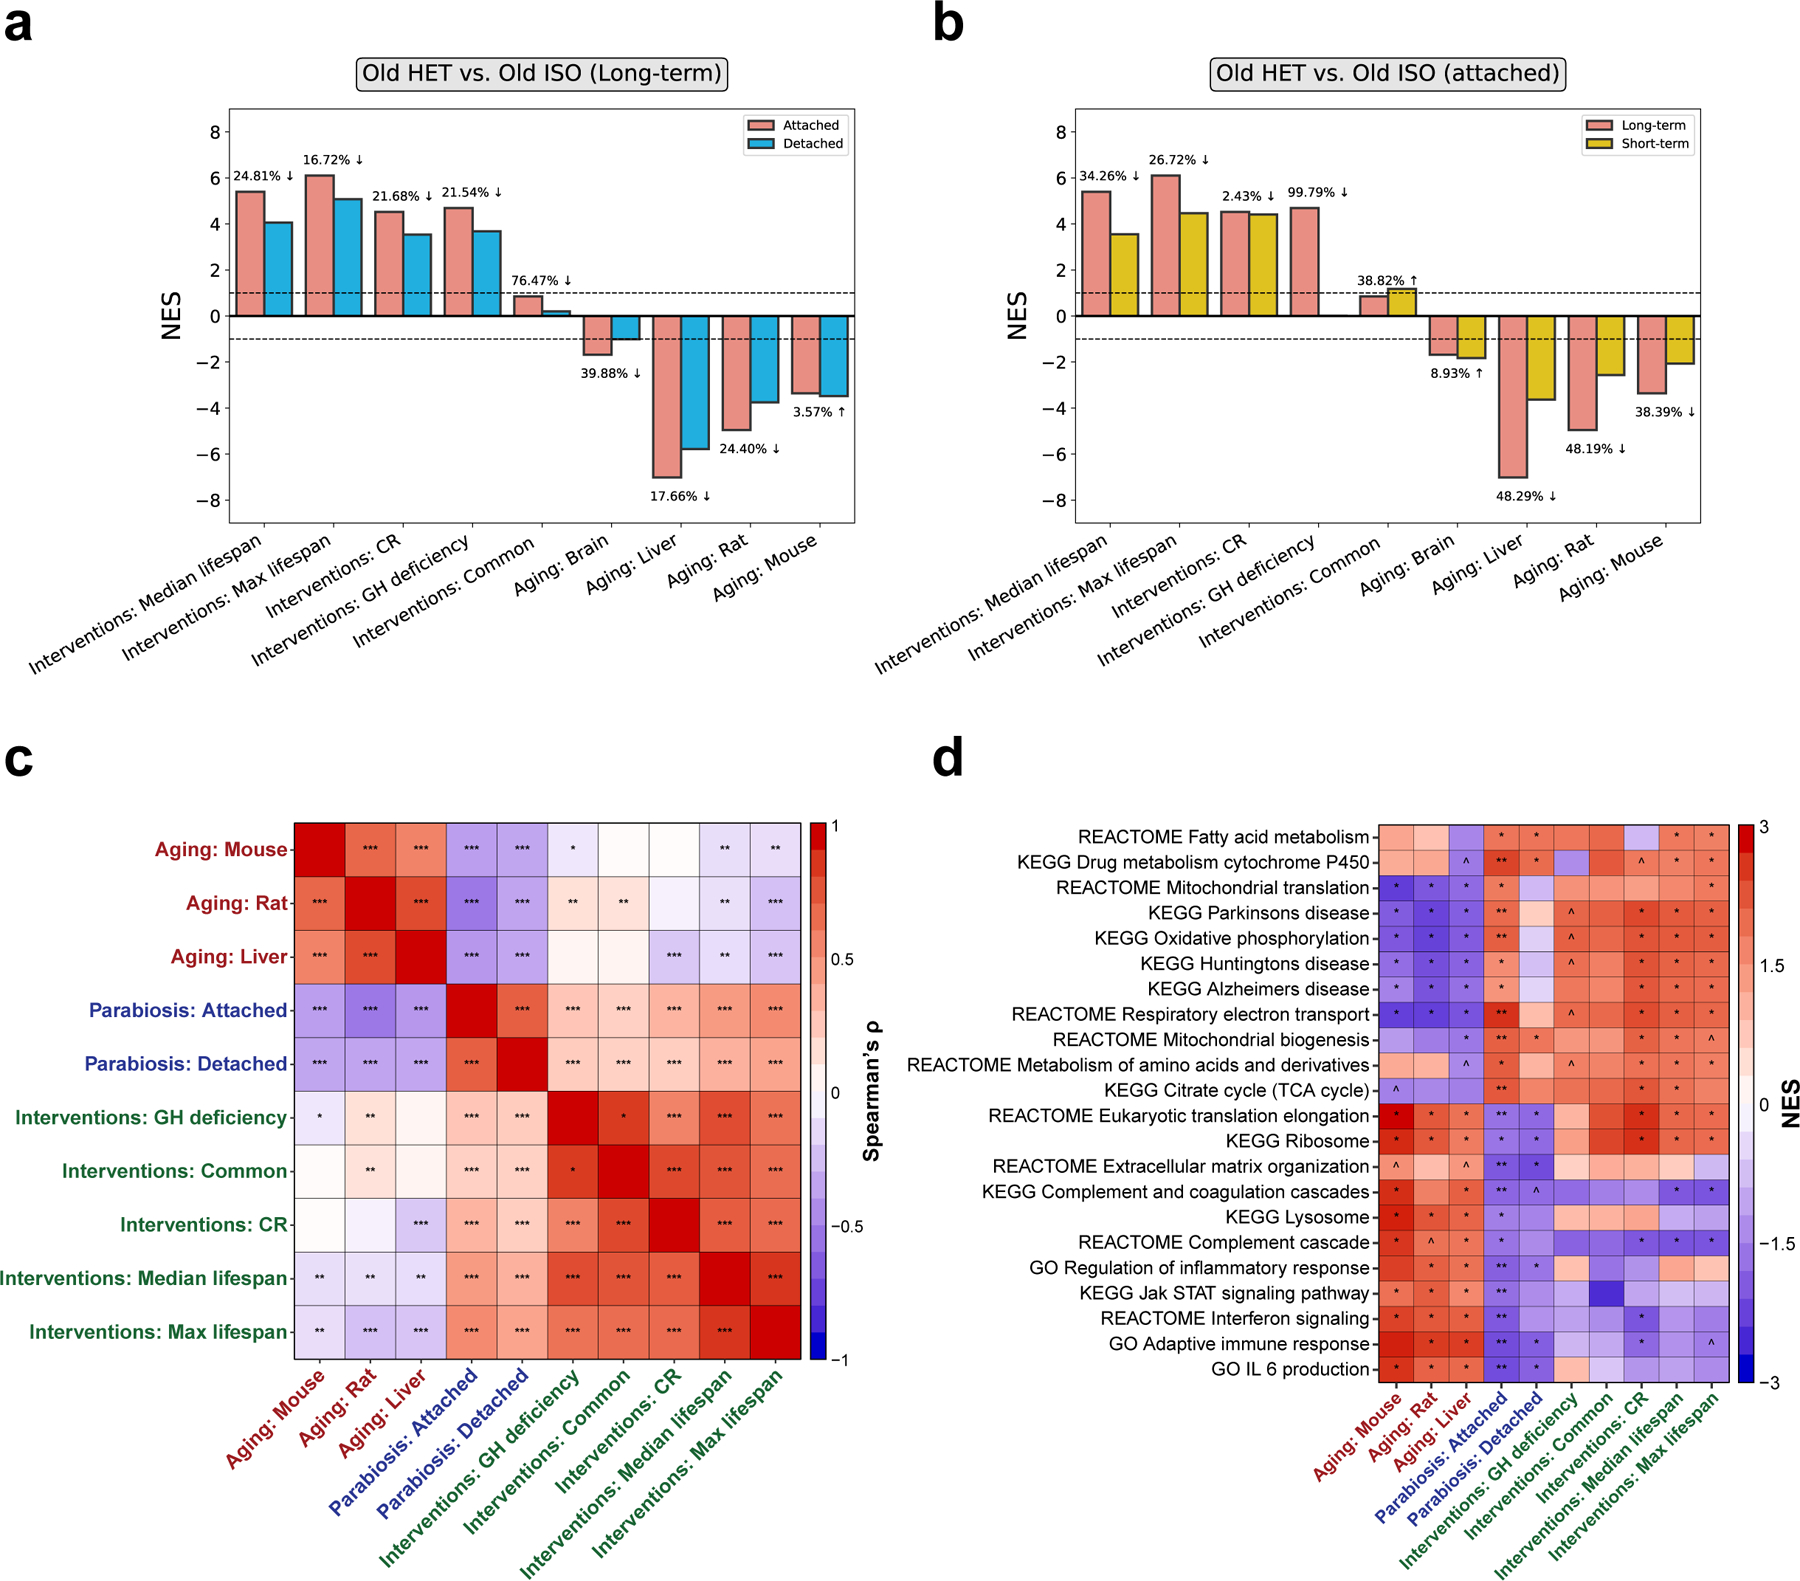
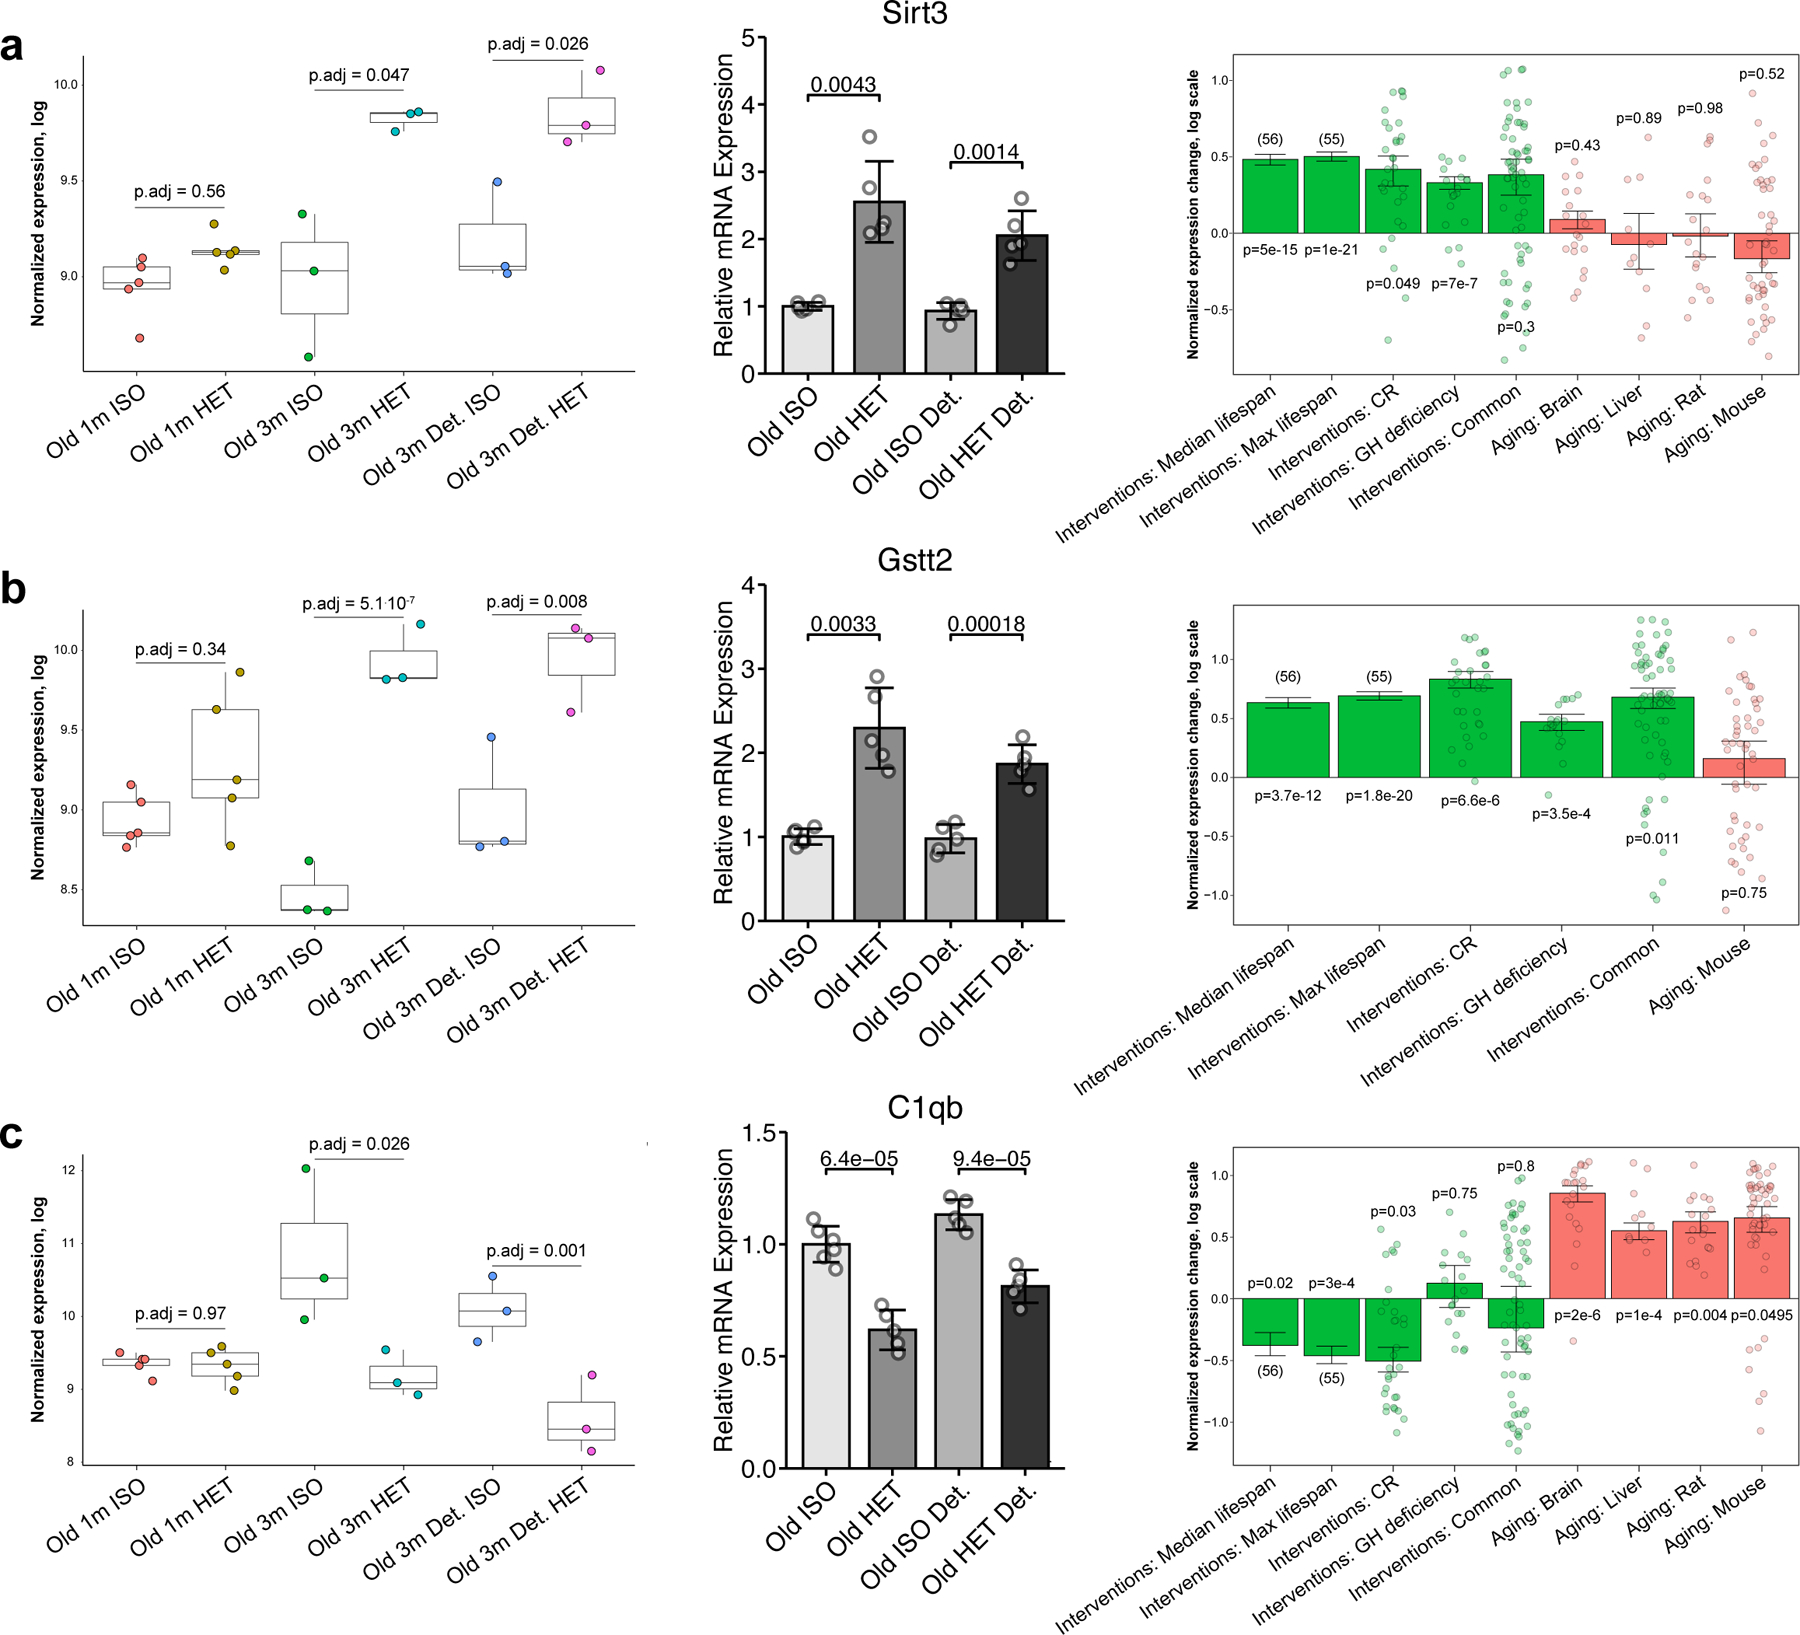
Heterochronic parabiosis (HPB) is known for its functional rejuvenation effects across several mouse tissues. However, its impact on biological age and long-term health is unknown. Here we performed extended (3-month) HPB, followed by a 2-month detachment period of anastomosed pairs. Old detached mice exhibited improved physiological parameters and lived longer than control isochronic mice. HPB drastically reduced the epigenetic age of blood and liver based on several clock models using two independent platforms. Remarkably, this rejuvenation effect persisted even after 2 months of detachment. Transcriptomic and epigenomic profiles of anastomosed mice showed an intermediate phenotype between old and young, suggesting a global multi-omic rejuvenation effect. In addition, old HPB mice showed gene expression changes opposite to aging but akin to several life span-extending interventions. Altogether, we reveal that long-term HPB results in lasting epigenetic and transcriptome remodeling, culminating in the extension of life span and health span.


Conflict of interest statement

Competing interests

The authors do not report any conflicts of interest.

Figures

Extended Data Fig. 1:
Extended Data Fig. 1:. Timeline of molecular and physiological profiling.
a, Schematic timeline of the molecular (transcriptomic & epigenetic) and physiological profiling presented in this study (top) as well as a table (bottom) highlighting mortality rates at various parts in the parabiosis protocol (numbers represent individual mice, not pairs). Samples were taken immediately after the parabiosis period (month 3), or after a 2-month detachment period (month 5). Physiological profiling was performed before the parabiosis experiment (month 0), and then every month from month 4 to month 10. Data in the table (bottom) is separated by experimental purposes and ages of the pairs. Mortality rate across experiments for each group: Young ISO: 11% mortality during PB, 0% during detach; Old ISO: 20% mortality during PB, 13% during detach. Old HET: 19% mortality during PB, 7% during detach. b, Changes in food consumption resulting from parabiosis. Lines depict mean changes with 95% confidence intervals. Individual observations are shown as points. Young isochronic (Young ISO) mice are shown in blue, old heterochronic (Old HET) mice are shown in purple, and old isochronic (Old ISO) mice are shown in red. Dashed line depicts time of detachment. c, Changes in vertical activity resulting from parabiosis. Lines depict mean changes with 95% confidence intervals. Individual observations are shown as points. Legend is the same as (b). d, Schematic of the experimental workflow and associated findings.
Extended Data Fig. 2:
Extended Data Fig. 2:. Blood mixture analyses after 3 months of parabiosis.
a, Schematic of experiments to analyze the blood chimerism after attachment and detachment. Green represents GFP (+) mice, white represents wild-type mice. b, Gating scheme applied to all downstream blood analysis between GFP and wild-type mice. Cells were ultimately gated on GFP (+) (x-axis) and CD45 (+) (y-axis) (right). c, Percentage of blood crossover during attachment. d, Percentage of blood (left) and bone marrow (BM, right) crossover after 2-month detachment, calculated as the % GFP (+) and (−) cells.
Extended Data Fig. 3.
Extended Data Fig. 3.. Relationship of DNAm age across tissues and platforms, delta age analysis, and effect of surgery.
a, Scatterplots highlighting the association of liver and blood DNAm predictions based on RRBS sequencing across 6 different group: young isochronic (Young ISO), young isochronic detached (Young ISO Det.), old heterochronic (Old HET), old isochronic (Old ISO), old heterochronic detached (Old HET Det.), and old isochronic detached (Old ISO Det.). Each point depicts the mean DNAm prediction for a particular tissue for that group. The clock used for predictions is shown in the top part of each panel. The Pearson correlation (r) is shown in each panel, along with its associated two-tailed p-value. Linear regression lines (dark grey) with 95% confidence intervals (light grey) are shown. b, Scatterplots highlighting the association of liver DNAm predictions based on RRBS sequencing and methylation array profiling across 6 different groups (same legend as a). The clock used for RRBS predictions is shown in the top part of each panel. The mouse liver development clock was used for array predictions given that it showed the greatest changes in epigenetic age comparing long-term old heterochronic and isochronic mice. c, Delta age (epigenetic age minus chronological age) of liver samples from old heterochronic mice, old isochronic controls and untreated controls based on universal relative age mammalian, universal log-linear transformed age mammalian, liver, and development liver clocks. Dashed line denotes a delta age of 0 (epigenetic age = chronological age). Points above this line depict age acceleration (epigenetic age > chronological age), while points below this line depict age deceleration (epigenetic age < chronological age). n = 5 per group. d, Epigenetic age of liver samples from 8-month old non-surgical control mice (Young NSC), isochronic detached (Young ISO) and heterochronic detached mice (Young HET), based on the universal relative age mammalian, universal log-linear transformed age mammalian, liver, and liver development clocks. n = 5 per group for parabiosed mice and 6 per group for controls. Two-tailed Welch’s t-tests were used for statistical analyses.
Extended Data Fig. 4.
Extended Data Fig. 4.. Mean methylation in array and RRBS methylation profiles.
a, Mean liver methylation assayed by the Mammalian Methylation Array (HorvathMammalMethylChip40), both based on all sites in the array (left) and only sites in CpG islands (right). n = 5 samples per group. b, Mean global methylation (top), promoter methylation (middle), and gene body methylation (bottom) of liver (left) and blood (right) RRBS samples. Mean methylation was assayed across 1,014,243 CpGs (top), 11,842 promoters (middle), and 13,811 gene bodies (bottom). n = 4–7 samples per group. Two-tailed Welch’s t-test were used for statistical analysis. Schematic tissues in each panel indicate the source of the sample.
Extended Data Fig. 5.
Extended Data Fig. 5.. Physiological tests of a mock parabiosis procedure to assess the interaction of parabiosis and exercise.
a, Schematic of the experiment to test blood sharing using glucose levels. Glucose is injected into one mouse and subsequently assessed in both mice in mock parabiosis pairs. b, Blood glucose level changes in pairs starting with a young (left) and old (right) glucose bolus. c, Moving distance in cm (left), and velocity (right) in the old isochronic, young isochronic and heterochronic mock parabiosis pairs. Standard error is shown as the error bar. pdistance(Young ISO—Old ISO) = 0.034. d, Movement tracking in the old isochronic, young isochronic and heterochronic mock parabiosis pairs.
Extended Data Fig. 6.
Extended Data Fig. 6.. Tissue specificity of RRBS epigenomic profiles, promoter methylation changes, and proteomic dynamics in HPB.
a-c, Principal component analysis (PCA) of CpG methylation across 1,014,243 CpG sites (a), 11,842 promoters (b), and 13,811 gene bodies (c) in n = 36 liver samples and n = 32 blood samples, with 6 different groups in both tissues: young isochronic (Young ISO), young isochronic detached (Young ISO Det.), old heterochronic (Old HET), old isochronic (Old ISO), old heterochronic detached (Old HET Det.), and old isochronic detached (Old ISO Det.). In all the PCA plots, tissue of origin is the largest source of variation (44–91%). d, Mean promoter methylation of Cdc20, Sox30, Mpped1, and Ubl5 across liver RRBS samples. Genes were identified after passing a significance threshold (p < 0.05) when comparing young and old mice, as well as old heterochronic and isochronic mice in both attached and detached groups. Two-tailed Welch’s t-tests were used for statistical analysis. e, Western blot validation (left) and relative protein expression quantification (right) of Sirt3, Gstt2 and C1qb in mice subjected to parabiosis.
Extended Data Fig. 7.
Extended Data Fig. 7.. Interactions between different omics modalities.
a, Correlation of changes across experimental groups and readout types. For each comparison in parentheses (i.e. Young ISO vs. Old ISO), a z-score was computed for either promoter methylation or gene expression. The Pearson correlation of these z-scores was then determined for genes passing a differential expression/methylation threshold of p < 0.05 for the first (left) group listed in each comparison. b, Heat maps highlighting the concordance of readouts and experimental groups. For each heat map, the z-score of genes that are significantly (p < 0.05) differentially expressed or methylated is shown. Genes are ordered by the z-score in the top group. Color bar on the right denotes z-score. The directional concordance, a measure of how directionally aligned the changes between the two readouts/groups are, is shown at the top of each heat map. 50% concordance represents random changes across groups.
Extended Data Fig. 8.
Extended Data Fig. 8.. Transcriptomic and epigenetic changes resulting from HPB.
a, Boxplots of RLD-transformed, log-normalized counts of Tert, Dnmt3b, Ly6e, Lmna and Pld1 across 6 groups (from left to right: old short-term isochronic (n = 5), old short-term heterochronic (n = 5), old long-term isochronic (n = 3), old long-term heterochronic (n = 3), old long-term isochronic detached (n = 3), and old long-term heterochronic detached (n = 3). b, Mean promoter methylation of the genes mentioned in (a) across liver RRBS samples across 6 groups (from left to right: young long-term isochronic (n = 6), old long-term isochronic (n = 5), old long-term heterochronic (n = 5), young long-term isochronic detached (n = 6), old long-term isochronic detached (n = 7), and old long-term heterochronic detached (n = 6). Color of the box around each gene signifies directionality (green: gene expression increases in Old HET mice compared to ISO, orange: gene expression decreases in Old HET mice compared to ISO). Despite evident changes in expression patterns for these genes, no significant changes in promoter methylation are observed. N represents biological replicates for each group. P values determined by two-tailed Welch’s t-test. Box plots represent median, 25–75 percentile and 1.5x IQR.
Extended Data Fig. 9.
Extended Data Fig. 9.. SASP enrichment and differential expression across long-term and short-term HPB.
a-c, Running enrichment score for the senescence-associated secretory phenotype (SASP) gene set, comparing in (a) old isochronic and old heterochronic mice from the long-term HPB, in (b) old detached isochronic and old detached heterochronic mice from long-term HPB, and in (c) old detached isochronic and old detached heterochronic mice from short-term HPB. The P values for the gene set enrichment, along with the adjusted P value are shown in each panel. Positions of individual genes in the gene set are shown as black bars near the bottom of each panel. Long-term attached HPB shows the greatest negative enrichment for heterochronic samples, followed by detached long-term HPB and attached short-term HPB, respectively. d, Boxplots of RLD-transformed, log-normalized count of five SASP genes across 6 groups (from left to right: old short-term isochronic (n = 5), old short-term heterochronic (n = 5), old long-term isochronic (n = 3), old longterm heterochronic (n = 3), old long-term isochronic detached (n = 3), and old long-term heterochronic detached (n = 3). The log2 fold-change (log2FC) and associated P value are shown as calculated by two-tailed Welch’s test. Box plots represent median, 25–75 percentile and 1.5x IQR.
Extended Data Fig. 10.
Extended Data Fig. 10.. STRING network representation of significantly down- and upregulated genes.
a, STRING network representation of significantly downregulated genes in livers of old heterochronic mice (n = 421 genes) compared to isochronic mice immediately after detachment or after a 2-month detachment period (protein-protein interaction q-value < 1e-16). Genes were filtered based on directionality and absolute value of the log2FC. b, STRING network representation of significantly upregulated genes in livers of old heterochronic mice (n = 337 genes) compared to isochronic mice immediately after detachment or after a 2-month detachment period (protein-protein interaction q-value < 1e-16). Genes were filtered based on directionality and absolute value of the log2FC.
Fig. 1 |
Fig. 1 |. Prolonged parabiosis followed by detachment leads to extended life span and health span.
a, Overview of the parabiosis and detachment model. All pairs were anastomosed for 3 months, starting at 20 months of age for old mice and 3 months of age for young mice. At 23 months, old mice were detached and the remaining life span was assessed. b, Schematic of the molecular profiling methods applied to mouse tissues. c, Survival curves of detached old mice from isochronic (red, n = 23) and heterochronic (purple, n = 20) pairs. Kaplan–Meier curves with 95% confidence intervals are shown. The median life span is highlighted with dashed lines. A log-rank test comparing the two survival curves was used for statistical analysis (P = 0.001). d, Body weight, lean mass, fat mass and cage activity measurements before parabiosis and at monthly time points starting 1 month after detachment. Mean values with 95% confidence intervals are shown. A two-tailed Welch’s test was used to compare old isochronic and heterochronic groups: Pbody weight = 0.29; Plean mass = 0.049; Pfat mass = 0.00092; and Pcage activity = 0.015. ‘Young ISO’ denotes young mice from isochronic pairs (n = 10). ‘Old ISO’ denotes old mice from isochronic pairs (n = 7). ‘Old HET’ denotes old mice from heterochronic pairs (n = 8). The dashed lines show the time of detachment. *P < 0.05; **P < 0.01; ***P < 0.001.
Fig. 2 |
Fig. 2 |. Persistent epigenetic age reversal in blood and liver upon HPB assessed by RRBS-based aging clocks.
a, DNA methylation age of old heterochronic blood before and after detachment plotted with isochronic young and old controls assessed by the Meer multi-tissue clock, Petkovich blood clock, Thompson multi-tissue clock, and scAge blood clock. Young Iso (n = 6), Old iso (n = 4), Old HET (n = 5), Young ISO det. (n =6), Old ISO Det. (n = 4), Old HET Det. (n =5). B, DNA methylation age of old heterochronic liver before and after detachment plotted with isochronic young and old controls assessed by the Meer multi-tissue clock, Petkovich blood clock, Thompson multi-tissue clock, and scAge liver clock. Young Iso (n = 6), Old iso (n = 5), Old HET (n = 5), Young ISO det. (n =6), Old ISO Det. (n = 6), Old HET Det. (n =6) “Young ISO” denotes young mice from isochronic pairs, “Old ISO” denotes old mice from isochronic pairs, and “Old HET” denotes old mice from heterochronic pairs. “Det.” denotes detached old mice from isochronic or heterochronic pairs. Box plots represent median, 25–75 percentile and 1.5x IQR. One-tailed Welch’s t-tests assuming unequal variances were used for statistical analyses.
Fig. 3 |
Fig. 3 |. Sustained epigenetic age reversal in liver upon HPB assessed by microarray-based aging clocks.
a, Epigenetic age of long-term (3-month) parabiosis liver samples from old heterochronic attached or detached mice, plotted with young and old isochronic controls, based on the universal relative age mammalian, universal log-linear transformed age mammalian, liver, and liver development clocks. (n = 5) per group. b, Epigenetic age of short-term (5-week) parabiosis liver samples from old heterochronic attached mice, plotted with young and old isochronic controls, based on the same clocks as (a). n = 6 per group. c-d, Epigenetic age of short-term (5-week) mock parabiosis blood (c) and liver (d) samples from old heterochronic attached mice, plotted with young and old isochronic controls, based on the same clocks as (a). (n = 5) per group for heterochronic mice and 6 per group for isochronic mice. Box plots represent 25–75 percentile and 1.5x IQR. One-tailed Welch’s t-tests were used for statistical analysis.
Fig. 4 |
Fig. 4 |. Transcriptomic analyses of HPB reveal unique pathway enrichment and differential expression patterns.
a, GSEA of old isochronic vs old. heterochronic mice (left), as well as of detached old isochronic vs. detached old heterochronic mice (right). Hallmark gene sets (n = 50) were used as input to GSEA. Only significant enrichments in attached groups (adjusted p-value < 0.05) are shown. Gene sets shown in green signify pathways enriched in heterochronic samples, and orange those enriched in isochronic samples. Terms in bold signify pathways that are significantly enriched in the same direction in both attached and detached groups. Terms in normal black font signify pathways that are enriched in the same direction in both attached and detached groups, but only significantly so in the attached comparison. The term in red signifies a pathway that is enriched in different directions in the attached and detached comparisons. Significant gene sets are ranked from top to bottom based on the absolute value of the normalized enrichment score in the attached group. b-c, Volcano plot of differentially expressed genes in attached (b) and detached (c) old heterochronic (n = 3) and old isochronic (n = 3) mice. Some highly significant genes are shown in each plot. Genes shown in red are significantly downregulated in heterochronic mice, while genes shown in blue are significantly upregulated in heterochronic mice, after multiple-testing correction.Two-tailed Benchamini-Hochberg corrected FDR was calculated to compare groups.
Fig. 5 |
Fig. 5 |. Dimensionality reduction highlights rejuvenated molecular profiles following HPB.
a, Principal Component Analysis (PCA) of liver RNA-seq data of mice following long-term parabiosis or 2 months after detachment (n = 3 per group). b, PCA of liver RNA-seq data of short-term parabiotic mice (n = 3 per group) c, PCA of liver RRBS data across all highly covered common CpGs (1,014,243 CpGs, n = 5–7 per group) d, PCA of blood RRBS data across all highly covered common CpGs (1,014,243 CpGs, n = 5–6 per group) e, PCA of liver RRBS data across gene promoters (11,842 promoters, n = 5–7 per group) f, PCA of blood RRBS data across gene promoters (11,842 promoters, n = 5–6 per group) g, PCA of liver RRBS data across gene bodies (13,811 gene bodies, n = 5–7 per group) h, PCA of blood RRBS data across gene bodies (13,811 gene bodies, n = 5–6 group). “Young ISO” denotes young isochronic mice, “Old ISO” denotes old isochronic mice, and “Old HET” denotes old heterochronic mice. Attached refers to samples taken immediately after the parabiosis period, while detached refers to samples taken after 2 months of detachment. Percentages of variance explained by the first two principal components are shown in parentheses on the axes.
Fig. 6 |
Fig. 6 |. The transcriptomic signatures of HPB align with longevity interventions and oppose aging.
a, Association between gene expression changes induced by long-term parabiosis with (blue) and without (red) a 2-month detachment period, and signatures of aging and life span extension. The latter include gene signatures of individual interventions (CR and GH deficiency), common intervention signatures (interventions: common) and signatures associated with an effect on life span (maximum and median life span). The percentage decrease comparing the attached and detached samples is shown for each pair of bars. b, Association between gene expression changes induced by long-term (red) and short-term (yellow) parabiosis without detachment and signatures of aging and life span extension. The signatures analyzed are the same as in a. c, Spearman correlation matrix of gene expression signatures associated with aging (red labels), life span extension (green labels) and HPB (blue labels). d, Functional enrichment analyses of gene expression signatures. Only functions significantly associated with at least one signature are shown. Cells are colored based on NES. The entire list of enriched functions is provided in Supplementary Table 5. P values were generated using GSEA. ^Padj < 0.1; *Padj < 0.05; **Padj < 0.01; ***Padj < 0.001.
Fig. 7 |
Fig. 7 |. Gene expression analyses hint at putative rejuvenation mechanisms of long-term HPB.
ac, Expression of Sirt3 (a), Gstt2 (b) and C1qb (c) in mice subjected to parabiosis by RNA-seq analyses (left), RT–qPCR analyses (middle) and in response to established life span-extending interventions and aging (right). Left: for each gene, normalized expression in logarithmic scale is shown across different parabiosis groups: short-term isochronic (old 1 m ISO, n = 5) and heterochronic (old 1 m HET, n = 5) mice, long-term attached isochronic (old 3 m ISO, n = 3) and heterochronic mice (old 3 m HET, n = 3), long-term detached isochronic (old 3 m detached ISO, n = 3) and heterochronic mice (old 3 m detached HET, n = 3). Adjusted P values, indicating the difference in expression for each pair of isochronic and heterochronic mice, were calculated using a preplanned two-tailed Student’s t-test. The box plots represent the median, 25–75 percentiles and 1.5× IQR. Middle: for the RT–qPCR of each gene, each group has n = 5 biological replicates. The P value between connecting bars was calculated with a two-tailed Student’s t-test. Right: for every signature associated with life span-extending interventions (green) and aging (red), the means of the normalized log fold changes or slopes (for the signatures of the median and maximum life span) are presented. The error bars denote ± 1 s.e. Adjusted P values, indicating the difference of expression change from zero, were calculated with a mixed-effect linear model.

References

    1. Brett JO & Rando TA Alive and well? Exploring disease by studying lifespan. Current opinion in genetics & development 26, 33–40, doi: 10.1016/j.gde.2014.05.004 (2014). - DOI - PMC - PubMed
    1. Lopez-Otin C, Blasco MA, Partridge L, Serrano M & Kroemer G The hallmarks of aging. Cell 153, 1194–1217, doi: 10.1016/j.cell.2013.05.039 (2013). - DOI - PMC - PubMed
    1. Lopez-Otin C, Blasco MA, Partridge L, Serrano M & Kroemer G Hallmarks of aging: An expanding universe. Cell 186, 243–278, doi: 10.1016/j.cell.2022.11.001 (2023). - DOI - PubMed
    1. Horvath S DNA methylation age of human tissues and cell types. Genome Biol 14, R115, doi: 10.1186/gb-2013-14-10-r115 (2013). - DOI - PMC - PubMed
    1. Meer MV, Podolskiy DI, Tyshkovskiy A & Gladyshev VN A whole lifespan mouse multi-tissue DNA methylation clock. eLife 7, e40675, doi: 10.7554/eLife.40675 (2018). - DOI - PMC - PubMed

Publication types