. 2023 Sep;26(9):1516-1528.
doi: 10.1038/s41593-023-01396-3. Epub 2023 Jul 27.

Pedunculopontine Chx10+ neurons control global motor arrest in mice

Affiliations

Pedunculopontine Chx10+ neurons control global motor arrest in mice

Haizea Goñi-Erro et al. Nat Neurosci. 2023 Sep.

Erratum in

Abstract

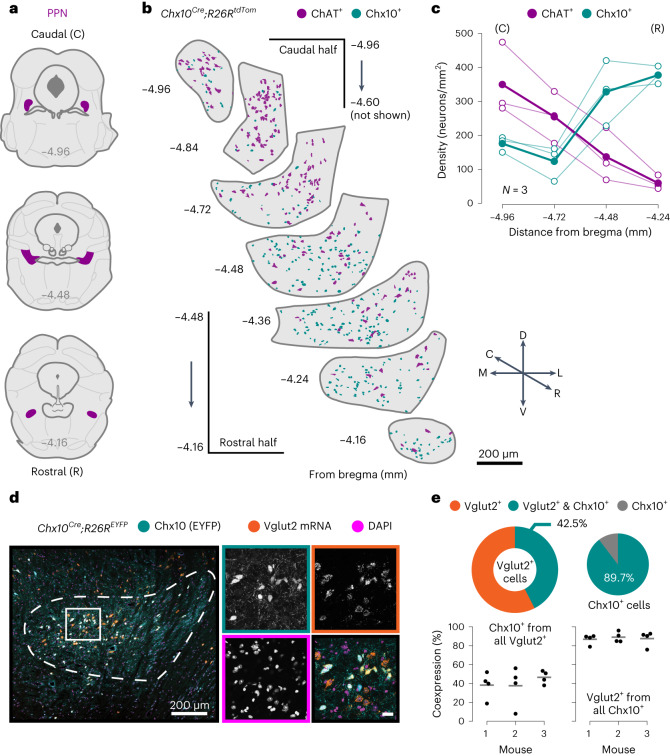
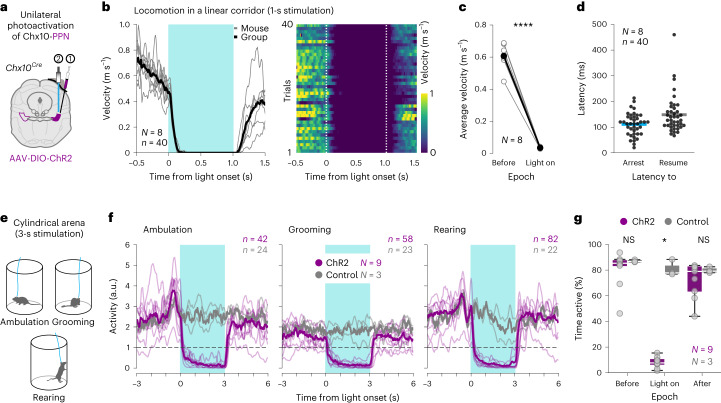
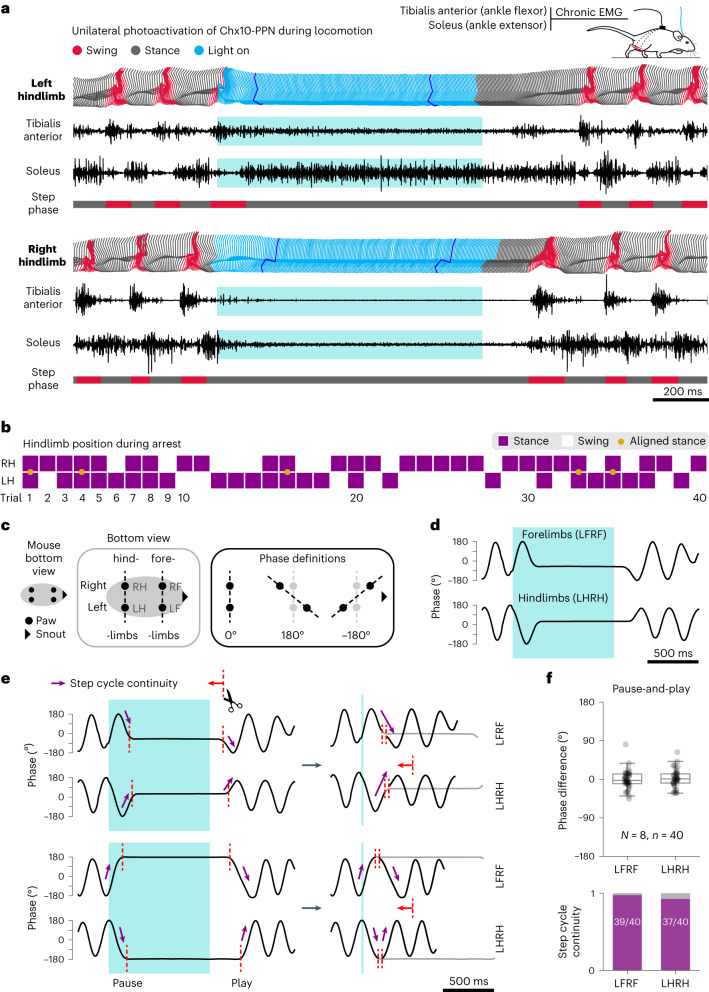
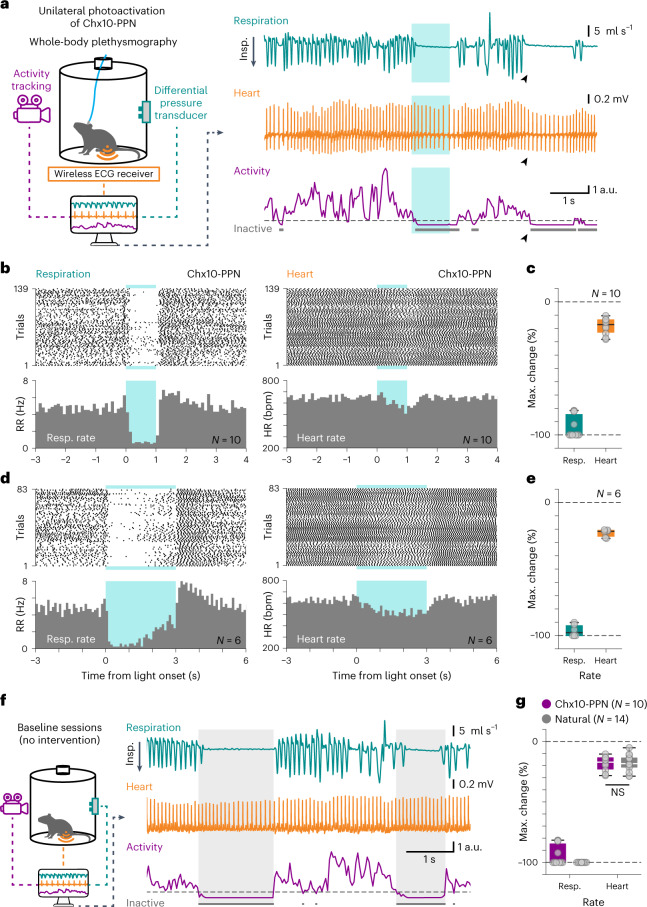
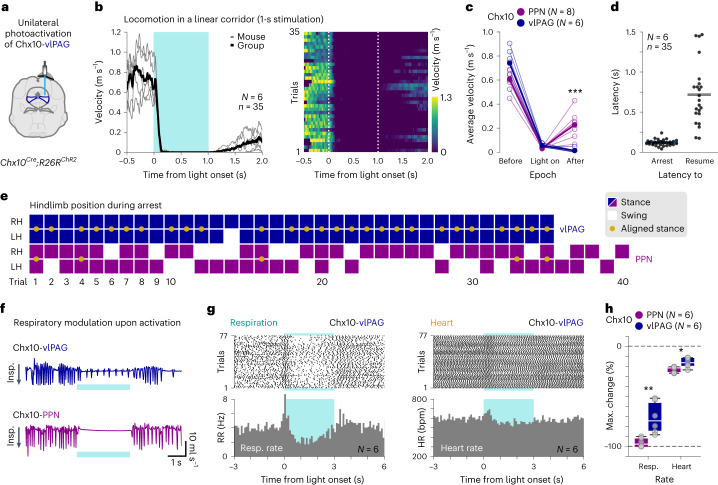
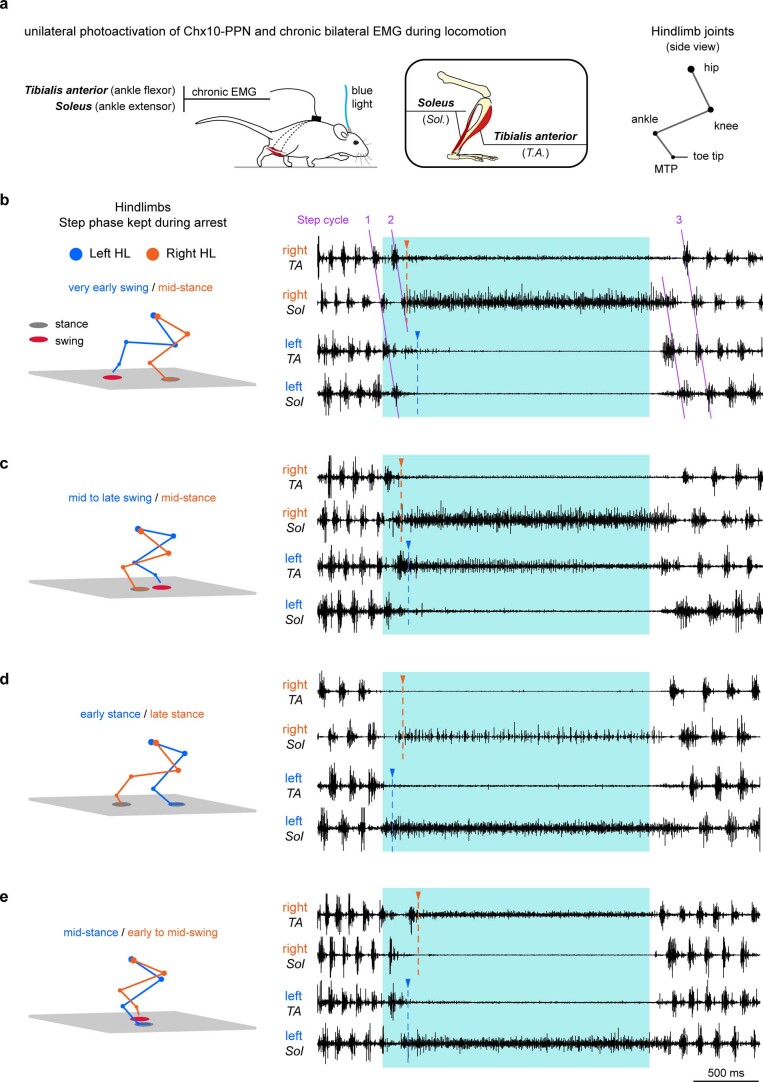
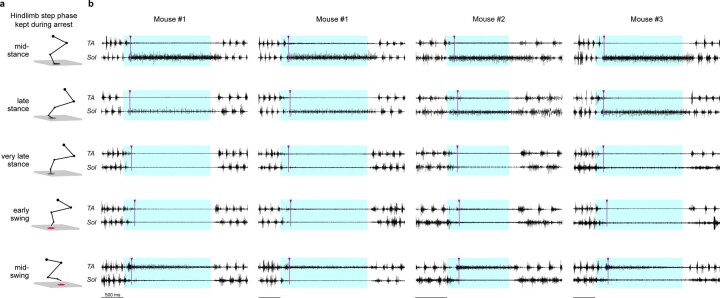
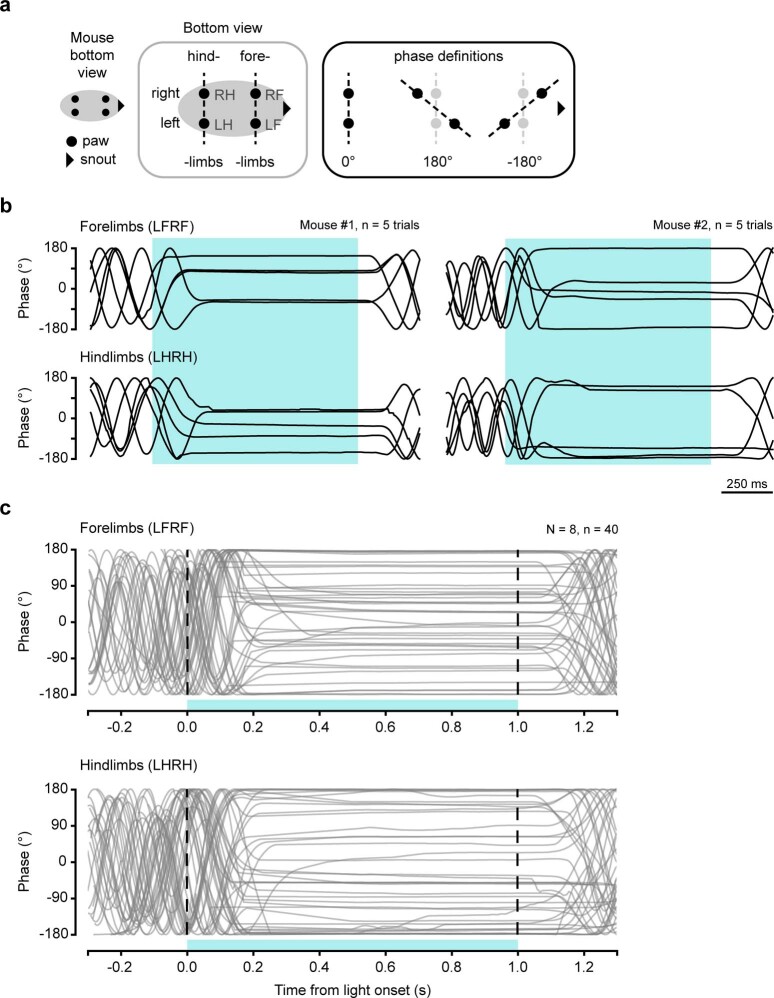
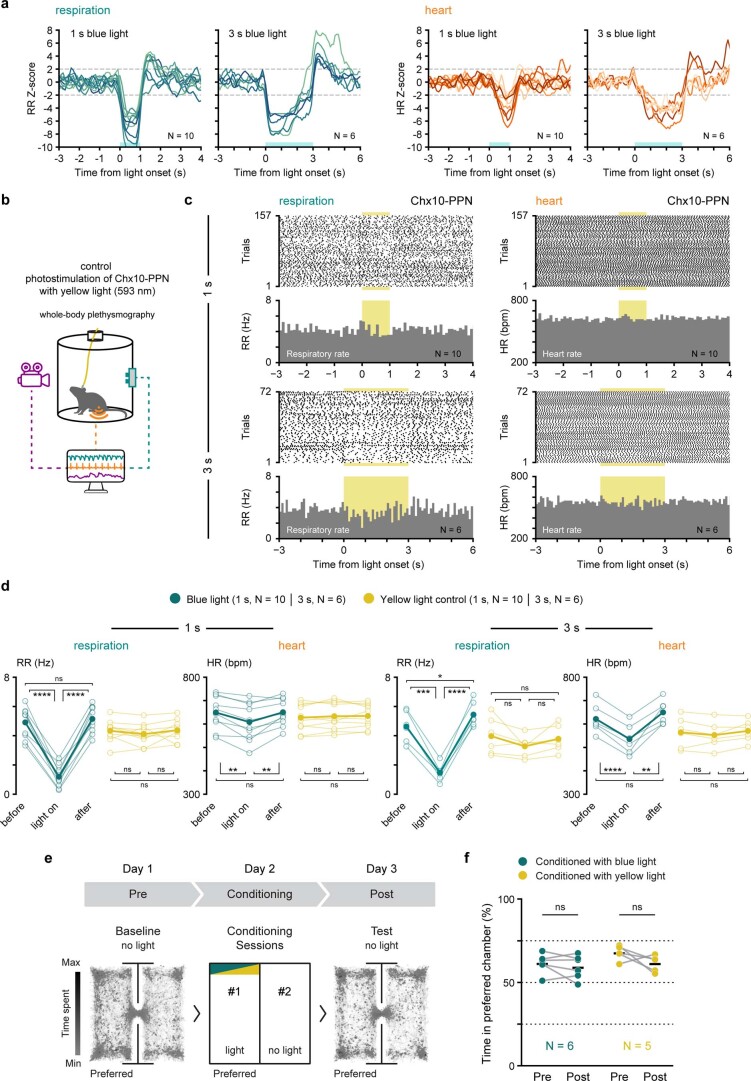
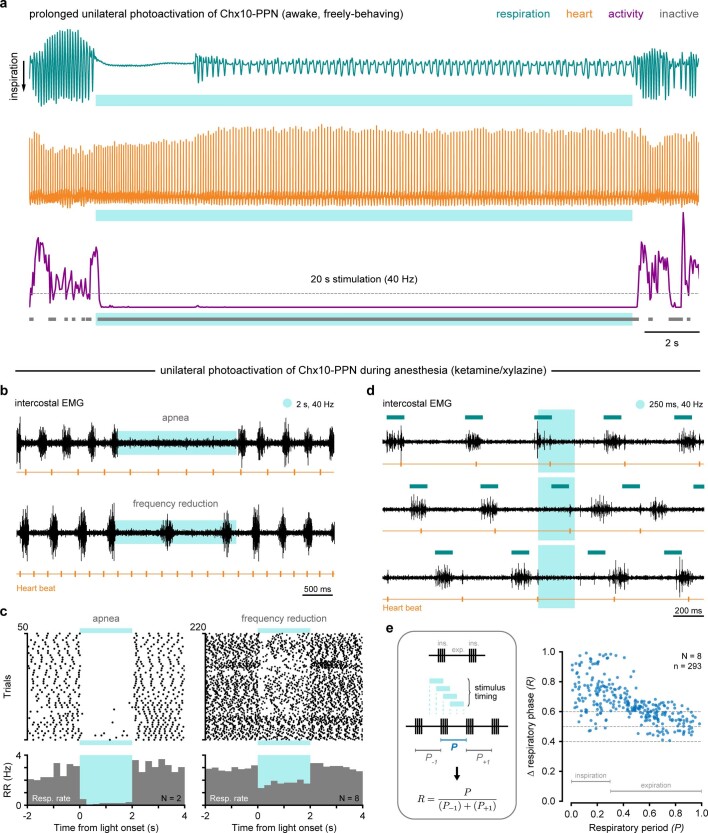
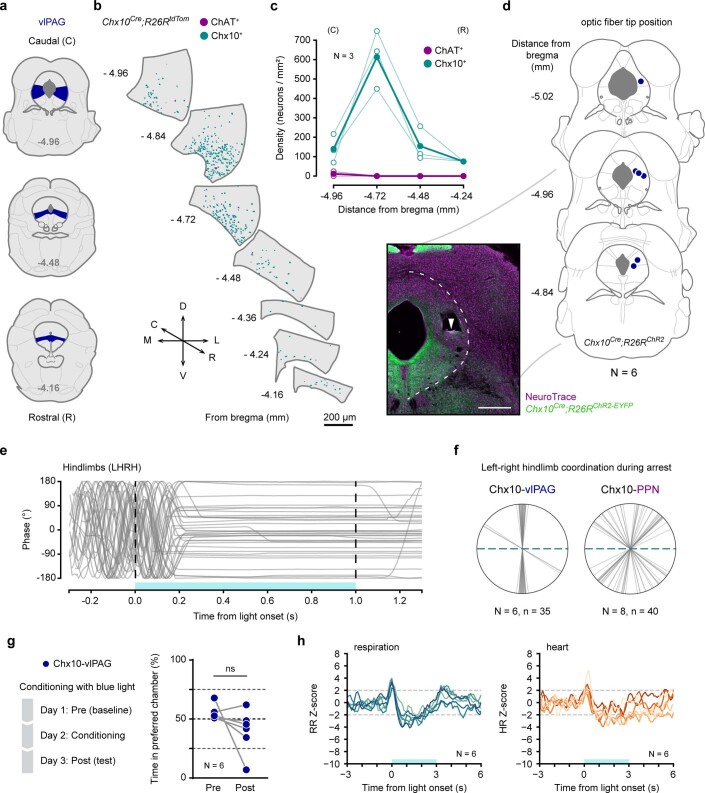
Arrest of ongoing movements is an integral part of executing motor programs. Behavioral arrest may happen upon termination of a variety of goal-directed movements or as a global motor arrest either in the context of fear or in response to salient environmental cues. The neuronal circuits that bridge with the executive motor circuits to implement a global motor arrest are poorly understood. We report the discovery that the activation of glutamatergic Chx10-derived neurons in the pedunculopontine nucleus (PPN) in mice arrests all ongoing movements while simultaneously causing apnea and bradycardia. This global motor arrest has a pause-and-play pattern with an instantaneous interruption of movement followed by a short-latency continuation from where it was paused. Mice naturally perform arrest bouts with the same combination of motor and autonomic features. The Chx10-PPN-evoked arrest is different to ventrolateral periaqueductal gray-induced freezing. Our study defines a motor command that induces a global motor arrest, which may be recruited in response to salient environmental cues to allow for a preparatory or arousal state, and identifies a locomotor-opposing role for rostrally biased glutamatergic neurons in the PPN.


Conflict of interest statement

The authors declare no competing interests.

Figures

Fig. 1
Fig. 1. Chx10-derived neurons define a subpopulation of glutamatergic PPN neurons with a rostral bias.
a, Coronal plane schematics highlighting the PPN (magenta) at different levels of its rostrocaudal axis. From bregma: caudal edge at −4.96 mm (top), rostral edge at −4.16 mm (bottom). b, Spatial distribution of Chx10+ (cyan, Chx10Cre; R26RtdTomato reporter mouse) and ChAT+ (magenta, antibody) neurons along the rostrocaudal axis of the PPN. C, caudal; R, rostral; D, dorsal; V, ventral; M, medial; L, lateral. c, Quantification of Chx10+ (cyan) and ChAT+ (magenta) neuron densities at four coronal levels of the PPN: −4.96 and −4.72 mm from the caudal half, −4.48 and −4.24 mm from the rostral half. For each cell type, hollow circles are individual mice and filled circles the group average (N = 3 mice, 1 hemisection/level/mouse). d, Left, confocal photomicrograph of the rostral PPN from a Chx10Cre; R26REYFP reporter mouse that labels all Chx10+ neurons (Chx10, cyan), in situ hybridization for Vglut2 mRNA (Vglut2 mRNA, orange) and nuclear staining (DAPI, pink). The dashed line delineates the PPN. The solid square delineates the magnified area. Right, single-channel images (grayscale) of the magnified area framed following the same color code, and the composite image (colored) at the bottom right. Scale bar, 20 µm. e, Percentage of neurons coexpressing Chx10 and Vglut2 within the PPN (from all Vglut2+, left; from all Chx10+, right). Most Chx10+ neurons also express Vglut2 mRNA. Pie charts depict group means (Vglut2+only, orange; Vglut2+ and Chx10+, cyan; Chx10+ only, gray). Strip plots show single hemisections and the mouse average (gray line; N = 3 mice, 4 hemisections/mouse). Source data
Fig. 2
Fig. 2. Activation of Chx10-PPN neurons causes global motor arrest.
a, Experimental strategy to optogenetically target Chx10-PPN neurons in Chx10Cre mice. b, Effect of Chx10-PPN neuron activation on velocity during locomotion in a linear corridor. Left, group average velocity (black line; 40 trials) and mouse average velocities (gray lines; N = 8 mice, 5 trials/mouse). Right, velocity heat map for individual trials. Dashed vertical lines delimit light onset and offset. c, Average locomotor velocities while crossing the linear corridor before light onset (before) and during blue-light stimulation (light on; two-tailed paired t-test; light on versus before, mean speed difference = −0.57 ± 0.07 m s−1 (s.d.), CI = −0.63 to −0.51, P< 0.0001). Gray hollow circles are individual mice (mouse average), and black filled circles indicate the group average (N= 8 mice, 5 trials/mouse). d, Latencies to arrest locomotion from light onset (left, blue), and latencies to resume locomotion from light offset (right, gray). Dots are individual trials, and lines represent group means. e, Setup to assess the effect of Chx10-PPN neuron activation during slow ambulation, grooming and rearing. f, Arrest of all assessed behaviors during light stimulation in mice expressing ChR2 in Chx10-PPN neurons, while EYFP-expressing control mice are unaffected. For each treatment group (ChR2, magenta, N= 9 mice; control (EYFP), gray, N= 3 mice), thick lines are the group average activity and thin lines indicate the mouse average activity. Horizontal dashed lines define the inactivity threshold. Blue shades (b and f) delimit light stimulus duration. g, Percentage of time that mice spent being active within each of the 3-s epochs around stimulation (before, light on, after) in the cylinder test, all three behaviors combined. Mice in the ChR2-expressing group (magenta, N = 9) are inactive during stimulation, while mice in the EYFP-expressing control group (gray, N= 3) remain active (Mann–Whitney test with Holm–Sidak’s correction for multiple comparisons, ChR2 versus control, adjusted P values: light on, P= 0.027026; before and after NS). In box-and-whisker plots, white lines indicate medians, box edges the IQR, and whiskers extend to the minimum (Q1 – 1.5 × IQR) and maximum (Q3 + 1.5 × IQR). Circles represent individual mice. a.u., arbitrary units. Source data
Fig. 3
Fig. 3. The Chx10-PPN-evoked motor arrest has a pause-and-play pattern without a distinct kinematic signature.
a, Hindlimb dynamics of a Chx10Cre mouse expressing ChR2 in the PPN during a locomotor bout in the linear corridor temporarily interrupted by activation of Chx10-PPN neurons. Left and right hindlimb activity represented with three methods: top, stick diagrams to track joint positions over time; middle, EMG recordings showing the activity of ankle flexor (tibialis anterior) and ankle extensor (soleus) muscles; bottom, step-phase classification into stance (gray) and swing (red) phases. Stick diagrams follow the same color code, except during the light-on period (light blue). Dark-blue sticks highlight how joints remain in the same position throughout the stimulation once an arrest position has been reached. b, Hindlimb (RH, right; LH, left) position during arrest. Solid magenta squares indicate stance phase, while empty squares indicate swing phase. Yellow dots indicate that the animal had both legs on the ground aligned perpendicular to the body axis (n= 40 trials, N= 8 mice). c, Explanatory diagrams of the limb coordination tracking based on paw positions (bottom view). Phase values are defined by the distance on the x axis between left and right forelimbs or hindlimbs. d, Representative example of phase values for LFRF and LHRH during locomotion in a Chx10-PPN stimulation trial. e, Representative stimulation trials illustrating step cycle continuity after light offset, both when the arrest happens midway (top example, rising or falling phase), or at maximum left–right displacement (bottom example, peak or trough). f, Quantification of the pause-and-play pattern. Top, phase difference between pause-and-play time points for forelimbs (left) and hindlimbs (right). Bottom, step cycle continuity as illustrated by purple arrows in e, quantified as a binary outcome for all trials. In box-and-whisker plots, central lines indicate medians, box edges the IQR, and whiskers extend to the minimum (Q1 – 1.5 × IQR) and maximum (Q3 + 1.5 × IQR). Circles represent individual trials (n= 40 trials, N= 8 mice, 5 trials/mouse). Blue shades (a, c and d) delimit light stimulus duration. Source data
Fig. 4
Fig. 4. Apnea and bradycardia accompany Chx10-PPN-induced motor arrest.
a, Left, experimental strategy for simultaneous recording of respiratory, cardiac and motor activity in unrestrained mice combined with optogenetics for activation of Chx10-PPN neurons. Right, example traces containing a snippet of all the recorded signals during and around a blue-light stimulation event: the plethysmography trace shows respiratory activity through flow changes where downward deflections indicate inspiration (top, cyan), the ECG trace shows cardiac activity (center, orange) and the activity trace reflects movement (bottom, magenta), with inactive periods tagged in gray. The horizontal dashed line marks the inactivity threshold. Photoactivation of Chx10-PPN neurons (blue shade) evokes apnea, a reduction in heart rate and motor arrest. Black arrowheads point to a naturally occurring arrest event with a similar pattern in all three signals in the absence of experimental manipulations. b, Raster plots (top) and PSTHs (bottom) of the respiratory rate (left) and the heart rate (right) around Chx10-PPN neuron activation with blue light for 1 s (N= 10 mice, n= 139 trials). c, Maximum change in average respiratory rate and average heart rate during blue-light activation of Chx10-PPN neurons compared to the baseline average rates. d,e, Same as in b and c, but for 3 s of blue-light stimulation (N= 6 mice, 83 trials). f, Same as in a but for baseline sessions in the absence of any experimental intervention. Gray shades delimit naturally occurring apneic arrest events. g, Same as in c but comparing the 1-s blue-light activation of Chx10-PPN neurons (magenta) to naturally occurring long apneic arrest events (gray; N= 14 mice), where the heart rate also changed similarly (two-tailed unpaired t-test, PPN versus natural, NS). In box-and-whisker plots, lines indicate medians, box edges the IQR, and whiskers extend to the minimum and maximum. Circles represent individual mice. Blue shades (a, b and d) delimit light stimulus duration. Source data
Fig. 5
Fig. 5. The Chx10-PPN evoked global motor arrest differs from Chx10-vlPAG induced fear-related freezing.
a, Experimental strategy to optogenetically target Chx10+ neurons in the vlPAG using Chx10Cre; R26RChR2 mice. b, Effect on velocity of Chx10-vlPAG neuron photoactivation during locomotion in a linear corridor. Left, group average velocity (black line; 35 trials) and mouse average velocities (gray lines; N= 6 mice, 3–8 trials/mouse). Right, velocity heat map for individual trials. Dashed vertical lines delimit light onset and offset. c, Average locomotor velocities while crossing the linear corridor before light onset (before), during stimulation (light on), and after light offset (after), when activating Chx10+ neurons in the PPN (magenta, N = 8 mice) or the vlPAG (blue, N= 6 mice; two tailed Mann–Whitney test, PPN versus vlPAG, after, P= 0.0007). Hollow circles are individual mice (mouse average), and filled circles are the group average. d, Latencies to arrest locomotion from light onset (left), and latencies to resume locomotion from light offset (right). Dots are individual trials and lines are group means. e, Hindlimb (RH, right; LH, left) position during arrest in the linear corridor for Chx10-vlPAG (blue) and Chx10-PPN (magenta) neuron stimulation trials. Solid squares represent stance, while empty squares represent swing. Yellow dots denote that RH and LH are aligned perpendicular to the body axis. f, Example plethysmography traces upon Chx10-vlPAG (top, blue) and Chx10-PPN (bottom, magenta) neuron activation. Downward deflections correspond to inspiration. Data were acquired using the same experimental setup as in Fig. 4. g, Raster plots (top) and PSTHs (bottom) of the respiratory rate (left) and the heart rate (right) around Chx10-vlPAG activation (N= 6 mice, 77 trials). h, Maximum change in average respiratory and heart rates during activation of Chx10-PPN (magenta) or Chx10-vlPAG (blue) neurons compared to their baseline average rates (two-tailed Mann–Whitney test, PPN versus vlPAG, respiratory rate: P= 0.0022; heart rate: P= 0.0260). In box-and-whisker plots, lines indicate medians, box edges denote the IQR, and whiskers extend to the minimum and maximum values. Circles represent individual mice (N= 6 mice in both groups). Blue shades (b, f and g) delimit light duration. Source data
Fig. 6
Fig. 6. Brainstem projection targets from Chx10-PPN neurons.
a, Experimental strategy to unilaterally label Chx10-PPN neurons with an anterograde tracer (AAV-FLEX-tdTom-T2A-SypGFP) to reveal their projection pattern. b, Example fluorescence photomicrograph (coronal plane) of the rostral PPN at the injection site with tdTomato-expressing Chx10-PPN neurons in white. c, Reconstruction of putative synaptic bouton positions (digital SypGFP, cyan) from Chx10-PPN neuron projections at six different brainstem levels. The boutons are mostly located in the medial zone of the pontine and medullary reticular formations. Pie charts at each coronal level depict the percentage of boutons ipsilateral (ipsi, gray) or contralateral (contra, black) to the injection site, with the majority of them being ipsilateral at all brainstem levels. d, Normalized average bouton density in selected structures located within the coronal levels reconstructed in c. For each structure, the ipsilateral (gray) and contralateral (black) sides are quantified separately, unless they are midline structures (blue). Error bars represent the s.e.m. and hollow circles denote individual mice (N = 4 mice). For an extended overview and full names of all abbreviations, see Extended Data Fig. 10, which also includes projection areas in the midbrain and diencephalon. Source data
Extended Data Fig. 1
Extended Data Fig. 1. Mutually exclusive distribution of Chx10+ and ChAT+ neurons along the rostro-caudal axis of the PPN.
a, Left, coronal plane schematics highlighting the PPN (magenta) at different rostro-caudal levels. Right, confocal photomicrographs showing the distribution of Chx10+ (green, Chx10Cre; R26EYFP reporter mouse) and ChAT+ (magenta, antibody) neurons at the corresponding rostro-caudal levels of the schematics to the left. The pictures at the right-most column are magnified images corresponding to the area delineated by dashed lines in the pictures to the left. The same area is also delineated in the schematics with orange dashed lines. White arrowheads in the magnified pictures point to the PPN. Chx10+ neurons are sparse within the caudal half of the PPN while their density increases in the rostral half of the PPN, following an inverted pattern compared to ChAT+ neurons within the nucleus. There is no overlap in the cellular expression of ChAT and Chx10 at any rostro-caudal level of the PPN. Chx10+ neurons are also found in the vlPAG where they are enriched at the coronal levels corresponding to the caudal half of the PPN (see also Extended Data Fig. 8).
Extended Data Fig. 2
Extended Data Fig. 2. Experimental approach to target Chx10-PPN neurons during optogenetic activation and ablation experiments.
a, Extended overview of the experimental strategy to optogenetically target Chx10+ neurons in the PPN using a Cre-dependent viral approach in Chx10Cre mice. b, Example photomicrograph (coronal plane) of the rostral PPN at the injection site with the ChR2-mCherry-expressing Chx10-PPN neurons in green and a fluorescent Nissl stain (NeuroTrace) in violet. White arrowhead points to the tip of the optic fiber. c-d, Reconstruction of the optic fiber tip position (c) and ChR2 expression (d) for all mice (N = 10) used in the optogenetic experiments performed to assess the effect of Chx10-PPN activation during ongoing locomotion (linear corridor; N = 8) and during other motor behaviors (ambulation, grooming, rearing; cylinder test; N = 9). d, Experimental strategy to assess the effect of Chx10-PPN neuron ablation over naturally occurring arrest events using a Cre-dependent Caspase3-based viral approach in Chx10Cre; R26RtdTomato mice. e, Example fluorescence photomicrographs of the PPN from Chx10Cre; R26RtdTomato reporter mice with Chx10+ neurons expressing tdTomato (white), acquired after the post-ablation open field time point. Left, PPN of an EYFP-injected control mouse; right, PPN of a Casp3-injected mouse. For anatomical reference, in both images the dashed lines delimit the lateral border of the parabigeminal nucleus (left) and the ventral border of the periaqueductal gray (right). Scale bars, 500 µm. f, Number of Chx10-tdTomato+ cells in the PPN of Control (left, gray) and Casp3 (right, red) mice (N = 8 mice per group; bilateral counts, one section/mouse) (two-tailed unpaired t-test, Control vs. Casp3: difference between means = 286.72 cells, CI = 239.3 to 117.66 cells, P < 0.0001). g, Arrest events in the open field during baseline and post-injection open field sessions in control mice (left, gray; N = 8) and Casp3-injected mice (right, red; N = 8), displayed as the % of baseline for each mouse. Hollow circles are individual mice, solid circles and error line are the mean and CI. h, Arrest events in the post-injection open field session displayed as the % change from baseline for each mouse (two-tailed unpaired t-test, Control vs. Casp3: difference between means = 72.72 %, CI = 27.84 to 117.66 %, P = 0.0039). In box-and-whisker plots, white lines indicate medians, box edges the interquartile range (IQR), and whiskers extend to the minimum and maximum. Circles represent individual mice.
Extended Data Fig. 3
Extended Data Fig. 3. Stimulation of Chx10-PPN neurons at different phases of the step cycle leads to unique arrest patterns.
a, Left, summary of the experimental setup for chronic EMG recordings during locomotion in a linear corridor paired with optogenetic stimulation of Chx10-PPN neurons. Center, drawing of the recorded hindlimb muscles. Right, hindlimb joint diagram (side-view) used to model limb and joint positions. MTP, metatarsophalangeal joint. b-e, Examples from a single animal of unique arrest patterns at different phases of the step cycle. For all panels: Left, stick diagrams showing hindlimb joint positions during arrest for the same animal stimulated at four different time-points within the step cycle resulting in unique step phase combinations kept during arrest (blue, left hindlimb; orange, right hindlimb). The elliptical shade below each foot indicates the step cycle phase (gray, stance; red, swing). Right, EMG recordings showing the muscle activity of the right Tibialis anterior (right TA, ankle flexor), the right Soleus (right Sol, ankle extensor), the left TA, and the left Sol; before, during and after light stimulus for the four different trials. The unique combination of muscle activity during light on is the one supporting the hindlimb position kept during arrest, which is depicted to the left with stick diagrams. Arrowheads and dashed lines mark the moment of movement arrest for each of the limbs (right limb, orange; left limb, blue). Purple lines in b (right) mark the pattern of muscle activation during three consecutive step cycles (denoted as 1, 2, 3). Notice how the pattern in cycle no. 2 is kept on hold during the light-evoked arrest, and the sequence of muscle activation is resumed after light off. Blue shades delimit light stimulus duration.
Extended Data Fig. 4
Extended Data Fig. 4. Stimulation of Chx10-PPN neurons at different phases of the step cycle leads to unique arrest patterns that are reproducible across animals.
Chronic hindlimb EMG recordings during locomotion in a linear corridor paired with optogenetic stimulation of Chx10-PPN neurons. a, Hindlimb step phase kept during the optogenetically evoked locomotor arrest depicted by stick diagrams. The elliptical shade below the foot indicates the step cycle phase (gray, stance; red, swing). b, Matrix showing examples of muscle activity patterns when the same animal (first and second columns, mouse #1) or different animals (third and fourth columns, mice #2 and #3) were arrested in the same phase of the step cycle (across rows) and at different phases of the step cycle (across columns). The step phase for each row corresponds to the diagram in a. Every pair of traces in the same row shows the muscle activity of the Tibialis anterior (TA, upper trace) and the Soleus (Sol, bottom trace) during the evoked arrest. The arrest evoked by Chx10-PPN neuron activation at any given phase of the step cycle leads to a similar posture and EMG pattern in TA and Sol both in the same animal and across animals. Purple arrowheads and lines mark the moment of movement arrest for each hindlimb. Blue shades delimit light stimulus duration (2 s —mice #1 and #3— or 1 s —mouse #2— at 40 Hz).
Extended Data Fig. 5
Extended Data Fig. 5. Chx10-PPN activation can pause locomotion at any position without a preferred phase and in a subject independent manner.
a, Explanatory diagrams of the analysis used to assess left-right limb coordination based on paw tracking from the bottom view of the Chx10-PPN stimulation trials in the linear corridor. Phase values are defined by the distance on the x axis between left and right fore- or hind-limbs. b, Phase values for forelimbs (LFRF, top) and hindlimbs (LHRH, bottom) of two different mice (5 trials each) during locomotion in the linear corridor, temporarily interrupted by optogenetic Chx10-PPN neuron stimulation (blue shade). c, Same as b but for all trials of all mice (N = 8, n = 40 trials total, 5 trials/mouse). Blue shades (b, c) delimit light stimulus duration.
Extended Data Fig. 6
Extended Data Fig. 6. Consistency of respiratory and heart rate changes, control for the wavelength specificity of light stimulation, and conditioned place aversion test upon Chx10-PPN neuron stimulation.
a, Z-score for respiratory rate (RR; left, blue lines) and heart rate (HR; right, orange lines) upon Chx10-PPN neuron activation with either 1 or 3 s of blue light (baseline = 5 s before light onset for each mouse). Each line represents a mouse (N = 10 mice for 1 s, N = 6 mice for 3 s). b, Experimental strategy for simultaneous recording of respiratory, cardiac, and motor activity in unrestrained mice combined with optogenetics for control stimulation of Chx10-PPN neurons with yellow light (593 nm). c, Raster and peri-stimulus time histograms of the respiratory rate (RR, left) and the heart rate (HR, right) around yellow light delivery as a wavelength specificity control in mice expressing ChR2 in Chx10-PPN neurons (top, 1 s stimulation, N = 10 mice, 157 trials; bottom, 3 s stimulation, N = 6 mice, n = 72 trials). Yellow shades delimit yellow-light stimulus duration. d, Average respiratory rate (RR) and heart rate (HR) during each of the time epochs surrounding blue or yellow light stimulation (5 s before, 1 or 3 s light on, 5 s after). As opposed to blue light, yellow light does not evoke any significant changes in respiratory or heart rates (statistical comparisons correspond to adjusted P values from Tukey’s multiple comparisons test, see Supplementary Table 1 for details). For each rate, stimulus duration, and wavelength: hollow circles are individual mice and filled circles the group average, all connected across epochs. The same mice were first tested with blue light and then with yellow light (N = 10 for 1 s stimulus duration; N = 6 for 3 s). e, Timeline of the conditioned place aversion (CPA) paradigm with baseline (‘Pre’) and test (‘Post’) heatmaps representing the time spent across the entire arena for all mice conditioned with blue light (10 ms pulse width, 1 s train duration, 40 Hz; 1 s ON / 9 s OFF in a 30 minute session). f, Percentage of time that mice spent in their preferred chamber before (‘Pre’) and after (‘Post’) conditioning with blue light (left, N = 6 mice) or yellow light (right, N = 5 mice). Neither blue nor yellow light caused a change in place preference. Two tailed paired t-test, ‘Post’ vs. ‘Pre’: blue light, mean difference = −2.22 ± 5.87 % (s.d.), CI = −8.38 to 3.93, not significant (ns); yellow light, mean difference = −6.44 ± 8.4 % (s.d.), CI = −16.86 to 3.98, ns.
Extended Data Fig. 7
Extended Data Fig. 7. The duration of motor arrest is time-locked to Chx10-PPN activation and the evoked respiratory changes are a direct effect of Chx10-PPN neuron activation decoupled from motor arrest.
a, Example traces of respiratory (top, cyan), cardiac (middle, orange) and motor activity (bottom, magenta) from unrestrained mice recorded in the plethysmograph during a 20-second-long stimulation train with blue-light activating Chx10-PPN neurons. The horizontal dashed line marks the inactivity threshold; inactive periods are tagged in gray. Activation of Chx10-PPN neurons (blue shade) leads to motor arrest for the entire duration of the stimulus. Mice first exhibit apnea for up to ~3.5 seconds but resume slow breathing afterwards ensuring survival. b, Example intercostal EMG recordings upon activation of ChR2-expressing Chx10-PPN neurons during anesthesia. Top, example trial where activation leads to apnea. Bottom, example trial where activation leads to a reduction of the respiratory frequency. In both cases heart beats are shown in orange below the EMG recordings. c, Raster plots and peri-stimulus time histograms of trials where stimulation leads to apnea (left; N = 2 mice, n = 50 trials) or to frequency reduction (right; N = 8 mice, n = 220 trials). RR, respiratory rate. d, Three examples of intercostal EMGs during anesthesia upon delivery of short 250 ms trains of blue light (40 Hz, 10 ms pulse width) to activate ChR2-expressing Chx10-PPN neurons. Cyan rectangles mark the expected position of the respiratory bursts based on the burst timing prior to light stimulation. The mismatch between actual and expected burst timing in the middle and bottom traces shows that activation of Chx10-PPN neurons has a direct effect on respiration and is able to disturb the respiratory period. e, Population level quantification of the effect over the respiratory rhythm shown in d depicted as a phase response curve (N = 8 mice, n = 293 trials). The x axis corresponds to the time within the respiratory period (P) when the stimulation train starts. Within P, the inspiratory phase extends (EMG burst) approximately from 0 to 0.3. The y axis corresponds to the value (R) of the respiratory phase shift (if any) happening during P, calculated as shown in the explanatory diagram (left). R values between 0.4 and 0.6 indicate no change in P as exemplified in d (top). R values > 0.6 indicate a prolonged P with two possible scenarios depending on stimulus timing: if the stimulation overlaps with the burst onset, it leads to the silencing of the inspiratory burst and subsequent phase advance and resetting of the inspiratory rhythm as exemplified in d (middle); if the stimulations strictly overlaps with the expiratory phase, it delays the next burst without resetting of the rhythm as exemplified in d (bottom). In all panels blue shades delimit stimulus duration.
Extended Data Fig. 8
Extended Data Fig. 8. Distribution of Chx10+ neurons within the vlPAG, optic fiber positions, limb coordination, conditioned place aversion test, and heart and respiratory changes upon Chx10-vlPAG neuron activation.
a, Coronal plane schematics highlighting the vlPAG (blue) at different levels of its rostro-caudal axis. b, Spatial distribution of Chx10+ (cyan, Chx10Cre; R26RtdTomato reporter mouse) and ChAT+ (magenta, antibody) neurons along the rostro-caudal axis of the vlPAG. Only the coronal levels shared with the PPN are shown to facilitate comparison (see Fig. 1) although the vlPAG extends further caudally. C, caudal; R, rostral; D, dorsal; V, ventral; M, medial; L, lateral. c, Quantification of Chx10+ (cyan) and ChAT+ (magenta) neuron densities at four coronal levels of the vlPAG: −4.96 and −4.72 mm from the caudal half, −4.48 and −4.24 mm from the rostral half. For each cell type: hollow circles are individual mice and filled circles the group average (N = 3 mice, 1 hemi-section/level/mouse). d, Reconstruction of the optic fiber tip position in all Chx10Cre; R26RChR2 mice used for Chx10-vlPAG neuron stimulation experiments (N = 6) and example fluorescence photomicrograph of optic fiber placement. The white arrowhead points to the tip of the optic fiber. Scale bar 500 µm. e, Phase values for left-right hindlimb (LHRH) coordination during locomotion in the linear corridor temporarily interrupted by optogenetic Chx10-vlPAG neuron stimulation (N = 6, n = 35 trials total, 3–8 trials/mouse). f, Left-right hindlimb coordination during arrest for Chx10-vlPAG (left) and Chx10-PPN (right) represented by the line that unites the left and right hind-paws corrected for body axis. Each gray line corresponds to a trial in the linear corridor. Dashed blue lines correspond to the body axis. g, Conditioned place aversion (CPA) timeline (left) and quantification (right) of the percentage of time that mice spent in their preferred chamber before (‘Pre’) and after (‘Post’) conditioning with blue light (10 ms pulse width, 1 s train duration, 40 Hz; 1 s ON / 9 s OFF in a 30-minute session) in (N = 6 mice). Two tailed Wilcoxon matched-pairs signed rank test, ‘Post’ vs. ‘Pre’: not significant (ns). h, Z-score for respiratory rate (RR; left, blue lines) and heart rate (HR; right, orange lines) changes evoked upon Chx10-vlPAG neuron activation with 3 s of blue light. Each line represents a mouse (N = 6 mice for 3 s). Blue shades delimit light stimulus duration.
Extended Data Fig. 9
Extended Data Fig. 9. Representative images of the anterograde tracing and lack of projections to the contralateral PPN.
a, Example confocal photomicrographs at three different brainstem levels (coronal plane) from a Chx10Cre mouse unilaterally injected in the PPN with the anterograde tracer AAV-FLEX-tdTom-T2A-SypGFP to reveal the projection pattern of Chx10-PPN neurons. Left, single-channel images (grayscale) of brainstem coronal sections (excluding cerebellum) at −6.0, −6.84, and −7.32 mm from bregma. White fluorescence signal corresponds to tdTomato, which fills the cell-bodies and fibers of the transfected Chx10-PPN neurons. The whole tissue and associated anatomical landmarks are visible through background auto-fluorescence. Dashed turquoise squares delineate the magnified areas to the right. Scale bars 500 µm. Right, multi-channel composite images of the magnified areas on the left containing a fluorescent Nissl stain (NeuroTrace, cyan), fibers from the transfected Chx10-PPN neurons (tdTomato, magenta), and their synaptic boutons (SypGFP, yellow). Scale bars 200 µm. b, Left, example single-channel (grayscale) confocal photomicrograph of a coronal spinal cord section at C2 level (high cervical spinal cord) where white fluorescence signal corresponds to tdTomato as in a, showing very sparse labelling. Right, digital reconstruction of putative synaptic bouton positions (digital SypGFP, cyan) from the example cervical spinal cord image on the left. The pie chart depicts the percentage of boutons ipsilateral (ipsi, gray) or contralateral (contra, black) to the injection site. Scale bars 500 µm. c, Normalized bouton density (boutons/mm2) at the injection site (PPN, ipsilateral, gray), compared to the contralateral PPN (black). Chx10-PPN neurons do not project to the contralateral PPN. Solid circles (ipsi, gray; contra, black) are the group average (all mice), error bars represent s.e.m., and hollow circles individual mice (N = 4 mice).
Extended Data Fig. 10
Extended Data Fig. 10. Extended overview of the anterograde tracing from Chx10-PPN neurons.
a, Quantification from an extended selection of structures along the nervous system that receive projections from Chx10-PPN neurons. Left, normalized bouton density (boutons/mm2) at each anatomical structure where the min-max scaling is based on the densest structure for each mouse excluding the injection site. Right, fraction of the total output that innervates each anatomical structure, calculated as the fraction of boutons quantified within each structure from the total number of boutons segmented in that mouse. Each anatomical structure is represented by a single value per mouse comprising both the ipsilateral and contralateral sides. Nevertheless, most of the boutons for all structures are found ipsilateral to the site of injection (see Fig. 6 and Extended Data Fig. 9). The inclusion of structures in the table is based on the presence of innervation and/or general interest. Not all brain structures were analyzed and, for the sake of space, not all analyzed structures are included in the table. The overall order of appearance in the table is from rostral (top part of the table) to caudal. However, the classification into the main brain areas and the order within them was set based on the first appearance of each structure on the reference mouse brain atlas (Franklin & Paxinos) starting from caudal to rostral. Therefore, some structures may belong to two different areas but are here classified as belonging to the caudal most of the two. Black solid circles are the group average (all mice), error bars represent s.e.m., and hollow circles individual mice (N = 4 mice).

References

    1. Eagle DM, et al. Stop-signal reaction-time task performance: role of prefrontal cortex and subthalamic nucleus. Cereb. Cortex. 2008;18:178–188. - PubMed
    1. Mirabella G, Pani P, Ferraina S. Neural correlates of cognitive control of reaching movements in the dorsal premotor cortex of rhesus monkeys. J. Neurophysiol. 2011;106:1454–1466. - PubMed
    1. Schmidt R, Leventhal DK, Mallet N, Chen F, Berke JD. Canceling actions involves a race between basal ganglia pathways. Nat. Neurosci. 2013;16:1118–1124. - PMC - PubMed
    1. Logan GD, Van Zandt T, Verbruggen F, Wagenmakers E-J. On the ability to inhibit thought and action: general and special theories of an act of control. Psychol. Rev. 2014;121:66–95. - PubMed
    1. Wessel JR, Aron AR. On the globality of motor suppression: unexpected events and their influence on behavior and cognition. Neuron. 2017;93:259–280. - PMC - PubMed

Publication types