Clinical Trial
. 2023 Aug;29(8):2099-2109.
doi: 10.1038/s41591-023-02452-y. Epub 2023 Jul 27.

Mesothelin-targeting T cell receptor fusion construct cell therapy in refractory solid tumors: phase 1/2 trial interim results

Affiliations
Clinical Trial

Mesothelin-targeting T cell receptor fusion construct cell therapy in refractory solid tumors: phase 1/2 trial interim results

Raffit Hassan et al. Nat Med. 2023 Aug.

Abstract

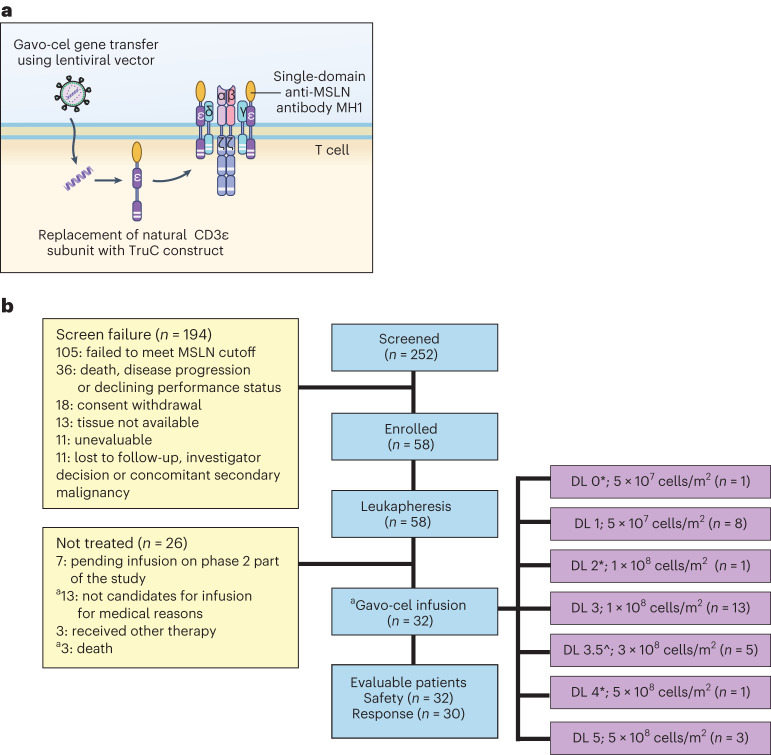
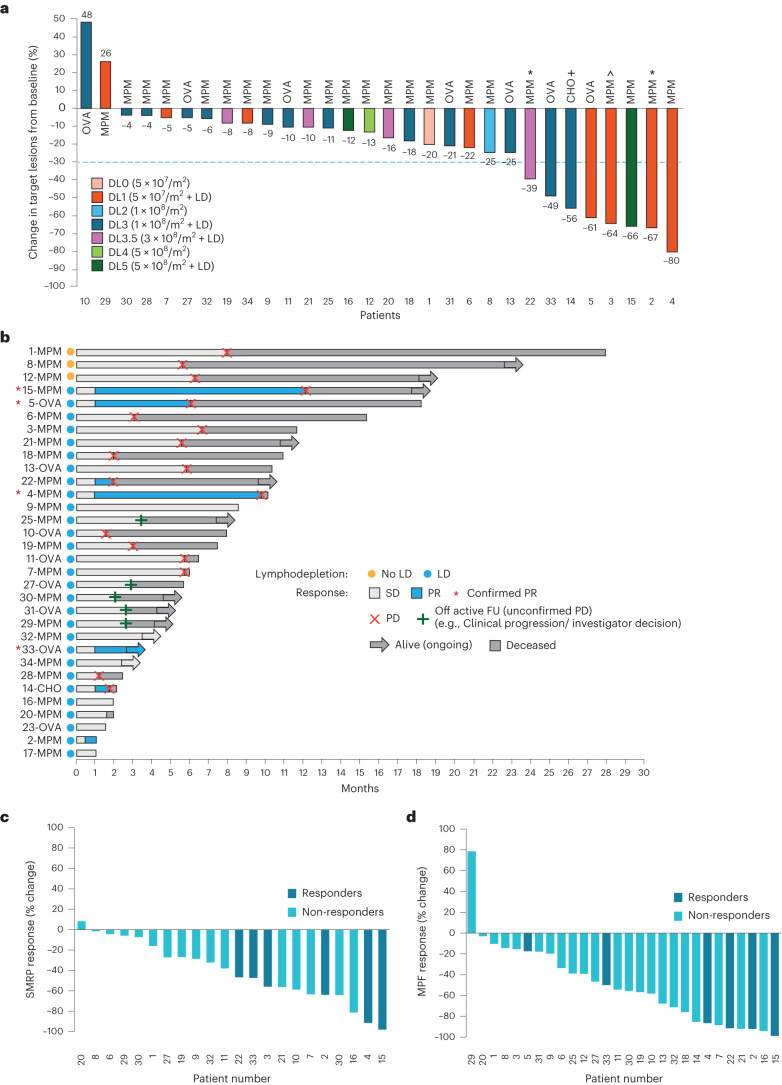
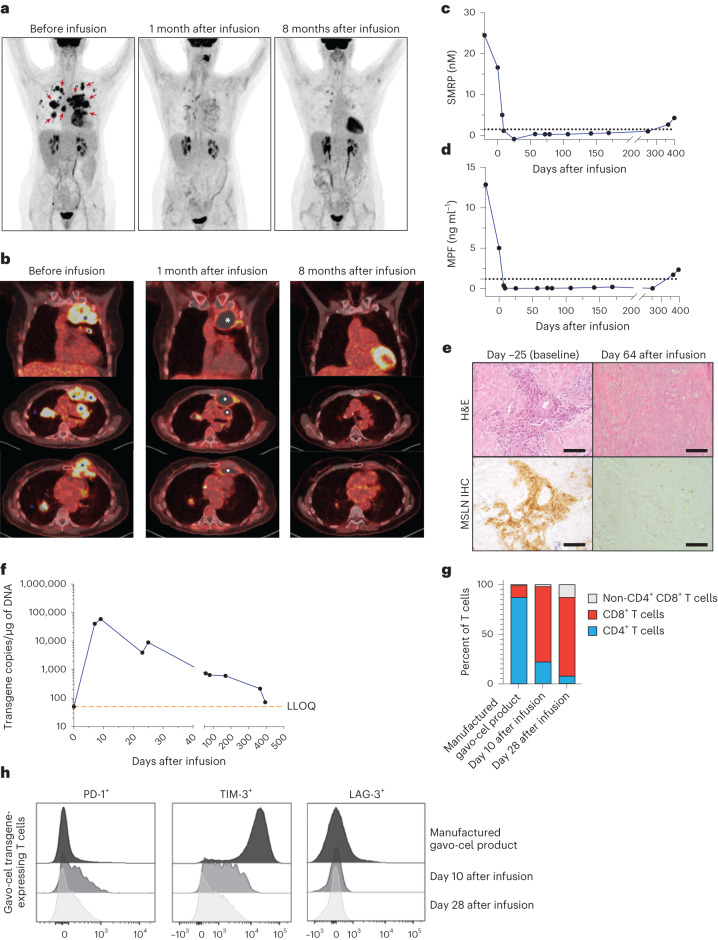
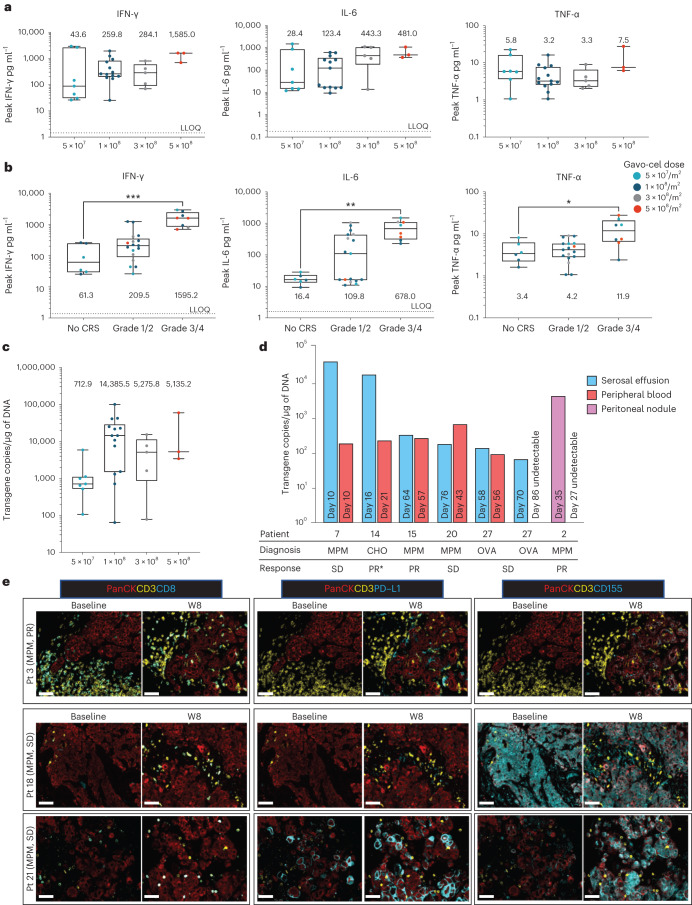
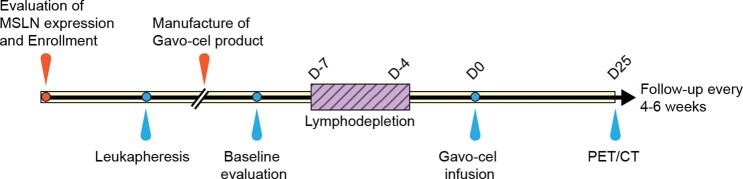
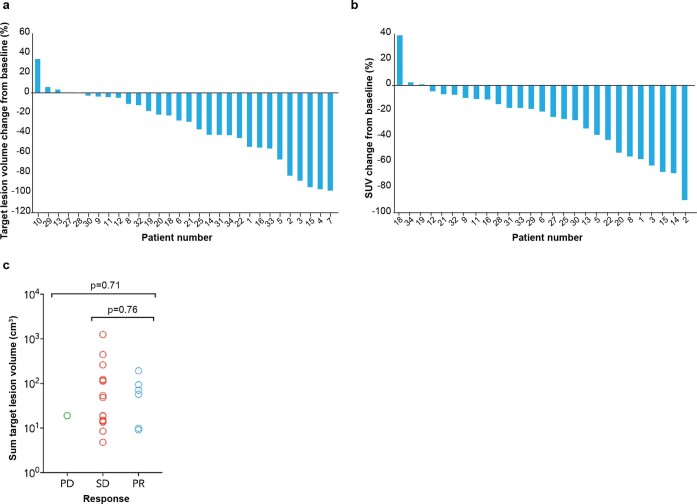
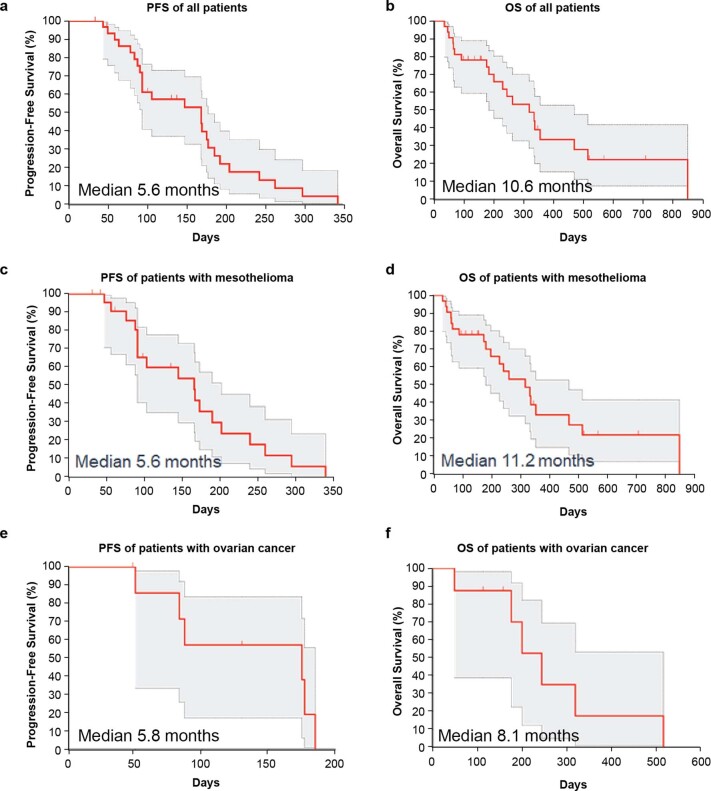
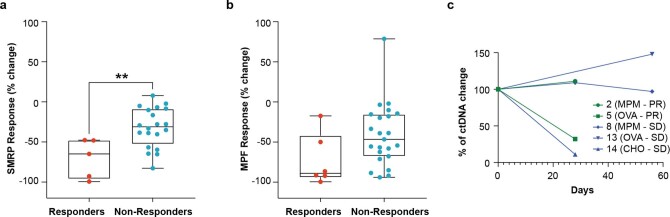
The T cell receptor fusion construct (TRuC) gavocabtagene autoleucel (gavo-cel) consists of single-domain anti-mesothelin antibody that integrates into the endogenous T cell receptor (TCR) and engages the signaling capacity of the entire TCR upon mesothelin binding. Here we describe phase 1 results from an ongoing phase1/2 trial of gavo-cel in patients with treatment-refractory mesothelin-expressing solid tumors. The primary objectives were to evaluate safety and determine the recommended phase 2 dose (RP2D). Secondary objectives included efficacy. Thirty-two patients received gavo-cel at increasing doses either as a single agent (n = 3) or after lymphodepletion (LD, n = 29). Dose-limiting toxicities of grade 3 pneumonitis and grade 5 bronchioalveolar hemorrhage were noted. The RP2D was determined as 1 × 10⁸ cells per m2 after LD. Grade 3 or higher pneumonitis was seen in 16% of all patients and in none at the RP2D; grade 3 or higher cytokine release syndrome occurred in 25% of all patients and in 15% at the RP2D. In 30 evaluable patients, the overall response rate and disease control rate were 20% (13% confirmed) and 77%, respectively, and the 6-month overall survival rate was 70%. Gavo-cel warrants further study in patients with mesothelin-expressing cancers given its encouraging anti-tumor activity, but it may have a narrow therapeutic window. ClinicalTrials.gov identifier: NCT03907852 .


Conflict of interest statement

R.H. has received funding from the Intramural Research Program of the National Institutes of Health (NIH), National Cancer Institute (NCI), Center for Cancer Research (ZIA-BC-010816) and has received funding for conduct of clinical trials via a cooperative research and development agreement between NCI and Bayer AG and TCR2 Therapeutics. D.Y.O. is supported by NIH K08AI139375, a Young Investigator Award from the Prostate Cancer Foundation and the Damon Runyon Clinical Investigator Award (110-21); has received research support from Merck, PACT Pharma, the Parker Institute for Cancer Immunotherapy, Poseida Therapeutics, Roche/Genentech and Nutcracker Therapeutics; and has received travel/accommodations from Roche/Genentech. M.J. has received research funding, all payments made to the institution, from AbbVie, Acerta, Adaptimmune, Amgen, Apexigen, Arcus Biosciences, Array BioPharma, Artios Pharma, AstraZeneca, Atreca, BeiGene, BerGenBio, BioAtla, Black Diamond, Boehringer Ingelheim, Calithera Biosciences, Carisma Therapeutics, Corvus Pharmaceuticals, Curis, CytomX, Daiichi Sankyo, Dracen Pharmaceuticals, Dynavax, Eli Lilly, Elicio Therapeutics, EMD Serono, EQRx, Erasca, Exelixis, Fate Therapeutics, Genentech/Roche, Genmab, Genocea Biosciences, GlaxoSmithKline, Gritstone Oncology, Guardant Health, Harpoon, Helsinn Healthcare SA, Hengrui Therapeutics, Hutchison MediPharma, IDEAYA Biosciences, IGM Biosciences, Immunocore, Impact, Incyte, Janssen, Kadmon Pharmaceuticals, Kartos Therapeutics, Loxo Oncology, Lycera, Memorial Sloan Kettering Cancer Center, Merck, Merus, Mirati Therapeutics, NeoImmune Tech, Neovia Oncology, Novartis, Numab Therapeutics, Nuvalent, OncoMed Pharmaceuticals, Palleon Pharmaceuticals, Pfizer, PMV Pharmaceuticals, Rain Therapeutics, RasCal Therapeutics, Regeneron Pharmaceuticals, Relay Therapeutics, Revolution Medicines, Ribon Therapeutics, Rubius Therapeutics, Sanofi, Seven and Eight Biopharmaceuticals/Birdie Biopharmaceuticals, Shattuck Labs, Silicon Therapeutics, Stem CentRx, Syndax Pharmaceuticals, Takeda Pharmaceuticals, Tarveda, TCR2 Therapeutics, Tempest Therapeutics, Tizona Therapeutics, TMUNITY Therapeutics, Turning Point Therapeutics, the University of Michigan, Vyriad and Y-mAbs Therapeutics. M.J. has a consulting/advisory role, all payments made to the institution, with AbbVie, Amgen, Astellas, AstraZeneca, Axelia Oncology, Black Diamond, Calithera Biosciences, Checkpoint Therapeutics, CytomX Therapeutics, Daiichi Sankyo, EcoR1, Editas Medicine, Eisai, Roche/Genentech, Genmab, Genocea Biosciences, GlaxoSmithKline, Gritstone Oncology, Ideaya Biosciences, iTeos, Janssen, Eli Lilly, Merck, Mirati Therapeutics, Molecular Axiom, Novartis, Oncorus, Pyramid Biosciences, Regeneron Pharmaceuticals, Revolution Medicines, Ribon Therapeutics, Sanofi-Aventis, Takeda Pharmaceuticals, Turning Point Therapeutics and VBL Therapeutics. K.Z., M.S., M.R. and A.Q.-C. are employed by TCR2 Therapeutics and received stock options as a condition of employment. D.H. has received research grants paid to the institution from AbbVie, Adaptimmune, Adlai Nortye, Amgen, AstraZeneca, Bayer, Bristol Myers Squibb, Daiichi Sankyo, Deciphera, Endeavor, Erasca, F. Hoffmann-La Roche, Fate Therapeutics, Genentech, Genmab, Immunogenesis, Infinity, Merck, Mirati Therapeutics, Navier, NCT-CTEP, Novartis, Numab, Pfizer, Pyramid Bio, Revolution Medicine, SeaGen, STCube, Takeda, TCR2 Therapeutics, Turning Point Therapeutics and VM Oncology. D.H. has a consultant/advisory role (personal) with Acuta, Adaptimmune, Alkermes, Alpha Insights, Amgen, Aumbiosciences, Axiom, Baxter, Bayer, Boxer Capital, BridgeBio, COG, COR2ed, Cowen, Ecor1, Erasca, F. Hoffmann-La Roche, Genentech, Gennao Bio, Gilead, GLG, Group H, Guidepoint, HCW Precision Oncology, Immunogenesis, Janssen, Liberium, MedaCorp, Medscape, Numab, Oncologia Brasil, ORI Capital, Pfizer, Pharma Intelligence, POET Congress, Prime Oncology, Rain Therapeutics, SeaGen, STCube, Takeda, Tavistock, Trieza Therapeutics, Turning Point Therapeutics, WebMD, YingLing Pharma and Ziopharm. D.H. receives support for attending meetings and/or travel from the American Association for Cancer Research, the American Society of Clinical Oncology, Bayer, Genmab, SITC and Telperian. He has stock or stock options from Molecular Match, OncoResponse and Telperian. M.B., R.O.C. and J.L.T. report having received research support from TCR2 Therapeutics for the conduct of the present trial. A.G., N.N.S., B.S. and L.C. declare no conflicts of interest.

Figures

Fig. 1
Fig. 1. Gavo-cel construct and CONSORT diagram.
a, Schematic diagram of gavo-cel. The patient’s autologous T cells are transduced with lentivirus carrying a plasmid encoding for an anti-mesothelin, llama-derived, single-domain antibody (MH1) fused to the CD3ε subunit using a linker sequence. Upon translation, the gavo-cel transgene integrates into the native TCR complex, exploiting the native TCR-driven T cell activation, effector function and regulation. b, CONSORT diagram showing patients enrolled and treated at different DLs. * Without lymphodepletion; a ITT patient population—patients who signed informed consent and underwent leukapheresis with the intent to receive gavo-cel as part of the phase 1 portion of the study; ^ Split dose of 1 × 108 and 2 × 108 cells on days 0 and 3. MSLN, mesothelin.
Fig. 2
Fig. 2. Efficacy of gavo-cel treatment.
a, Waterfall plot showing maximum change in target lesion size from baseline in evaluable patients (n = 30) as assessed by BICR. Bars are colored according to DLs. * Patients 2 and 22 had an unconfirmed PR; + patient 14 had an unconfirmed PR by local investigator assessment; ^ patient 3 showed more than 30% regression of target lesions on a 6-month CT scan but also a new lesion that prevented the patient from achieving a PR. CHO, cholangiocarcinoma; OVA, ovarian cancer. b, Swimmer plot showing best responses of each patient over time, assessed according to RECIST version 1.1. * confirmed PR. c,d, Changes in circulating surrogate markers of tumor response. Waterfall plots showing best response (% change from baseline) and SMRPs as measured in plasma using the MESOMARK assay (c) and MPF as measured in plasma using an ELISA assay (d). Responders (partial or complete response) and non-responders (SD and PD) are indicated by color-coded bars. FU, follow-up. Source data
Fig. 3
Fig. 3. Tumor regression in a patient (patient 15) with MPM after gavo-cel treatment.
a, Frontal view of 18F-FDG PET maximum intensity projection obtained before infusion, approximately 1 month after infusion and 8 months after infusion. Areas of tumor involvement are indicated by red arrows. b, Representative PET–CT images obtained at the same timepoints as in a. Top part of b is coronal image at level of ascending aorta; middle part is axial section at level just below carina; and lower part is axial section at level of base of heart. Tumor areas are indicated by blue asterisk, and fluid-filled regions after tumor regression are marked with white asterisk. c,d, Circulating surrogate tumor response biomarker. c, Decrease in SMRP after gavo-cel infusion. d, Decrease in MPF level after infusion. e, Mesothelin-specific cell killing in post-infusion tumor biopsy. Tumor biopsies obtained at enrollment and 64 d after gavo-cel infusion were stained with hematoxylin and eosin (H&E) (top). Mesothelin expression was evaluated by IHC (bottom). H&E staining indicated the presence of epithelioid malignant mesothelioma, with most tumor cells showing 3+ mesothelin staining intensity at baseline. The tumor biopsy obtained 8 weeks after gavo-cel infusion showed complete tumor necrosis with loss of mesothelin expression in dead cells. Experiment was performed once on patient samples collected at different timepoints. Inset scale bars, 100 µM. f, Persistence of gavo-cel in peripheral blood after infusion by qPCR. Peak expansion was observed at day −10, followed by a contraction phase that plateaued approximately 60 d after infusion, with gavo-cel T cells remaining detectable at the latest measurement: 1 year after infusion. g, Phenotypic analysis of gavo-cel product and post-infusion kinetics. Proportion of CD4+ and CD8+ T cell subsets in manufactured gavo-cel product and in the gavo-cel transgene-expressing T cells obtained from peripheral blood of the patient after infusion. h, Exhaustion markers in gavo-cel manufactured product and in the gavo-cel transgene-expressing T cells obtained from the patient’s peripheral blood after the infusion. Expression of PD-1, TIM-3 and LAG-1 in manufactured gavo-cel product, on gavo-cel transgene-expressing T cells on days 10 and 28 after infusion. MSLN, mesothelin. Source data
Fig. 4
Fig. 4. Cytokine response, gavo-cel expansion and persistence.
a,b, Peak cytokine response by DL and correlation of peak cytokine levels with CRS. Plasma cytokine levels were measured longitudinally in the peripheral blood using a validated multiplexed immunoassay (MSD). Horizontal lines and boxes show the medians and interquartile ranges. a, Peak levels of IFN-γ, IL-6 and TNF-α after gavo-cel infusion in patients who received LD (for the 5 × 107/m2 cohort, n = 7 independent patient samples; for the 1 × 108/m2 cohort, n = 13 independent patient samples; for the 3 × 108/m2 cohort, n = 5 independent patient samples; for the 5 × 108/m2 cohort, n = 3 independent patient samples). b, Correlative analysis of peak IFN-γ, IL-6 and TNF-α levels with grade of CRS (for the no-CRS cohort, n = 6 independent patient samples; for the grade 1/2 cohort, n = 17 independent patient samples; for the grade 3/4 cohort, n = 8 independent patient samples; statistical significance was determined by one-way Kruskal−Wallis ANOVA: IFN-γ ***P = 0.0003; IL-6 **P = 0.02; TNF-α *P = 0.002). c,d, Expansion and persistence of gavo-cel. Gavo-cel expansion was monitored by qRT–PCR c, Peak expansion (Cmax) levels of gavo-cel T cells in peripheral blood by DL shows maximum expansion in DL 1 × 108/m2 (for the 5 × 107/m2 cohort, n = 7; for the 1 × 108/m2 cohort, n = 14; for the 3 × 108/m2 cohort, n = 5; for the 5 × 108/m2 cohort, n = 3). For box plots: center line, box limits and whiskers represent the median, interquartile range and minima and maxima, respectively. d, Expansion of gavo-cel T cells in malignant serosal effusions, peripheral blood and peritoneal nodule. Experiment was performed once on each independent patient sample. CHO, cholangiocarcinoma; OVA, ovarian cancer; PR*, partial response by investigator assessment. e, Characterization of TME before and after gavo-cel infusion by multiplex immunofluorescence. Multiplex immunofluorescent staining was performed for cytokeratin (PanCK, tumor marker), CD3 (pan-T cell marker), CD8, PD-L1 and CD155 in MPM tumor biopsies taken at baseline and at week 8 after gavo-cel infusion from patient 3, who achieved a PR by best target lesion response, and patients 18 and 21, both having a best response of SD. Experiment was performed once on each independent patient sample. Scale bars, 50 µM. Pt, patient; W, week. Source data
Extended Data Fig. 1
Extended Data Fig. 1. Schematic representation of the Gavo-cel study design.
Tumor biopsies were evaluated for mesothelin (MSLN) expression at enrolment, followed by leukapheresis and gavo-cel manufacture. The enrolled patients underwent lymphodepletion with fludarabine at 30 mg/m2/day, from days -7 to -4 and cyclophosphamide at 600 mg/m2/day from days -6 to -4. On day 0, they were infused with different doses of gavo-cel. Positron emission tomography (PET) and computerized tomography (CT) scans were performed at baseline, and at 1, 2, 3, 6 and 9, and 12 months after gavo-cel infusion.
Extended Data Fig. 2
Extended Data Fig. 2. Tumor Response to gavo-cel treatment.
a–b, Volumetric and Metabolic Response to gavo-cel treatment. a, Volumetric analysis. Maximum reduction of sum of volumes of target lesions post gavo-cel infusion. b, Metabolic response analysis. Maximum reduction of standardized uptake value (SUV) of the target lesion with the highest SUV assessed at the baseline visit (that is prior to gavo-cel infusion). c, Baseline target lesion volume and response to gavo-cel treatment. Baseline target lesion volume does not correlate with radiological response assessment. The p values were calculated using the Kruskal-Wallis test for n = 29 patients who were treated with gavo-cel.
Extended Data Fig. 3
Extended Data Fig. 3. Survival after gavo-cel treatment.
a-f. PFS and OS curves were estimated by the Kaplan-Meier method. n = 32 patients infused with gavo-cel, including 30 who completed at least 12 weeks of follow-up visits. a, Progression Free Survival in all patients (5.6 months, 95% CI, 3.1, 5.8, n = 32). b, Overall survival in all patients. (10.6 months, 95% CI, 6.6, 15.6) c, Progression Free Survival in patients with mesothelioma (5.6 months, 95% CI, 3.1, 5.8, n = 23). d, Overall survival in patients with mesothelioma (11.2 months, 95% CI, 6.0, 15.6). e, Progression Free Survival in patients with ovarian cancer (5.8 months, 95% CI, 1.6, 6.1, n = 8). f, Overall survival in patients with ovarian cancer (8.1 months, 95% CI, 1.6, 17.1).
Extended Data Fig. 4
Extended Data Fig. 4. Changes in circulating surrogate tumor markers correlate with radiographic tumor response.
SMRP was measured in plasma using the Mesomark™ assay and MPF was measured in plasma using an ECL assay and ctDNA was measured using a plasma based NGS assay. Comparative analysis of a, best SMRP response (n = 25 independent patient samples, **p = 0.074 by two-tailed Mann Whitney t test. and b, best MPF response in responders vs. non-responders. (n = 29 independent patient samples). For both a, and b, patients classified as non-evaluable by RECIST response were excluded from the analysis. For both box-plots; center line, box limits and whiskers represent the median, interquartile range and minima and maxima, respectively. c, Longitudinal changes in ctDNA levels in selected patients. Source data
Extended Data Fig. 5
Extended Data Fig. 5. Response in a patient with malignant pleural mesothelioma.
a, Systemic inflammation following gavo-cel treatment. a, Increase in serum lactate dehydrogenase (LDH) after infusion of gavo-cel that peaked at day 9. It gradually decreased to reach normal range by day 142 (normal range: 125–220 U/mL). b, Mesothelin expression in tumor biopsy after progression. Tumor biopsy obtained after progression on day +365 shows mesothelin expression. Experiment performed once on patient samples. Inset scale bars represents 100 µM. c, Persistence of gavo-cel in peripheral blood post-infusion by flow cytometry. Flow cytometry analysis of PBMCs isolated from peripheral blood and stained with anti-VHH antibody showed 50.7% cells being TRuC+ on day 10. On day 28 this was reduced to 13.3%, whereas on day 56, 0.5% cells were detected as TRuC+. d, Phenotypic analysis of gavo-cel product. Flow-cytometric analysis of the different T cell subsets in the manufactured gavo-cel product that was infused into the patient. Phenotyping revealed a predominance of stem cell memory (TSCM) and naïve T (TN) cells, with the majority of the remaining T cells having a central memory T cell (TCM) phenotype. The proportion of TSCM and TN was similar in the CD4+ and CD8 + T cell subsets. TEM, T effector memory cell; TEMRA, effector memory T cells re-expressing CD45RA. Source data
Extended Data Fig. 6
Extended Data Fig. 6. Tumor response in patients with MPM and ovarian cancer.
Tumor regression in a 36-year-old male with epithelioid malignant peritoneal mesothelioma treated at dose level 1 after checkpoint inhibitor failure. a, Representative MRI images at baseline and CT scan images 6 months post gavo-cel infusion showing complete tumor regression of lesion abutting the left kidney (lesion 1) and reduction in size of the tumor in the peritoneal reflection of the rectum (lesion 2). b–c, Circulating surrogate biomarkers of tumor response. b, Decrease in serum SMRP and c, MPF levels following gavo-cel infusion. Tumor regression in a 70-year-old female with platinum refractory high grade serous ovarian cancer treated at dose level 1. d, Representative CT scan images show regression in target lesion size of mediastinal lymph node (lesion 1) and abdominal retro-caval lymph node (lesion 2) at 1- and 3- months after gavo-cel infusion and maintained up to 6 months post treatment. The measurements denote the size of the target lesions Source Data.
Extended Data Fig. 7
Extended Data Fig. 7. Characterization of gavo-cel T cell products (TCPs).
Flow cytometry methods were used to characterize TCPs. a, Median fold expansion of the TCPs during the manufacturing process was 30.9 (n = 32 independent patient samples). b, Percent of TRuC+ T cells was 47.9% (n = 22 independent patient samples). c, The ratio of CD4+ to CD8 + T cells was 2.65 (n = 32 independent patient samples). For box-plots, center line, box limits and whiskers represent the median, interquartile range and minima and maxima, respectively. d, Memory subset composition using the markers CD45RA and CCR7 showed variable composition of stem cell memory (TSCM) and naïve T cells, central memory T cell (TCM), T effector memory cell (TEM) and effector memory T cells re-expressing CD45RA (TEMRA subsets). e, Expression of the exhaustion markers TIM-3, PD-1, and LAG-3 were determined by flow-cytometry. TIM-3 expression was high, PD-1 was variable, and LAG-3 was low. (n = 22 independent patient samples) For box plots; center lines, box limits and whiskers represent the median, interquartile range and minima and maxima, respectively. f–g, Gavo-cel T cell products TCPs show robust polyfunctionality. Multiplexed assessment of cytokine production at the single cell level was performed by Isoplexis assay in isolated f, CD4+ (n = 8 independent patient samples) and g, CD8 + T cells within gavo-cel TCPs. (n = 8 independent patient samples) Polyfunctionality of T cells defined as a cell co-secreting 2 or more cytokines were analyzed by the IsoSpeak software across the seven functional groups. The polyfunctional strength Index (PSI) of T cells was defined as the percentage of polyfunctional cells, multiplied by the sum of the mean fluorescence intensity (MFI) of the proteins secreted by those cells: PSI = (% polyfunctional cells in sample) x ∑(MFI of all 32 secreted proteins of the polyfunctional cells).TCP predominantly secreted effector, stimulatory, and chemo attractive proteins Source. Source data
Extended Data Fig. 8
Extended Data Fig. 8. Expansion and persistence of gavo-cel in peripheral blood.
a, Kinetics of gavo-cel T cell expansion and persistence in peripheral blood by qPCR-based detection of specific TRuC-encoding proviral sequences in genomic DNA. Patients are grouped by dose level. b, Gavo-cel expansion and persistence over time in peripheral blood and at specific time points in cancerous tissues. Pink squares denote gavo-cel transgene level in serosal effusion; green circle denotes gavo-cel transgene level in peritoneal mesothelioma nodule. *Partial response by local investigator assessment. Source Data
Extended Data Fig. 9
Extended Data Fig. 9. PD1 expression and T cell clonotypic expansion in blood post-gavo-cel infusion.
a, PD1 expression. Percent of PD1 positive gavo-cel T cells in the manufactured T cell product (TCP) and at different time-points post infusion. Circles denote subjects with stable disease whereas triangles denote subjects that achieved a partial response. These data show that irrespective of response, PD-1 expression on gavo-cel T cells increases post-infusion. b–g, Clonotypic analysis was performed by TCRB CDR3 sequencing. b, Downsampled richness as a measure of clonal diversity in analyzed TCPs. (n = 13 independent patient samples) c, Analysis of downsampled richness in the blood at baseline and longitudinally for all available subjects post-infusion. (n = 30 subjects, with varying longitudinally sample availability, baseline vs. week 4 ***p = 0.001, baseline vs. week 12 * p = 0.0473) d, Longitudinal analysis of total expanded clones for all available patients. e–f, Top 100 T cell product (TCP) clones and the sum frequency of clones found in peripheral blood over time (up to 52 weeks) are shown for all analyzed subjects. (n = 8 subjects, with varying longitudinally sample availability) g, Proportion of expanded clones found in the TCP. (n = 12 independent patients, with varying longitudinally sample availability). For c, e, f Statistical significance was determined by Kruskal-Wallis ANOVA and a Dunn’s multiple comparison to determine the p-value. For box-plots; center line, box limits and whiskers represent the median, interquartile range and minima and maxima, respectively. Source Data

References

    1. Chang K, Pastan I. Molecular cloning of mesothelin, a differentiation antigen present on mesothelium, mesotheliomas, and ovarian cancers. Proc. Natl Acad. Sci. USA. 1996;93:136–140. doi: 10.1073/pnas.93.1.136. - DOI - PMC - PubMed
    1. Ordonez NG. Application of mesothelin immunostaining in tumor diagnosis. Am. J.Surg. Pathol. 2003;27:1418–1428. doi: 10.1097/00000478-200311000-00003. - DOI - PubMed
    1. Weidemann S, et al. Mesothelin expression in human tumors: a tissue microarray study on 12,679 tumors. Biomedicines. 2021;9:397. doi: 10.3390/biomedicines9040397. - DOI - PMC - PubMed
    1. Hassan R, Bera T, Pastan I. Mesothelin: a new target for immunotherapy. Clin. Cancer Res. 2004;10:3937–3942. doi: 10.1158/1078-0432.CCR-03-0801. - DOI - PubMed
    1. Hassan R, et al. Mesothelin immunotherapy for cancer: ready for prime time? J. Clin. Oncol. 2016;34:4171–4179. doi: 10.1200/JCO.2016.68.3672. - DOI - PMC - PubMed

Publication types

MeSH terms

Substances

Associated data